

1. Introduction
Poverty and social exclusion in industrialised societies have been traditionally associated with long-term unemployment and household joblessness. To address these issues and to ensure the sustainability of pension and social protection systems in the era of population ageing, many governments across the European Union (EU) and beyond have introduced policies aimed at stimulating labour market participation of the disadvantaged groups such as young, older, low-skilled workers, women and migrants. However, recent evidence shows that in today’s labour market having a job might not in itself guarantee freedom from poverty for the employed and their households. Many EU countries have experienced a rise in in-work poverty rates in recent decades (Eurofound, 2017; European Commission, 2016; Marx and Nolan, Reference Marx and Nolan2012).
In-work poverty is related to precarious employment, including low pay, low work intensity, temporary employment, employment in some sectors of the economy (e.g. service sector) and self-employment (Broughton et al., Reference Broughton, Green, Rickard, Swift, Eichhorst, Tobsch, Magda, Lewandowski, Keister, Jonaviciene, Ramos Martin, Valsamis and Tros2016; Frazer and Marlier, Reference Frazer and Marlier2010; Horemans and Marx, Reference Horemans and Marx2013; Lohmann, Reference Lohmann2009; Lohmann and Marx, Reference Lohmann and Marx2018; Maitre et al., Reference Maitre, Nolan and Whelan2012; McKnight et al., Reference McKnight, Stewart, Himmelweit and Palillo2016; Ray et al., Reference Ray, Sissons, Jones and Vegeris2014; Sissons et al., Reference Sissons, Green and Lee2018; Van Lancker, Reference Van Lancker2011). Nevertheless, while these labour market characteristics are measured at an individual level, in-work poverty is measured at a household level. In other words, an individual is considered as working poor if they are in work (individual level) and their equivalized household income is below the national poverty line (household level). Therefore, characteristics such as the number of children and the labour market status of other adults in the household have been shown to play a major role. As a result, not all precarious workers live in poor households, and not all poor households contain precarious workers. From a policy perspective, in-work poverty patterns are influenced by a large number of institutional factors and the structure of the labour market. Among those, the key to providing in-work poverty reduction is the generosity of the transfer system, e.g. replacement rates of unemployed household members and cash benefits for families (Allègre, Reference Allègre2008; Lohmann, Reference Lohmann2009).
In this paper we focus on a specific group of earners – second earners in multi-earner households. We define the primary or main earner as the person in the household with the highest earnings from work. The second earner is defined as the employed partner of the primary earner or, if the partner is not in work, as the person with the second highest earnings in the household. We seek to quantify the effect of second earners’ employment in preventing in-work poverty in the EU member states and the United Kingdom (UK), and the role of the tax-benefit systems in moderating this risk. Following Eurostat we define in-work poverty as the state when individuals are simultaneously in work and at risk of poverty, i.e. their equivalisedFootnote 1 household disposable income is below the risk-of-poverty threshold, which is set at 60% of the national median equivalised disposable income.
To assess the role of second earnership in preventing in-work poverty, we use regression analysis, and pre-post analysis in combination with microsimulation techniques. In other words, we assess what in-work poverty would be if secondary earners were unemployed. More precisely, we use EUROMOD, the European tax-benefit microsimulation model (Sutherland and Figari, Reference Sutherland and Figari2013), and microdata from the European Statistics on Income and Living Conditions (EU-SILC) and the Family Resource Survey (FRS) for the UK. The analysis in this paper refers to 2014 policies in all countries.
The contribution of this study is twofold. First, we analyse the association between second earnership and in-work poverty in the EU and the UK using regression analysis. Second, we use a pre-post analysis to determine the contribution of second earners in preventing in-work poverty. Our strategy consists of simulating a counterfactual scenario under which second earners become unemployed and assessing how this transition would affect household incomes and in-work poverty, as compared to the status-quo (baseline) situation. By using microsimulation techniques, we can assess the impact of this transition on poverty net of the effects of tax-benefit policies which are targeted at moderating income shocks due to unemployment. We perform regression analyses on a pre- and post-transition sample of workers in multiple-earner households in order to disentangle the impact of the individual, household- and policy-related characteristics on the probability of in-work poverty. Given the nature of our simulations, the results presented in this paper should be interpreted as first-order effects before any behavioural adjustment occurs. Nevertheless, this analysis is relevant for the research question as it provides a transparent quantitative assessment of how important the second earners’ employment is in lifting the working household above the poverty line in European countries.
The remainder of this paper is structured as follows. Section 2 summarises previous research on in-work poverty and second earners in Europe. Section 3 describes the data and the methodology used to quantify the effect of second earnership and government policies on in-work poverty. Section 4 presents and discusses the results of our analysis. Section 5 concludes.
2. In-work poverty and secondary earners: literature review
Since the late 1990s many European countries’ employment policies have become increasingly focused on getting more people into jobs by promoting and enforcing labour market activation measures, such as training and skills development programmes for the unemployed, the sanctioning of individuals not looking for jobs by withdrawing their benefits, in-work benefits, subsidised employment, etc. Raising employment rates to 75% of the population aged 20-64 years has been declared one of the 2020 EU targets. At the same time, the post-industrial economy has been moving towards higher job polarisation, i.e. a growth in employment in the highest-skilled (managerial and professional) and lowest-skilled occupations (unskilled work in service sector) and a decline in demand for individuals with medium skills (Goos and Salomons, Reference Goos and Salomons2009; OECD, 2015). As wage inequality has been on the increase, for the individuals at the bottom of the wage distribution even full-time employment might no longer guarantee a poverty-free existence. As a result, many EU countries have experienced a rise in in-work poverty rates (Eurofound, 2017; European Commission, 2016; Lohmann and Marx, Reference Lohmann and Marx2018; Marx and Nolan, Reference Marx and Nolan2012).
Measuring in-work poverty implies defining ‘work’ and ‘poverty’, respectively. The research on in-work poverty in Europe has been underpinned by different national academic traditions of measuring employment and poverty (for a detailed overview see Eurofound, 2017). In particular, there is no consensus in the literature about a common definition of ‘worker’. Although most studies use information on labour market activity over the year to define work, the duration of activity over the year used to define a person as a ‘worker’ varies across studies (Ponthieux, Reference Ponthieux2010). At the EU-level, the working poor are defined as employed individuals living in households with equivalised disposable income below 60% of the national median (European Commission, 2015). An individual is considered as employed if he/she worked for at least 15 hours a week for more than a half of the past year, that is, his/her typical situation is to be working. Thus, in-work poverty rate is computed as the percentage of individuals who are in work and at risk of poverty among those who are currently in work. Note that the concept of the working poor is different from (although often conflated with) the low-paid worker concept. Low-paid workers are defined by Eurostat as employees who earn two thirds or less of national median gross hourly earnings. Hence, there might be low-paid workers who are not poor, and viceversa.
The way in-work poverty is defined complicates the interpretation of this measure and the identification of its underlying causes. Since individual- and household-level information is combined within this measure, the poverty status of an individual depends not only on his/her own employment characteristics, but also on other household members’ labour market status and on other household characteristics such as the number of dependent children. In addition, the EU definition is restrictive in measuring employment. It results in selecting individuals who are mostly in stable employment, and consequently emphasises the household situation of workers as the prominent factor of poverty risk, while the role of the individual labour market characteristics (such as precarious employment) is downplayed (Ponthieux, Reference Ponthieux2010).
Whatever the metric used, in-work poverty has been shown to be strongly related to precarious employment characteristics, among which the most important are low pay, low work intensity, temporary employment, employment in some sectors of economy such as the service sector, and self-employment (Broughton et al., Reference Broughton, Green, Rickard, Swift, Eichhorst, Tobsch, Magda, Lewandowski, Keister, Jonaviciene, Ramos Martin, Valsamis and Tros2016; Frazer and Marlier, Reference Frazer and Marlier2010; Horemans and Marx, Reference Horemans and Marx2013; Lohmann, Reference Lohmann2009; Lohmann and Marx, Reference Lohmann and Marx2018; Maitre et al., Reference Maitre, Nolan and Whelan2012; McKnight et al., Reference McKnight, Stewart, Himmelweit and Palillo2016; Ray et al., Reference Ray, Sissons, Jones and Vegeris2014; Sissons et al., Reference Sissons, Green and Lee2018; Van Lancker, Reference Van Lancker2011). However, their impact on poverty greatly depends on the mechanisms shaping these types of labour market participation patterns. For example, part-time employment does not necessarily result in in-work poverty unless it represents an inferior form of employment (e.g. due to low pay and job insecurity) (Horemans and Marx, Reference Horemans and Marx2013). The key characteristic of almost all types of precarious work is that they are highly gendered. It has been shown that women tend to forgo better paying, full-time jobs mainly due to their caring responsibilities, while men are more likely to do so for other reasons (OECD, 2011).
At the same time, the effect of individual labour market characteristics on poverty is moderated by household composition. Dual or multiple earnership is one of the most important factors that lifts families out of poverty (Marx and Nolan, Reference Marx and Nolan2012). If a precarious worker is the second earner in the household (which is typically the case for coupled women), their in-work poverty risk might drop to a very low level due to the contribution of the main earner to household income (Ponthieux, Reference Ponthieux, Lohmann and Marx2018). Hence, in this case precarious job characteristics may be the result of choices of activity made in the context of intra-household division of labour. In contrast, precarious workers who are the sole earners in their households are at a substantial risk of poverty, especially if they have dependent children to support. Over the last few decades, all European countries have experienced growth in dual earnership due to increased female labour force participation, albeit with some variation across welfare regimes. In particular there is a higher prevalence of such households in Scandinavian countries and lower prevalence in Southern Europe (Andreβ and Lohmann, Reference Andreβ and Lohmann2008). Since dual earner families have become the most common model among couples in Europe, the relative poverty thresholds are being increasingly defined by two-earner households, which further deteriorates the position of one-earner households (Marx and Nolan, Reference Marx and Nolan2012).
Apart from individual and household characteristics, several studies have looked at the significance of institutional, labour market and demographic factors at the macro-level for in-work poverty. According to Allègre (Reference Allègre2008), social spending as a proportion of GDP is the main factor contributing to lower in-work poverty rates in Europe. Similarly, Lohmann (Reference Lohmann2009) showed that the generosity of the transfer system (replacement rates in case of unemployment and cash benefits for families) is key to explaining both in-work poverty rates and in-work poverty reduction. Filandri and Struffolino (Reference Filandri and Struffolino2019) found a positive association between involuntary part-time employment rate and household in-work poverty and a negative relationship between female labour market participation rate and in-work poverty. In terms of differences across the welfare regimes, Crettaz and Bonoli (Reference Crettaz and Bonoli2010) argue that the characteristics of in-work poverty found in socio-democratic and conservative regimes (in their study represented by Sweden and Germany) are less detrimental than those found in South-European and liberal regimes (represented by Spain and the United States). In the former, in-work poverty is driven by low pay and concentrated on young, single and childless adults, while full-time workers have low in-work poverty rates. In the latter, in-work poverty appears to be driven by a combination of low labour market attachment, low pay and the presence of children. This highlights the crucial role played by government tax-benefit policies in protecting children in working families.
At the same time, it is important to stress that the design of tax-benefit systems has both direct and indirect effects on in-work poverty. While generous direct transfers to low income households with children reduce in-work poverty, they might simultaneously weaken individual incentives to undertake paid work or to increase hours of work for all household members. A high tax burden may produce a similar negative effect on labour market participation (Adam et al., Reference Adam, Brewer and Shephard2006). Empirical studies find that labour supply elasticity is higher for low-income earners, in particular women with children, therefore tax-benefit policies tend to have a disproportionally high negative effect on the employment outcomes of second earners (Evans and Harkness, Reference Evans and Harkness2010; Rastrigina and Vereshchagna, Reference Rastrigina and Vereshchagna2015; Thomas and O’Reilly, Reference Thomas and O’Reilly2016).
3. Methods and data
Our study uses standard pre-post analysis (e.g. see Moller et al., Reference Moller, Huber, Stephens, Bradley and Nielsen2003) in combination with microsimulation techniques in order to assess the role of second earners in preventing in-work poverty. More precisely, we simulate a counterfactual scenario where second earners become unemployed, and assess the effect of such transitions on in-work poverty in all EU countries and the UK. We choose to model the transition to unemployment (rather than inactivity) as it seems to be the most relevant scenario for individuals who currently choose to work. This section provides the definitions of in-work poverty and second earners used in our analysis. We then describe EUROMOD, the European tax-benefit microsimulation model, and the data. Finally, we present the methodology used to assess the impact of secondary earners on in-work poverty.
3.1. Definitions of in-work poverty and second earners
In our analysis, for comparability purposes, we use the EU-level definition of in-work poverty, according to which individuals are considered as working poor if they are currently in work and at risk of poverty, i.e. their equivalised disposable income is below the risk-of-poverty threshold set at 60% of the national median equivalised disposable income. The percentage of working poor is calculated with respect to the total number of individuals who are in work. Individuals are considered to be in work if they have declared themselves employed or self-employed for at least 7 months in the year preceding the survey.
We further define primary or main earner as the person in the household with the highest earnings from work. The second earner is then defined as the employed partner of the primary earner. If the primary earner has no partner or the partner is not in work, the second earner is defined as the person with the second highest earnings.
3.2. EUROMOD and the data
Our analysis makes use of EUROMOD, the European tax-benefit microsimulation model. EUROMOD covers all EU member states and the UK and simulates, in a fully comparable manner, cash benefit entitlements and direct personal tax and social insurance contribution liabilities on the basis of the tax-benefit rules in place and representative household microdata. EUROMOD has been validated at both the micro- and the macro-level and has been tested in numerous policy-relevant research applications (Sutherland and Figari, Reference Sutherland and Figari2013).
The input data for EUROMOD comes from EU-SILC which was designed to be the main statistical source to monitor living standards and social inclusion in the EU in a harmonised manner. EU-SILC contains detailed information on different income sources as well as household and individual characteristics, which are essential for the purpose of microsimulation. Nevertheless, EU-SILC also suffers from some limitations in terms of its applicability for cross-country tax-benefit simulations (Figari et al., Reference Figari, Iacovou, Skew and Sutherland2012). First, some countries in EU-SILC record net income data, whereas the starting point for tax-benefit simulations is gross income. In such cases, a net-to-gross income conversion needs to be performed. Second, the reference period for income is the calendar year prior to the interview, while labour market characteristics are measured at the time of interview. There is therefore a mismatch between income data and labour market information. For this reason, we use the number of months in work over the calendar year to define the status of ‘worker’ in our definition of in-work poverty. Third, the source of information used to collect income data differs across countries. Some countries use survey-based income data and in others, income is based on administrative registers. Survey-based income data are, in general, more prone to issues of underreporting or misreporting, which could result in an upward bias in in-work poverty rates (Jäntti et al., Reference Jäntti, Törmäletho and Marlier2013). Despite these shortcomings, EU-SILC remains a unique resource and the main one for cross-national comparative research on income poverty and inequality in the EU countries and the UK.
In this study we use the 2015 EU-SILC (the latest data year available at the time of writing), which includes income information from the previous year (2014); the 2014 EU-SILC for Germany (with income information from 2013) and the Family Resource Survey 2013/2014 which is a part of EU-SILC for the UK. We take the 2014 tax-benefit policies (reflecting the situation as of June 30th) as a starting point to ensure that the policy year matches the income reference year in the data.Footnote 2 In the case of Germany, market incomes and non-simulated tax-benefit instruments in the data are adjusted to 2014 levels using source-specific updating factors.
Our sample of interest consists of all earners aged 18-64 years in each country. We first look into the determinants of second earnership and in-work poverty by means of multivariate logistic regressions based on a pooled dataset for all countries with country fixed effects, where dummy variables control for the effect of unobserved factors that are shared within each country. We then analyse the effect of second earnership on in-work poverty by simulating transitions of second earners from work into unemployment and evaluating the change in in-work poverty and the extent to which it is moderated by the tax-transfer system. The latter approach is discussed in the next section.
3.3. Assessing the impact of second earners and tax-benefit policies on in-work poverty: a pre-post analysis
In order to assess the role of second earners in preventing in-work poverty we use a standard pre-post analysis. The method consists of creating a counterfactual scenario in which we simulate transitions from work (employment or self-employment) into unemployment for all second earners in our data, re-calculate their household disposable income under their new labour market status and assess how such a transition would affect in-work poverty.
The effect of transitions to unemployment in our analysis is simulated in the following way. First, disposable income and in-work poverty status are calculated before the transition to unemployment takes place (baseline scenario). Then, in the counterfactual scenario, we set individual earnings of all second earners in our data to zero, use EUROMOD to simulate all social benefits and taxes they would become entitled to, and re-calculate their household disposable income under unemployment.Footnote 3 Finally, in-work poverty status after the transition to unemployment is recalculated and compared to in-work poverty status in the baseline scenario.
This is a static analysis that does not take into account any behavioural changes. In particular, we assume that, following the entry to unemployment of an earner in the household, the labour market status of other household members remains unchanged (i.e. no behavioural labour supply responses). However, it is relevant for our research question and has a number of advantages from the methodological point of view. In contrast to the existing studies of the impact of public policies on in-work poverty that look at the role of institutional indicators at the macro-level (e.g. Lohmann, Reference Lohmann2009), the microsimulation approach enables us to obtain estimates that are representative for the whole population and to study the distribution of welfare provisions at the micro-level. Second, simulations of unemployment transitions across the whole population of second earners helps us avoid the problem of small samples and self-selection in survey data, where we observe second earners who have already become unemployed and their households have adjusted their behaviour to the new circumstances.
We use the following indicators to measure the effects of taxes and benefits in terms of stabilising incomes in unemployment (measure of the policy output) and reducing income poverty for working individuals (the outcome measure). The net replacement rate (a policy output indicator) is an individual-specific indicator defined as the ratio between household disposable income when the person is unemployed to household disposable income when the person is in work, assuming that the labour market status of other household members remains unchanged. Full take-up of benefits is assumed in the event of unemployment. In this sense, our indicator captures the intended effect of tax-benefit policies. The outcomes are captured by comparing the pre- and post-transition poverty status using a fixed (pre-transition) poverty line. Individuals are considered poor if their equivalised disposable income after the transition falls below a poverty line fixed at 60% of the median equivalised disposable income in the original population before the transition. These indicators are used to assess the impact of second earners on in-work poverty using a regression analysis.
4. Empirical results
4.1. Second earnership and in-work poverty in Europe: prevalence and characteristics
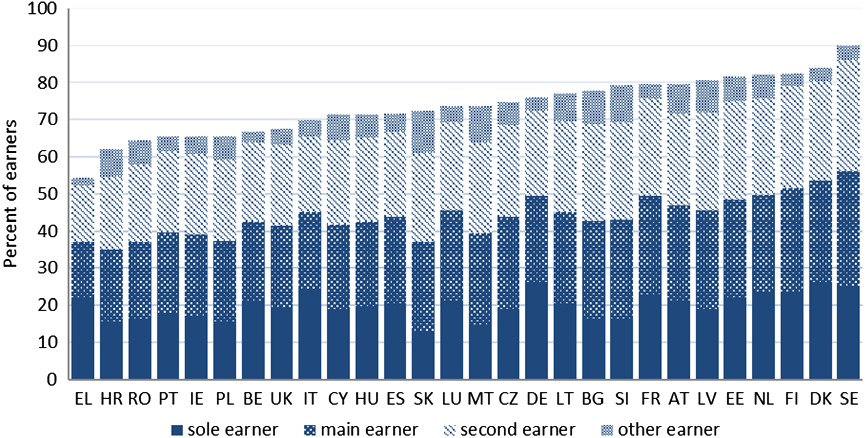
We start the discussion of the results by looking at the prevalence and characteristics of second earners in Europe. Figure 1 shows the breakdown of the total number of earners by earnership status in the household. The number of those who are in work among working age individuals varies a great deal (from 90% in Sweden to only 54.4% in Greece). The relevance of dual or multiple earnership in European countries is depicted by the fact that among all individuals who are in work the overwhelming majority lives in households with at least 2 earners (73% on average, ranging from 82% in Slovakia to 60.4% in Greece). Second earners constitute on average about a third of all earners in all countries, with little cross-country variation (their share ranges from 33.5% in Portugal to 28.3% in Greece).
Distribution of working individuals by earnership status, percent of working age individuals (18-64 years old)

On average in the EU and the UK second earners in multiple-earner households are predominantly women (64.1%), coupled with main earners (75.4%), earning significantly less than the main earners in their households (Figure A1, Supplemental Material). On average, the monthly earnings of second earners amount to 56.8% of earnings of the primary (main) earner, and this ranges from 46.5% in Germany to 70.4% in Romania.
The analysis of individual characteristics of second earners provides tentative explanations as to why their earning capacity is lower than that of the main earners. In most countries, second earners are more likely to have characteristics related to precarious employment as compared to main earners, i.e. they are more likely to be in low-skilled occupations (i.e. an occupational status below 3 on the International Standard Classification of Occupations (ISCO) scale; see ILO, 2012), low-paid (i.e. hourly earnings falling below two-thirds of median hourly earnings of full-time full-year workers in the country) and to work part-time (i.e. less than 30 hours per week) (Figure A2, Supplemental Material). In 14 out of 28 countries, second earners are more likely to be self-employed than main earners, with the gap of 5 p.p. and higher in Greece, Slovenia and Romania. Out of the above four employment characteristics, the highest gap between second and main earners is observed in terms of low pay and part-time employment.
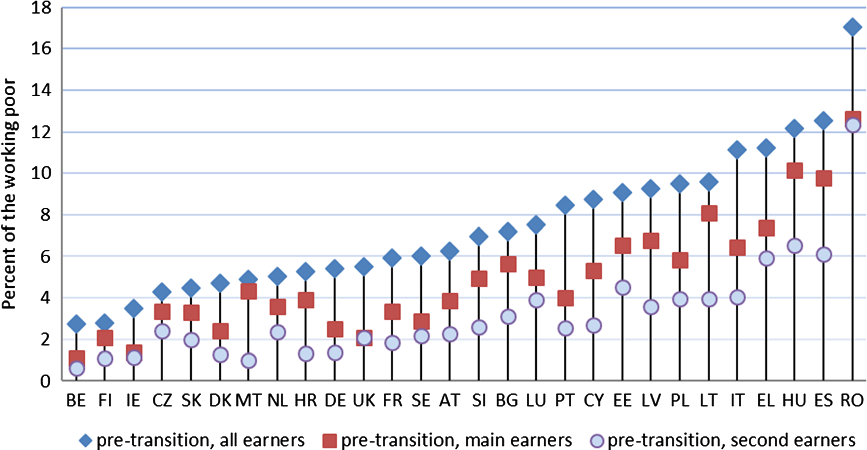
Figure 2 depicts the prevalence of in-work poverty in the EU and the UK. The results show a great deal of variation across countries, with in-work poverty rates ranging from less than 3% of the working population in Belgium and Finland up to a high of 17% in Romania. In general, it appears that all West European countries have lower rates of in-work poverty compared to Southern Europe. East European countries fall into two clusters. The first one comprises countries with low in-work poverty rates similar to those in Western Europe (Czechia, Slovakia, Croatia and Slovenia). The rest of East European countries form a cluster where in-work poverty rates are as high as in Southern Europe. In-work poverty rates of second earners in all countries are either lower than or equal to those of main earners, because the latter group includes sole earners. This confirms the results of previous studies of multiple earnership and in-work poverty in the EU (Eurofound, 2017; European_Commission, 2016; Horemans and Marx, Reference Horemans and Marx2013; Maitre et al., Reference Maitre, Nolan and Whelan2012).
In-work poverty rates for all earners, main and second earners, percent

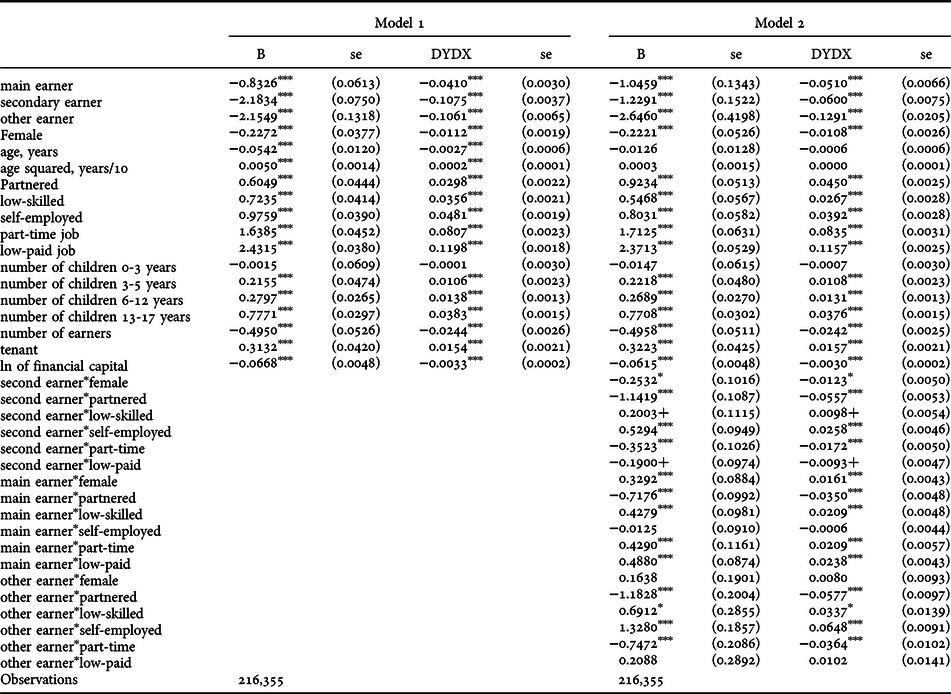
Next, we turn to the determinants of in-work poverty. Table 1 shows a logistic regression of in-work poverty status for all earners aged 18-64 years, on a pooled dataset of 28 countries with country fixed effects. To measure the effects of the earner’s status within the household, we have added a categorical predictor showing whether an individual is the main earner, second earner, other (third and subsequent) earner, with sole earners being the reference category. Following the literature, we included the following socio-demographic predictors: sex (female or not), age (in years), age squared, being partnered, the number of children aged 0-3 years, 3-5 years, 6-12 years and 13-17 years. Labour market-related characteristics used as predictors include: low skill level (i.e. an occupational status below 3 on ISCO scale), self-employment, part-time employment (i.e. working less than 30 hours per week) and low pay (i.e. hourly earnings falling below two-thirds of median hourly earnings of full-time full-year workers in the country). Additionally, to control for household economic resources, we have included characteristics such as the number of earners in the household, home ownership status (tenant or not) and financial capital (in a logarithmic form). The descriptive statistics for the variables used in the analysis are presented in Table A1, Supplemental Material. We have estimated two models: the baseline model with all the above-mentioned predictors (Model 1) and the model with the same predictors and interactions between the earner’s status (main earner, second earner or other earner) and their individual characteristics (Model 2).
Logistic regression of the probability of being working poor, pooled dataset for all countries with country fixed effects

Notes: Robust standard errors in parentheses; *** p<0.001, ** p<0.01, * p<0.05, + p<0.1; N: All earners aged 18-64 years with non-zero earnings
Model 1 shows that as far as the earner’s status in the household is concerned, compared to sole earners (the reference category), main earners in households with multiple earners have a 4.1% lower probability of being poor while working. Being a second or other earner in a household with multiple earners reduces the chances of being working poor by more than 10%. With regard to other individual-level characteristics we control for in this model, we see that women are slightly less likely to be poor while working compared to men, while partnered individuals are more prone to in-work poverty compared to non-partnered ones. The effect of age appears to have a U-form shape, i.e. the probability of in-work poverty first decreases with years of working experience and then increases for older workers. However, the relative impact of these demographic characteristics on the probability of in-work poverty is small (below 3%). As also predicted by previous research on in-work poverty, household-level characteristics matter for explaining in-work poverty. The poverty risk increases with the number and age of children and reduces with the number of workers in the household. Not owning a home (being a tenant) is positively associated with in-work poverty, while having higher financial capital is a poverty-reducing characteristic. Yet again the impact of these variables on the probability of in-work poverty appears to be much smaller than that of individual labour market characteristics. Part-time employment and low pay are particularly important. The former increases the probability of in-work poverty by 8%, the latter – by almost 12%. Being a low-skilled or a self-employed worker increases the probability of in-work poverty by 3.5 and 4.8%, respectively.
After adding interactions of all personal characteristicsFootnote 4 with earnership status (Model 2), we can see that the estimated impact on in-work poverty of being a woman, having a part-time job and even having a low paid job, is negative, or poverty-reducing for second earners, as opposed to the impact of these characteristics on main earners. Overall the impact of all personal employment characteristics on in-work poverty for individuals living in households with multiple earners is much smaller than for sole earners. In other words, our analysis shows that multiple earnership serves as an important poverty-preventing factor for individuals with precarious employment characteristics.
4.2. The impact of second earners on in-work poverty in Europe: a pre-post analysis
We now move on to our pre-post analysis. In order to quantify the impact of second earners on in-work poverty in Europe, we compare the situation before the transition (baseline scenario) and the situation after the transition of second earners into unemployment (counterfactual scenario).
Importantly, the pre-post analysis in combination with EUROMOD enables us to assess the impact of government policies aimed at preventing income losses due to unemployment at the individual level, which we measure with the indicator of net replacement rates (NRRs), or the ratio of the post-transition to pre-transition household disposable income. The size of NRRs is determined both by the generosity of tax-benefit systems towards the unemployed and their families (unemployment and other benefits that the family or the household might be eligible for) and by market incomes of other household members, particularly so for second earners. The decomposition of NRRs of main and second earners is shown in Figures A3 and A4, Supplemental Material.
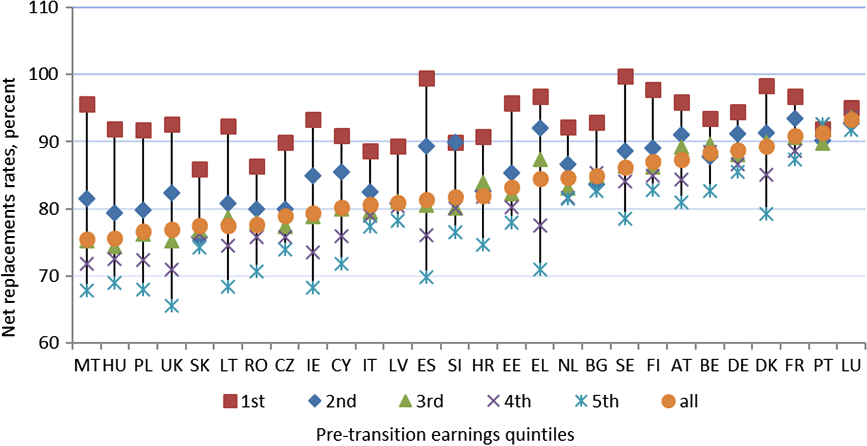
Figure 3 shows mean NRRs of second earners as a whole (orange circles), as well as mean NRRs of second earners by quintiles of the pre-transition individual earnings in each country. The countries are ordered by mean net replacement rates of all second earners in the sample. NRRs at the mean vary from 75.6% in Malta to 93.4% in Luxembourg, with the average at 83% across countries. NRRs are highest in Nordic and continental West European countries, where unemployment benefits play a particularly important role (see Figure A4, Supplemental Material). Anglo-Saxon and South-European countries present the highest within- country variation of NRRs of second earners, Portugal being the exception. NRRs are particularly high at the bottom of the distribution (the bottom earnings quintile) due to the small contribution of earnings from second earners to household disposable income, but they also depend on the generosity of the tax-benefit system (e.g. larger in Nordic countries). Second earners from the top quintile benefit from the highest (90% and over) net replacement rates in Portugal, Luxembourg and France.
Net replacement rates (NRRs) of second earners by pre-transition earnings quintiles, percent

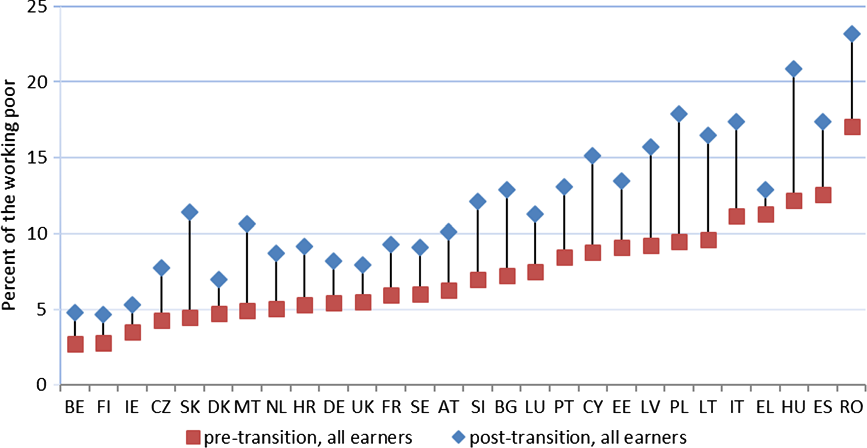
Figure 4 shows the extent to which in-work poverty would increase if all second earners were to become unemployed, given that their lost earnings would be partially replaced by unemployment benefits and other tax-benefit instruments they are eligible for.Footnote 5 Footnote 6 In all countries, in-work poverty would increase substantially (by 4.5 p.p.): however, the effect of this transition varies widely across countries. In Greece, Ireland and Finland, in-work poverty would increase by less than 2 p.p. following an entry of all second earners into unemployment. Hungary and Poland would experience the largest increase in in-work poverty of over 8 p.p.
Pre– and post-transition in-work poverty rates in the EU and the UK, percent

The reasons for the cross-country differences in the in-work poverty changes depend on a combination of factors, such as the pre-transition level of in-work poverty, the prevalence of second earners in the country, the level of earnings of second earners and their household members and the design of the tax-benefit system, i.e. the level of replacement of second earners’ income once they become unemployed (captured by NRRs). Figure A5 (Supplemental Material) plots the change in in-work poverty rates due to transition of second earners into unemployment against mean NRRs of second earners. As expected, these two indicators are negatively correlated; in countries where second earners have high NRRs, the change in in-work poverty is smaller and viceversa. Yet NRRs is not the only factor affecting the change in in-work poverty. In order to assess the relative contribution of various factors to in-work poverty rates we will need to apply a regression analysis.
Having analysed how the transition of second earners affects aggregate indices of in-work poverty, we turn to analyses of the pre- and post-transition in-work poverty status for main and other earners in households with multiple earners. Figure A8 of the Supplemental Material presents the distribution of their in-work poverty statuses before and after the transition. On average across countries, 4.4% of earners in multi-earner households would fall into poverty as a result of a transition of second earners to unemployment. The effect of the transition would be particularly high in countries such as Hungary, Poland and Slovakia, where over 7% of earners in multi-earner households would fall into poverty. The figure further highlights the prevalence of the group of earners for whom multiple earnership does not prevent in-work poverty (those who are poor before and after the transition). In general the size of this group is small (4% on average across countries), but not negligible in some countries (e.g. in Romania it amounts to 14.2%).
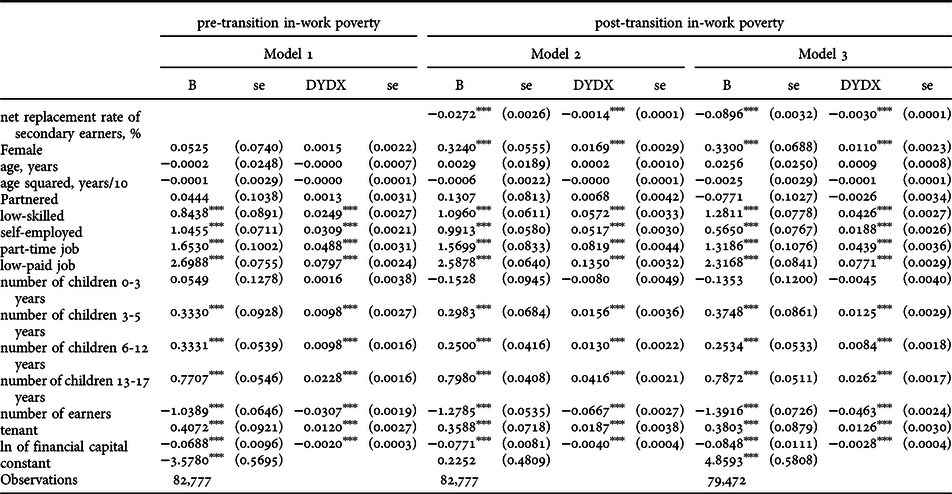
Table 2 shows the results of the regression analyses of the probability of pre- and post-transition in-work poverty for earners in multi-earner households, using the same set of predictors as in the models for all earners presented in Table 1. In addition, simulating the transition enables us to measure the moderating effect of the tax-benefit systems on in-work poverty. This is done by introducing NRRs of second earners as a predictor of post-transition in-work poverty of all other earners in their households (Model 2). In contrast to previous studies, we measure the effect of government policies at the individual level, which enables us to take into account the level and the distribution of government provisions across the whole population of workers. It should be noted that NRRs capture not only the generosity of the tax-benefit system towards the unemployed but are also influenced by the earnings (or more generally market income) of other household members. The regression analysis aims at controlling for these factors in order to assess the net impact of the tax-benefit system on in-work poverty. In Model 3 we have restricted the sample to individuals who were not poor before the transition of secondary earners into unemployment. The descriptive statistics for the variables used in these regression models are presented in Table A3, Supplemental Material.
Logistic regression of the probability of being a working poor before and after the transition of second earners to unemployment, pooled dataset for all countries with country fixed effects

Notes: Robust standard errors in parentheses *** p<0.001, ** p<0.01, * p<0.05, + p<0.1 N: Model 1 - main/other earners in households with 2+ earners before the transition; Model 2 - main/other earners in households with 2+ earners after the transition; Model 3 - main/other earners in households with 2+ earners after the transition that were not poor before the transition
Looking more closely at the covariates associated with post-transition poverty risk in Table 2 (Models 2 and 3) we can see that the direction of the effects of personal and household characteristics remains broadly the same as in the pre-transition model (Model 1). However, the size of the effects becomes significantly larger in post-transition Model 2. The exceptions are “age” and “partnership status” which are no longer statistically significant. Low pay and part-time employment continue to be the most important predictors, increasing the probability of in-work poverty by 13.5 and 8.2%, respectively. NRRs of secondary earners have a statistically significant poverty-reducing effect, but it appears to be small compared to the effects of individual employment characteristics, i.e. 10 p.p. increase in NRRs reduces the probability of poverty just by 1.4%.
In Model 3 we have removed all individuals from the sample who were already classified as the working poor before moving second earners into unemployment in order to target those who could become poor after the simulated transitions. The direction of the effects of personal and household characteristics is similar to Model 2 but with a reduction in their predictive power, which is expected, as these variables are more correlated with the status of being working poor in the baseline and those individuals are not part of the sample in Model 3. On the other hand, we observe an increase in the size of the effect of NRRs (a 10 p.p. increase in NRRs would result in a 3% reduction in the probability of in-work poverty, which is twice as high compared to Model 2). In other words, for those who were not working poor before the transition, the unemployment of second earners becomes the main driving factor of poverty, thus NRRs play a more important role.
5. Conclusion
In-work poverty rates are the result of complex interactions between individual- and household-level characteristics and institutional and labour market structures. Among these factors, dual earnership and the design of tax-benefits systems have been regarded as the most influential determinants of in-work poverty rates. This paper aimed to quantify the impact of second earnership on the risk of in-work poverty in Europe and the role of the tax-benefit systems in moderating this risk.
Our analysis provides a number of interesting findings. First, we confirm that the contribution of second earners to household income serves as an important factor to prevent in-work poverty. Under a counterfactual scenario, where all second earners become unemployed, the in-work poverty rate in the EU and the UK would go up from 7.4 to 11.9% of the working population, or by 60% in relative terms. Second, dual earnership appears to be a particularly important poverty-preventing factor for individuals with precarious employment characteristics (especially for part-time and low-paid workers), as the impact of all personal employment-related characteristics on in-work poverty for individuals living in households with 2+ earners is much smaller than for sole earners. Third, tax-benefit policies play a significant role in mitigating in-work poverty in the event of unemployment of second earners. Contrary to previous studies that have proxied the effect of tax-benefit policies by institutional macro-level indicators, we use individual-specific indicators of net replacement rates (i.e. the percentage of equivalised household disposable income that is replaced by government transfers, or by a reduction in taxes, in case of unemployment) and show that they have a negative and statistically significant effect on the probability of in-work poverty. The effect appears, however, small relative to the effects of individual labour market characteristics, such as low pay and part-time employment.
From a policy perspective, our results convey a number of relevant messages. Overall, although part-time or low-paid employment of second earners results in a higher poverty risk than standard full-time employment, the risk goes up dramatically in the case of non-employment of second earners (or to be more precise, in the case of sole earnership). This implies that a successful policy response to in-work poverty problems should primarily emphasise policy measures reducing difficulties for second earners (who are mostly women), to balance work and caring responsibilities, as well as redistributive policies supporting the work incentives of second earners (e.g. in-work benefit schemes that are means-tested on household incomes). Employment policies, on their own, cannot be deemed sufficient. Our analysis shows that in some countries in-work poverty is also prevalent among individuals living in multiple-earner households. These are households where workers are in low-paid and/or low-intensity jobs. More attention deserves to be paid to designing policies aimed at improving living standards for this particular group of workers. Finally, given the changing nature of the labour markets, where atypical forms of employment such as part-time, temporary jobs and self-employment have become more prevalent, the adequacy of tax-benefit systems to protect all types of workers in the event of different risks, such as unemployment, should be evaluated. The latter point seems particularly relevant in the context of the signing of the European Pillar of Social Rights in November 2017.
Further research could extend the analysis presented in this paper in several dimensions. First, for comparative purposes in this paper we opted for using the EU-level definition of in-work poverty. However, there seems to be a need for testing different definitions. For instance, it would be interesting to define in-work poverty purely at the individual level as suggested by Ponthieux (Reference Ponthieux2010). The latter would allow gender inequalities to be highlighted as these are largely erased with the conventional household-level approach to poverty risk. Second, we concentrated on the effect of second earners’ entry into unemployment. An alternative way to assess the effect of second earnership on in-work poverty is to focus on the impact of entries into employment of working-age individuals who are out of work. The effects of such an approach depend, however, on the assumptions about these individuals’ employment preferences, level of earnings and hours of work (among others) they would face when entering employment. Third, our analysis did not take into account potential adjustments in the behaviour of other household members after the entry of the second earner into unemployment. Structural labour supply models could be used to predict potential reactions of household members following unemployment shocks. Alternatively, one could also evaluate the amount of additional labour supply needed to compensate the loss of employment by second earners. Finally, our analysis has focused on cash programmes, omitting non-cash policies, which might play an important role in preventing in-work poverty. However, imputing information on non-cash policies in survey data across countries in a consistent way remains a challenging task. The above-mentioned issues were beyond the scope of this paper, which focused on providing a comprehensive quantitative cross-county assessment of how important second earners’ employment and government policies are in lifting individuals in work above the poverty line, which is relevant both in terms of employment activation policies and social protection programmes in Europe.
Acknowledgements
This research was supported by the NORFACE ERA-NET (New Opportunities for Research Funding Agency Co-operation in Europe Network) Welfare State Futures Program, Grant Number 462-14-010.
We are grateful to Holly Sutherland, Mike Brewer, the editor and two anonymous reviewers at Journal of Social Policy for their valuable comments. The results presented here are based on EUROMOD version H1.0. EUROMOD is maintained, developed and managed by the Institute for Social and Economic Research (ISER) at the University of Essex, in collaboration with national teams from the EU member states. We are indebted to the many people who have contributed to the development of EUROMOD. The process of extending and updating EUROMOD is financially supported by the European Union Programme for Employment and Social Innovation ‘Easi’ (2014-2020). The support of the Basic Research programme of Higher School of Economics is gratefully acknowledged by Daria Popova. The results and their interpretation are the authors’ responsibility.
Supplementary material
To view supplementary material for this article, please visit https://doi.org/10.1017/S0047279420000227