1. Introduction
Magmatic products from the crustal parts of ophiolite complexes can provide important information on the processes of melt generation during variable stages of lithosphere production, contribute to our understanding of the original tectonic setting for the formation of oceanic lithosphere, and help in understanding the processes of crustal accretion in variable tectonic systems. Geochemical studies of basaltic products from obducted slabs of old oceanic lithospheres are especially important in identifying the structure and magmatic evolution of oceanic crust formed in ancient spreading centres and in interpreting the geological history of regions which comprise various tectonic units of accreted terranes (e.g. accreted units of arc-basin systems: Shervais, Reference Shervais2001; Pearce, Reference Pearce, Dilek and Newcomb2003).
The geological characteristics of many of the ophiolite fragments across Turkey reflect the evolution of the Late Triassic to Late Cretaceous terranes of the eastern Mediterranean and have long been central to our understanding of the Neotethyan evolution in this region, as well as the Late Cretaceous tectonics of Anatolia (e.g. Şengör & Yılmaz, Reference Şengör and Yilmaz1981; Dilek et al. Reference Dilek, Thy, Hacker and Grundving1999; Robertson, Reference Robertson2002). It is commonly accepted that the northern part of the present Anatolian plate (Şengör & Yılmaz, Reference Şengör and Yilmaz1981) comprises a number of terranes (Göncüoğlu, Dirik & Kozlu, Reference Göncüoğlu, Dirik and Kozlu1997) or continental micro-plates that were amalgamated by the closure of the Tethyan oceanic realm mainly by northward-directed subduction events. The İzmir–Ankara suture zone is one of the major geological discontinuities in the region and extends over 1000 km. It represents the scar of the Tethyan oceanic realm between the Gondwanan Tauride–Anatolide microplate in the south and the Sakarya Composite Terrane (Göncüoğlu et al. Reference Göncüoğlu, Turhan, Senturk, Özcan, Uysal, Bozkurt, Winchester and Piper2000) of disputed origin in the north. This suture zone is marked, in some parts, by an intense high-pressure/low-temperature blueschist-facies metamorphism (Sherlock et al. Reference Sherlock, Kelley, Inger, Harris and Okay1999; Okay, Reference Okay2002) and contains a number of disrupted ophiolite fragments that are interpreted to represent remnants of the Tethyan oceanic lithosphere (Central Anatolia: Yalınız, Floyd & Göncüoğlu, 1996; Gürer & Aldanmaz, Reference Gürer and Aldanmaz2002; Central Sakarya: Göncüoğlu et al. Reference Göncüoğlu, Turhan, Senturk, Özcan, Uysal, Bozkurt, Winchester and Piper2000; NW Anatolia: Aldanmaz & Köprübaşı, Reference Aldanmaz and Köprübaşi2006). The fragments of this oceanic lithosphere were emplaced mostly southward onto the passive margin sequences of the Anatolite–Tauride platform as a result of the Mesozoic accretion of arc-related terranes (e.g. Göncüoğlu, Yalınız & Tekin, Reference Göncüoğlu, Yaliniz and Tekin2006a).
In this contribution we examine the mafic extrusive rocks from the Late Triassic to Late Cretaceous age oceanic fragments along the western part of the İzmir–Ankara suture zone, and present a new geochemical dataset for the lavas. The data provide a robust tool for investigating the petrogenetic and geodynamic evaluation of this segment of the İzmir–Ankara zone ophiolites, because the province contains accreted units of mafic volcanic rocks, the composition of which can be used to document variable stages of oceanic crust generation during different styles of plate motions, including the early plate divergence, later plate convergence and possibly the latest slab steepening and back-arc opening. We focus particularly on modelling and interpreting bulk-rock trace element data, with a special emphasis on providing insights into: (1) the characteristics of the mantle source of the mafic magma(s) in terms of chemical composition; (2) the primary controls on melt generation and crust production processes; and (3) the identification of possible tectonic setting(s) in which the oceanic lithosphere(s) were generated prior to emplacement.
2. Geological summary
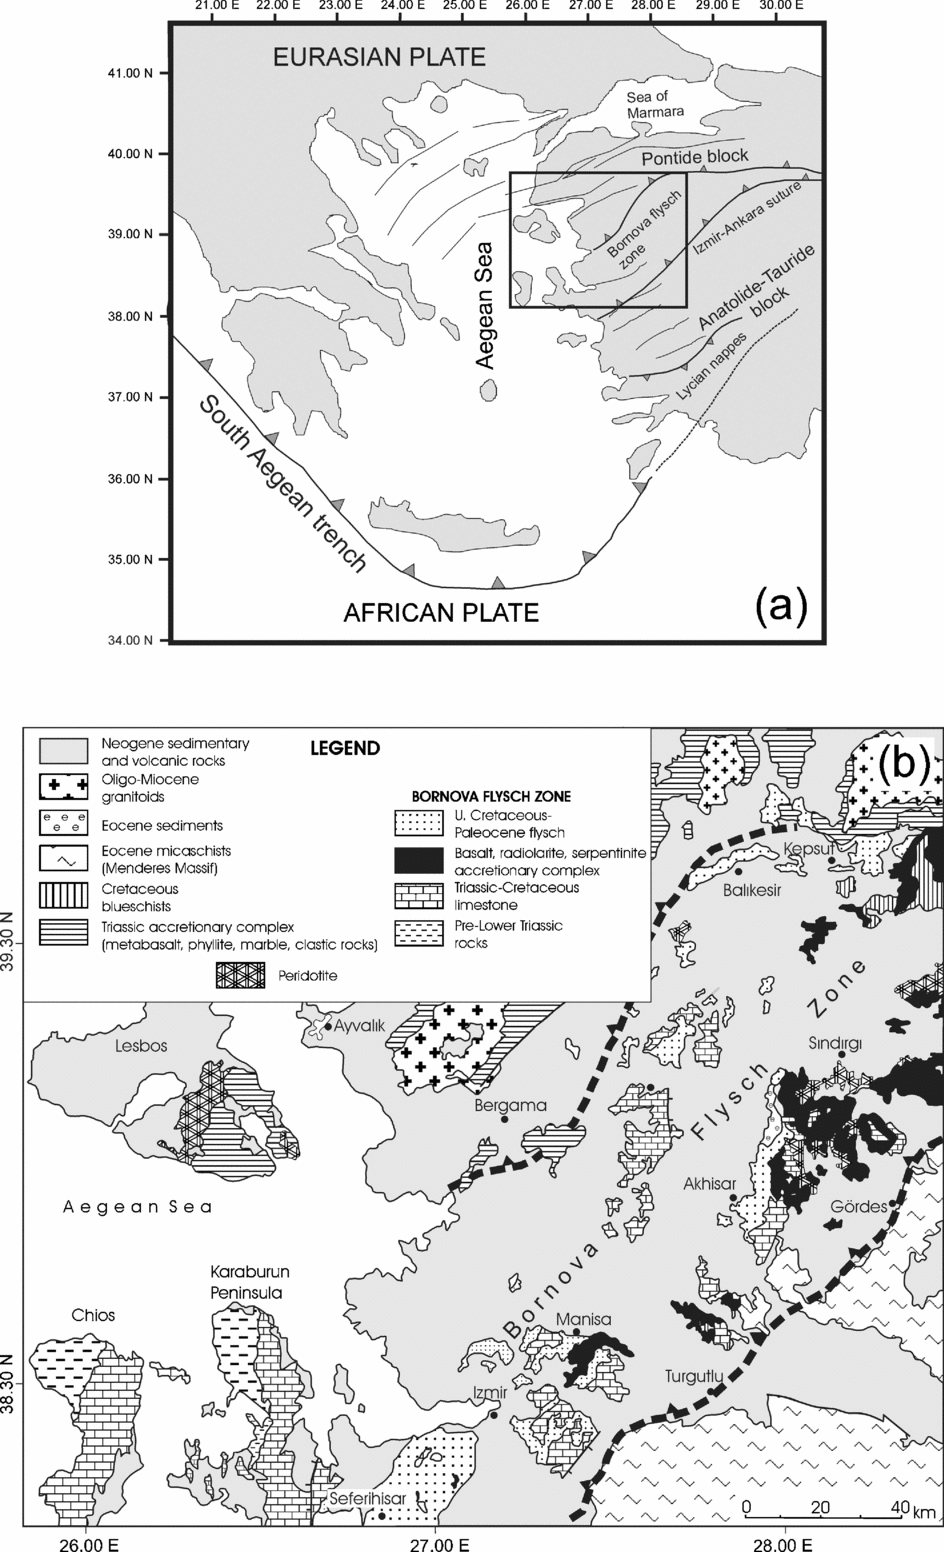
The Late Mesozoic to Early Cenozoic evolution of western Turkey is linked to the closure of the Tethyan ocean, and is largely characterized by plate subduction, ophiolite obduction, high-pressure/low-temperature metamorphism and collision of accreted continental blocks. The ophiolitic lavas within the western part of the İzmir–Ankara suture zone represent remnants of the crustal parts of an oceanic lithosphere, which is interpreted to have formed in an ocean basin, comprised a part of the Tethyan ocean floor (Şengör & Yılmaz, Reference Şengör and Yilmaz1981) and, subsequent to the Late Cretaceous (c. 90 Ma: Okay, Tansel & Tüysüz, Reference Okay, Tansel and Tüysüz2001; Önen, Reference Önen2003) intra-oceanic thrusting, north-dipping subduction and the later collision events, emplaced southward onto the passive margin volcano-sedimentary sequences of the Tauride–Anatolide platform (e.g. Göncüoğlu et al. Reference Göncüoğlu, Turhan, Senturk, Özcan, Uysal, Bozkurt, Winchester and Piper2000) (fig. 1a). The Mesozoic to Early Cenozoic history of the collision zone is recorded by sedimentary and volcanic rock associations that have been scraped off the Tethyan seafloor, disrupted and incorporated into the mélange associations to form an ophiolite–flysch range (known as the Bornova Flysch zone: Erdoğan, Reference Erdoğan1990), and then thrust over the northern edge of the Tauride–Anatolide platform along with ophiolite nappes during Late Cretaceous times.
(a) Regional tectonic map showing the major geological features of the Aegean section of the eastern Mediterranean. (b) Simplified geological map showing the distribution of main lithological units within the Tethyan suture zone in western Turkey (based on the data compiled from Erdoğan, Reference Erdoğan1990; Okay, Tansel & Tüysüz, 2001; Yalınız & Göncüoğlu, unpub. TÜBİTAK rep. no. 199Y100, 2005).

The Bornova Flysch Zone forms a NNE–SSW-trending belt 50 to 90 km in width and about 200 km in length and consists of chaotically deformed Upper Cretaceous to Lower Paleocene clastic rocks with Mesozoic (Middle Triassic to Cretaceous) neritic limestones, and Late Triassic (Tekin, Göncüoğlu & Turhan, Reference Tekin, Göncüoğlu and Turhan2002; Tekin et al. unpub. TUBITAK rep. no. 103Y027, 2006) to Late Cretaceous (Göncüoğlu, Yalınız & Tekin, Reference Göncüoğlu, Yaliniz and Tekin2006b) mafic lavas with cherts and pelagic shales as well as blocks of ultramafic rocks (Erdoğan, Reference Erdoğan1990; Yalınız & Göncüoğlu, unpub. TUBITAK rep. no. 199Y100, 2005). Flysch sediments contain a large amount of limestone blocks derived from a Mesozoic carbonate platform that represented the northwestern margin of the Tauride–Anatolide block. Throughout the suture zone are found isolated outcrops of dismembered ophiolite units containing ultramafic peridotites and/or mafic extrusive rocks (fig. 1b). The latter consist mainly of basaltic pillowed and massif lava flows.
The lavas from the sampling sites of this study within the Tethyan suture zone in western Turkey constitute three discrete petrological groups based on their bulk-rock geochemical characteristics: (1) mid-ocean ridge basalt (MORB)-type oceanic tholeiites; (2) ocean island basalt (OIB)-type mid-plate alkali basalts; and (3) supra-subduction zone (SSZ)-type tholeiites. In the southwestern part of the Bornova Flysch Zone, around the city of Manisa (fig. 1b), the dominant rock types are MORB tholeiites that are in close association with large amounts of OIB-type alkaline basaltic lavas. Radiolarian cherts associated with these basaltic lavas, being either inter-pillow sediments or local intercalations of pelagic or hemi-pelagic origin, have yielded similar age determinations for both types of lavas that range from the Middle Jurassic to Lower Cretaceous (Göncüoğlu, Yalınız & Tekin, Reference Göncüoğlu, Yaliniz and Tekin2006b). Similar ages of sedimentary covers and close associations of these rock groups suggest that both rock groups originated simultaneously in the same oceanic basin and are genetically related.
Further northeast within the Bornova Flysch Zone, to the northeast of Akhisar (fig. 1b), the tholeiitic lavas with SSZ geochemical affinities become the dominant rock types. In this part, the ophiolitic suite contains mafic lavas that range in composition from depleted MORB with a slight subduction signature to those with clear enrichment in subduction components. Both depleted and subduction-enriched lavas alternate with each other, suggesting that they are indistinguishable in their origin and were probably formed along the same spreading centre. Radiolarian cherts associated with these SSZ-type lavas have yielded ages between late Early Cretaceous and Late Cretaceous (Cenomanian) (Göncüoğlu, Yalınız & Tekin, Reference Göncüoğlu, Yaliniz and Tekin2006b). These ages are comparable to those obtained from SSZ-type ophiolitic lavas from other parts of the İzmir–Ankara suture zone (e.g. Göncüoğlu, Yalınız & Tekin, Reference Göncüoğlu, Yaliniz and Tekin2006a) and provide constraints on the formation age of SSZ-type oceanic lithosphere during the evolution of the Tethyan ocean in this part of the eastern Mediterranean.
3. Sample description
Oceanic tholeiites are the most abundant rock types within the suites and comprise both MORB- and SSZ-type tholeiitic rock associations. The two groups are petrographically indistinguishable regardless of their petrological type and age. They crop out as black to reddish-brown pillows and massive flows. The basalts are predominantly aphyric or microporphyritic with equigranular to intergranular groundmass consisting of plagioclase, clinopyroxene, titanium-rich magnetite and ilmenite. The average modal abundances of the constituting mineral phases are estimated to be 55% plagioclase, 35% clinopyroxene, 6% titanium-rich magnetite, 3–5% olivine, and 2–3% ilmenite. Secondary mineral replacements within the crystals are common along the margins of the grains or along the twin planes. A majority of the samples contain euhedral plagioclase with little or no alteration, but other samples show complete alteration or replacement of plagioclase by albite, Ca-zeolites and prehnite. Clinopyroxene is colourless, granular to sub-ophitic grains of augite. Alteration of pyroxenes is to chlorite, magnetite, epidote and actinolite. Olivine crystals can be identified in a few samples as relict pseudomorphs, partially replaced by chlorite and clay minerals. Oxide phases occur as granular crystals ranging in size from 0.005 to 0.1 mm, found in intergranular spaces between the plagioclase and pyroxene grains.
Alkali basalts are the second most common rock types within the lava suites. The common textures in alkali basalts vary between sub-ophitic, porphyritic and seriate with total phenocryst contents ranging from 10 to 20%. The lavas generally contain phenocrysts of plagioclase (about 50%), titanian augite (30%) and less olivine (15%) in a fine-grained groundmass containing granular olivine, plagioclase laths and intersertal glass. Other primary phases include ilmenite and titanium-rich magnetite. Some glassy rocks have phenocrysts of equant to elongate-skeletal olivine with included or attached oxide phases in a dark brown glass. Secondary phases include chloride, calcite, epidote and titanite.
4. Bulk-rock chemistry
4.a. Analytical data
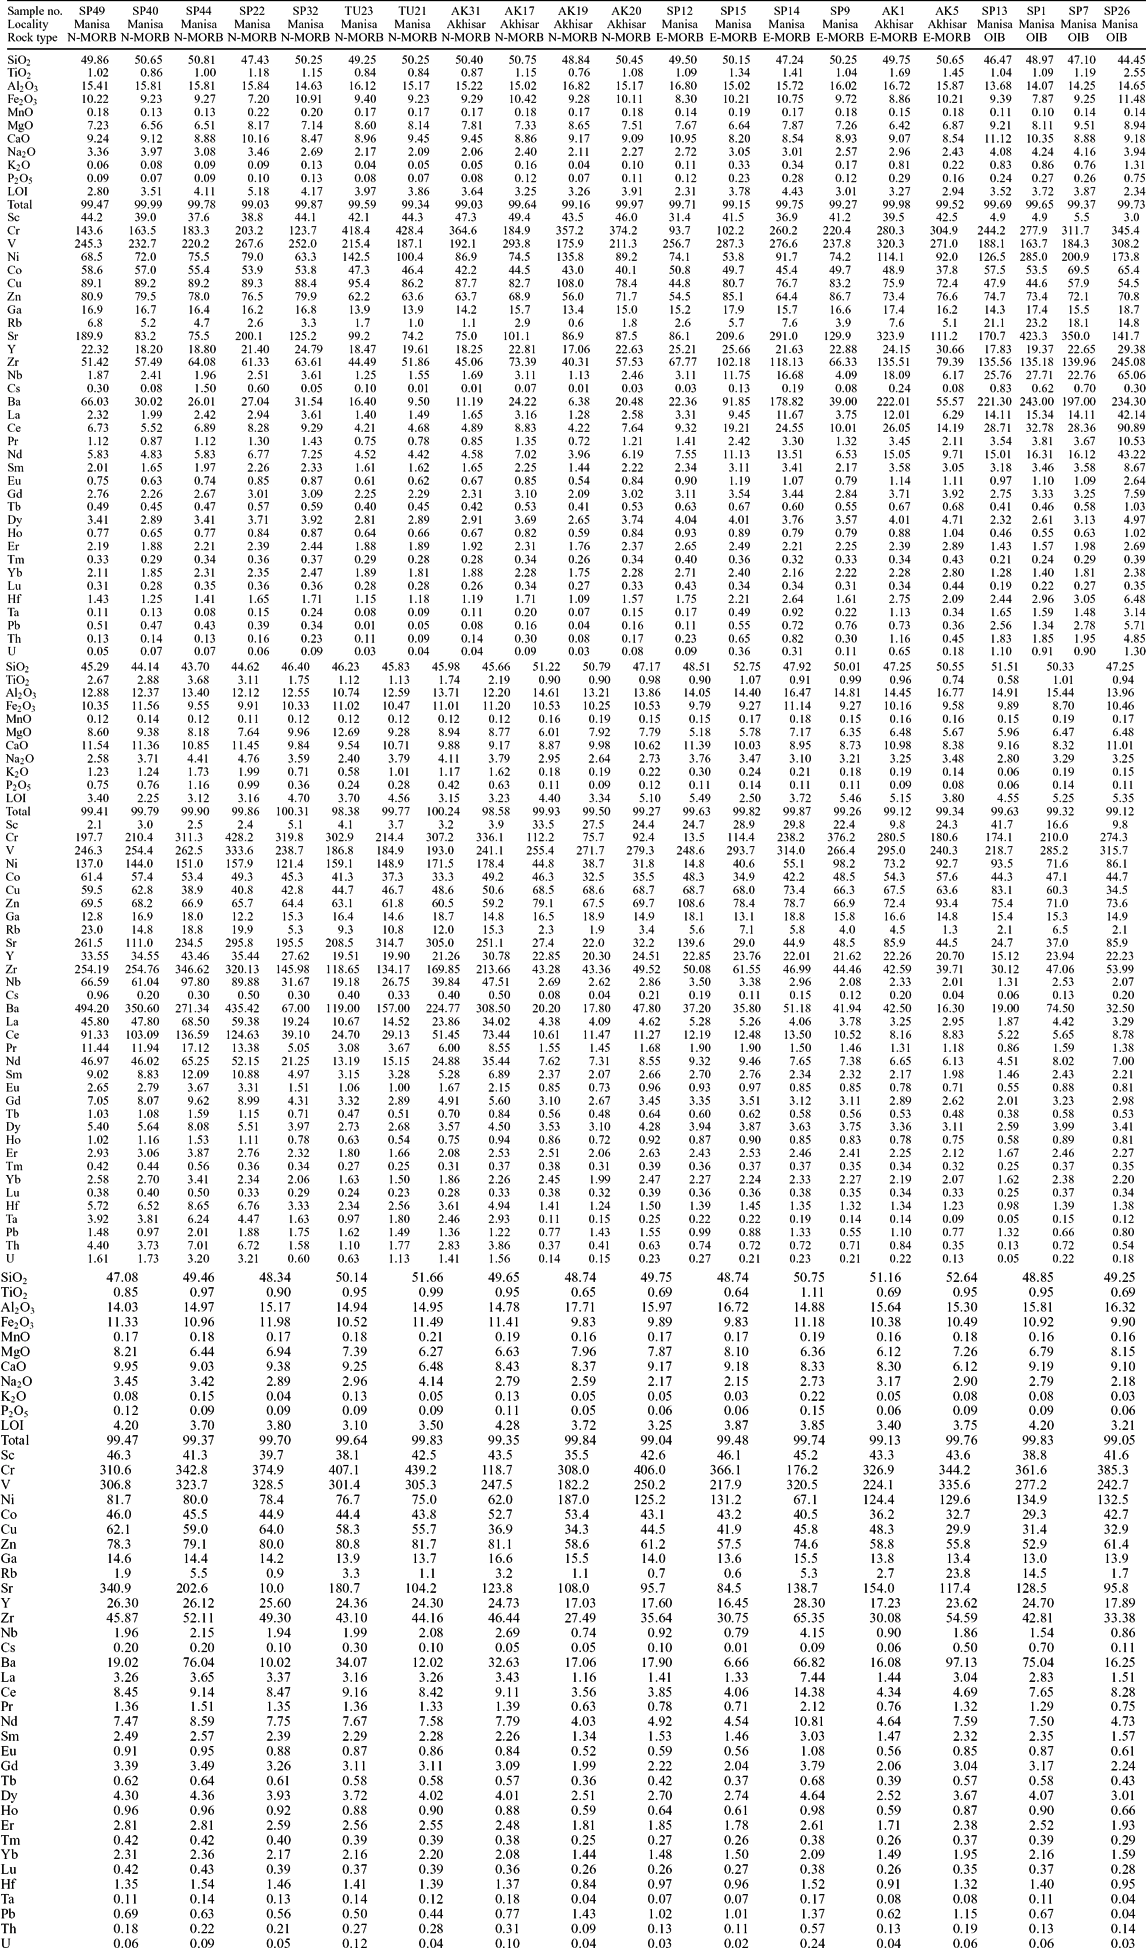
Only the best-preserved basaltic rock samples with no signs of alteration were chosen for geochemical analysis. External surfaces of rock samples were removed by splitting the samples into chips, which were then ground to a powder in a tungsten carbide ring grinder. Rock samples were analysed for their whole-rock major oxide and selected trace element concentrations (Rb, Sr, Zr, Y, Nb, Ba, Cr, V, Cu, Ni and Zn) using X-ray fluorescence (XRF) at the ALS Chemex Analytical Laboratories in Toronto, Canada. Major and trace element abundances were measured on fused discs and pressed pellets, respectively. Loss-on-ignition was determined by heating a separate aliquot of rock powder at 900°C. The samples were additionally analysed at the same laboratory for their REE and other trace element concentrations. Rock powders were first fused to ensure dissolution of all phases and then dissolved in hot HF and HNO3 to prepare the solutions from which trace element abundances were determined using inductively coupled plasma mass spectrometry (ICP-MS). The analytical uncertainties were estimated to be <1 (SiO2, TiO2, Fe2O3, MnO, CaO) to 4 (K2O) relative per cent for major elements, <5 (Sr, Zr, Y, Nb, Th, U, Hf, Ta) to 15 (Ni, Zn, Cr) relative per cent for minor and trace elements, and <4 to 10 relative per cent for REE. Whole-rock major and trace element data for the samples are presented in Table 1 as three separate units, namely the MORB, OIB and SSZ suites.
Whole-rock geochemical data for basaltic lavas from the ophiolite suites of western Turkey

4.b. Major and trace element variations
Although an attempt has been made to minimize the effect of alteration by screening the samples for primary volcanic features, such as pillow structures, and for absence of secondary mineralization, relatively high loss-on-ignition values (2.3–5.5 wt%) for most of the basaltic rocks imply a possible sea-floor alteration. Thus, we consider it unlikely that the measured mobile element abundances are pristine, and we based our modelling and interpretation largely on immobile HFSE, REE and Th.
The rocks as a whole can be classified as basalt with their silica concentrations ranging from 43.7 to 51.6 SiO2 wt%, although a few samples from the SSZ tholeiitic suite exhibit slight enrichment in SiO2 (52.7 wt%). The rocks from all three units show relatively wide ranges of Cr and Ni concentrations (Table 1), suggesting extensive fractional crystallization. Samples from the MORB suite contain intermediate TiO2 (0.76–1.69 wt%), whereas the SSZ-type tholeiites have relatively low TiO2 (<1.10 wt%). Samples with the OIB-type affinities are characterized by significantly higher TiO2 contents that range from 1.04 to 3.68 wt%. The rocks of this latter group are mostly silica-undersaturated (nepheline-normative) and possess higher MgO content than the rocks of the other two groups at a given silica content.
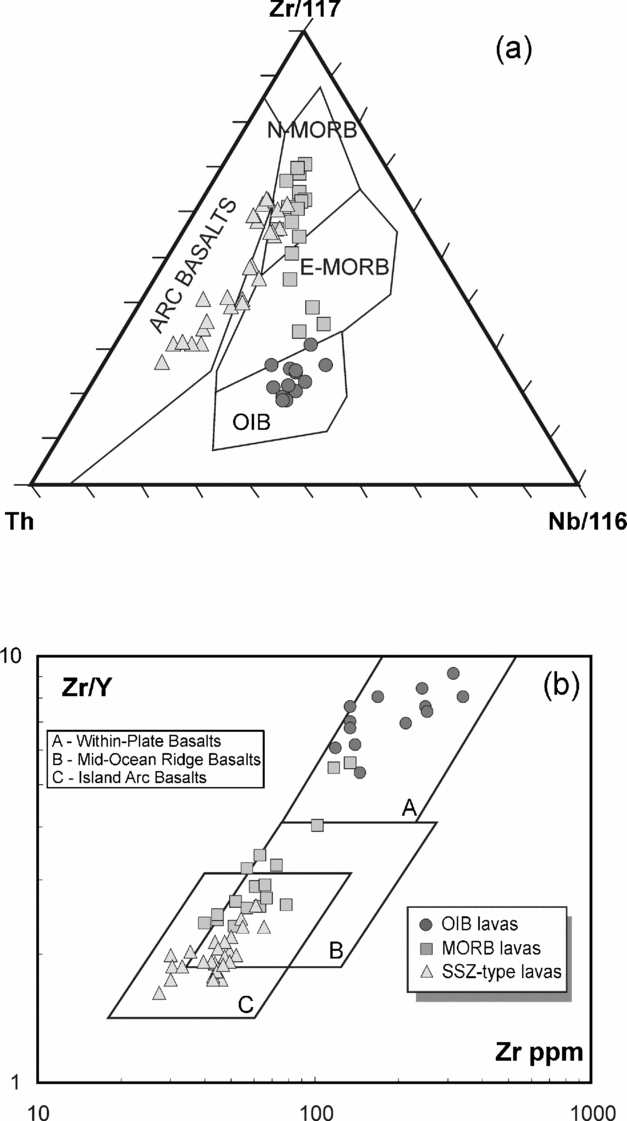
In a ternary element plot of Zr–Th–Nb, the samples classify as MORB and within-plate OIB, with some samples having relative enrichment in Th present in subduction-related basalts and hence plotting in the field of volcanic arc basalts (fig. 2a). The samples as a whole form two distinct trends defined by MORB–OIB and MORB–arc basalt compositions. The latter constitutes the SSZ-type lavas. In the Zr/Y v. Zr discrimination diagram, the samples also form a range of compositions in the fields of mid-ocean ridge basalt (MORB), within-plate basalt (WPB) and the island arc basalt (IAB) (fig. 2b).
The MORB suite shows a significant fractionation range, and has Zr and Nb contents from 40 to 135 ppm and 1 to 18 ppm, respectively. The majority of the MORB basalts have Ti/Zr (90–120) and La/Nb (0.80–1.28) values characteristic of N-MORB, but enriched-type MORB (E-MORB) compositions with greater incompatible to less incompatible element ratios also exist. The classification of the basalt types shown in Figure 2a and b is detailed below, with reference to average normal MORB- and CI chondrite-normalized trace element plots.
(a) Zr/117–Nb/16–Th diagram showing the basaltic lavas with respect to the fields for within-plate basalt (WPB), volcanic-arc basalt (VAB), normal (N) MORB and enriched (E) MORB (after Wood, Reference Wood1980). (b). Zr/Y v. Zr discriminant diagram for the basaltic lavas within the Tethyan suture zone in western Turkey. The fields of within-plate basalt (WPB), mid-ocean ridge basalt (MORB) and island arc basalt (IAB) are from Pearce & Norry (Reference Pearce and Norry1979).

4.c. Normalized multi-element and REE plots
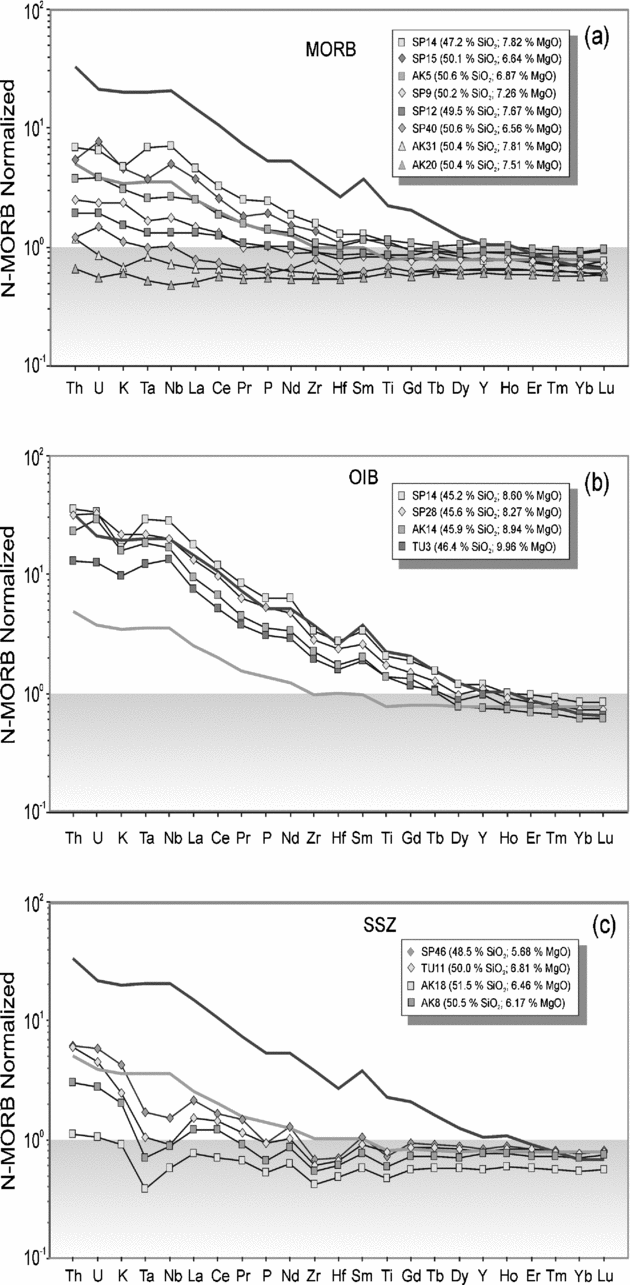
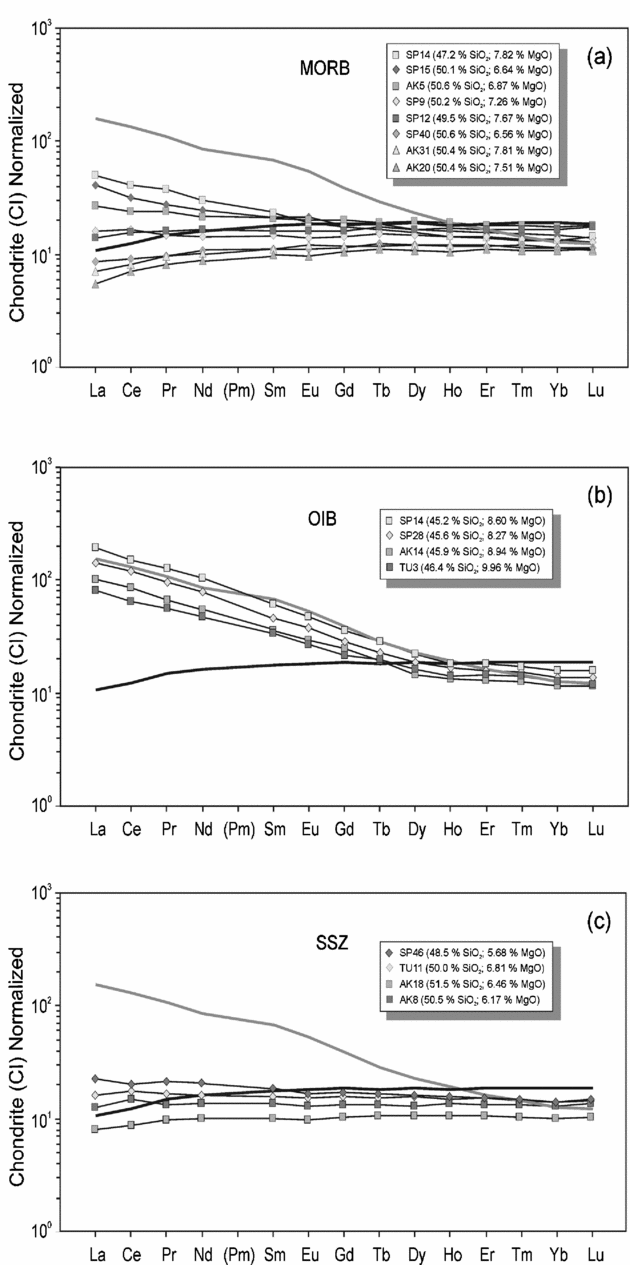
In Figure 3 the samples are plotted on multi-element variation diagrams normalized to the average MORB compositions of Sun & McDonough (Reference Sun, McDonough, Saunders and Norry1989). Also plotted for comparison are some typical oceanic basaltic compositions, including the enriched MORB and ocean island basalt (OIB) compositions of Sun & McDonough (Reference Sun, McDonough, Saunders and Norry1989). Corresponding chondrite-normalized REE plots are also presented in Figure 4.
N-MORB normalized multi-element patterns for the (a) MORB-, (b) OIB- and (c) SSZ-type basaltic lavas from the Tethyan suture zone in western Turkey. Average E-MORB and OIB compositions are shown by grey and dark heavy lines, respectively. E-MORB, OIB compositions and N-MORB normalizing values are from Sun & McDonough (Reference Sun, McDonough, Saunders and Norry1989).

The MORB lavas, with their variable enrichments and depletions in incompatible trace elements, exhibit a compositional range between N-MORB and E-MORB (fig. 3a). The N-MORB varieties display patterns close to the sub-horizontal patterns followed by average N-MORB composition of Sun & McDonough (Reference Sun, McDonough, Saunders and Norry1989). On a plot of chondrite (CI)-normalized REE, these rocks are characterized by LREE-depleted and rather steeper middle to heavy REE patterns. The rocks have fractionated LREE to MREE patterns ((La/Sm)N=0.55–0.97, where the subscript N denotes normalization to CI chondrite), which characterize basaltic lavas from oceanic spreading centres or marginal basins where basalt compositions can be modelled in terms of partial melting of melt-depleted mantle source with a possible involvement of slight proportions of enriched components (e.g. Niu et al. Reference Niu, Regelous, Wendt, Batiza and O'Hara2002; Leat et al. Reference Leat, Pearce, Barker, Millar, Barry and Larter2004). The E-MORB varieties, on the other hand, display a progressive enrichment in incompatible elements relative to N-MORB compositions, with a degree of enrichment that increases systematically with increasing incompatibility, resulting in smooth negative slopes in chondrite-normalized REE plots (fig. 4a). The ratios of (La/Sm)N for the E-MORB-type rocks range between 1.08 and 2.14 and are comparable to those observed in basalts from spreading centres in the proximity of relatively enriched mantle domains, such as in Iceland (Slater et al. Reference Slater, McKenzie, Gronvold and Shimizu2001) and some seamounts near the East Pacific Rise (Niu et al. Reference Niu, Regelous, Wendt, Batiza and O'Hara2002).
Chondrite-normalized REE element patterns for the (a) MORB-, (b) OIB- and (c) SSZ-type basaltic lavas from the Tethyan suture zone in western Turkey. Chondrite normalizing values are from Boynton (Reference Boynton and Henderson1984). Average N-MORB and OIB compositions are shown by dark and grey heavy lines respectively. N-MORB and OIB compositions are from Sun & McDonough (Reference Sun, McDonough, Saunders and Norry1989).

The alkaline basalts have Nb contents at least twice those of the MORB-like suite at a similar degree of fractionation, but have lower Zr/Nb values in a range between 3.54 and 6.19. Normal-MORB normalized element variation patterns for the alkaline rocks show significant enrichment in the more incompatible elements. The samples mostly fall between those of enriched ridge-generated MORB (e.g. E-MORB) and the average ocean island basalt (OIB), but the samples with greater enrichments in incompatible elements than the average OIB also exist. The rocks of this suite have all the classic enrichments in LILE, HFSE and L-MREE and slight depletion in HREE (e.g. relative to the average N-MORB) that characterize basalts from intra-plate oceanic settings (fig. 3b). The rocks, however, display slight negative anomalies in Zr, Hf and Ti with respect to the neighbouring incompatible elements in Figure 3b. In chondrite-normalized plots the alkaline rocks have almost straight and sub-parallel REE patterns with near-constant concentration ratios (fig. 4b). We interpret these basalts of intra-plate origin as having originated from a geochemically enriched (in terms of incompatible elements) component, possibly formed as seamounts on ocean crust.
The SSZ tholeiites show prominent depletions in high field strength elements relative to fluid-mobile elements (e.g. negative Ta and Nb anomalies with respect to the neighbouring incompatible elements) on a MORB-normalized plot (fig. 3c). These characteristics are common in arc environments and mostly ascribed to subduction enrichment and fluid metasomatism processes in subduction zones (e.g. Pearce et al. Reference Pearce, Baker, Harvey and Luff1995). The lavas, however, are slightly depleted in some HFSE and HREE and enriched in LREE with respect to N-MORB, which may be interpreted as reflecting generation of melt from a source that is depleted by previous melt extraction and subsequently enriched in subduction-mobile incompatible trace elements. The rocks have relatively enriched REE patterns with (La/Sm)N between 0.95 and 1.24 and (La/Yb)N between 0.92 and 1.63. Primary and slightly evolved lavas exhibit sub-parallel REE parents, suggesting that the latter have experienced shallow-level crystal fractionation of their plagioclase, pyroxene and olivine phenocrysts. Overall, the trace element characteristics of the lavas exhibit strong similarities to those formed in oceanic basins near convergent plate boundaries, where the influence of a marked subduction component signifies the geochemical characteristics of the source mantle (e.g. Taylor & Martinez, Reference Taylor and Martinez2003; Leat et al. Reference Leat, Pearce, Barker, Millar, Barry and Larter2004; Pearce et al. Reference Pearce, Stern, Bloomer and Fryer2005).
5. Evaluation of mantle sources and melting processes
5.a. Th/Yb v. Ta/Yb and Ta/Nd v. Th/Nb plots: evidence for multiple enrichment of the mantle source
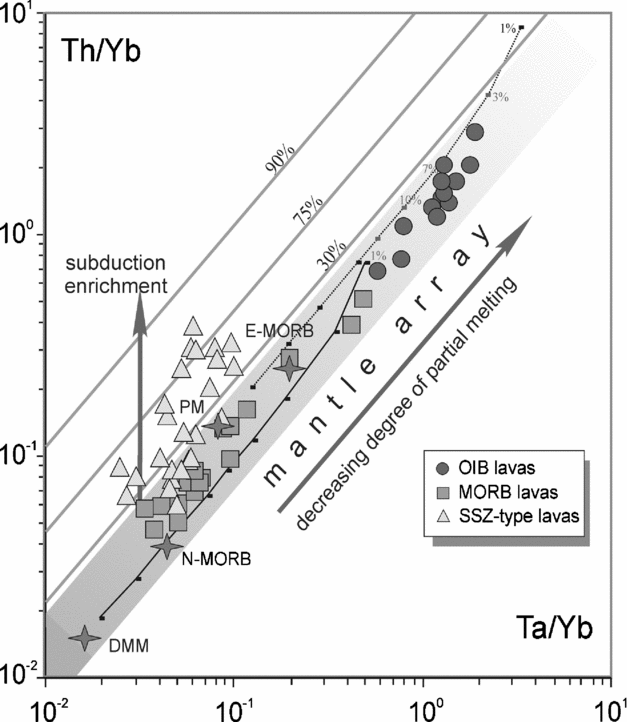
Ratios of incompatible elements with similar incompatibilities highlight mantle source variations and allow determination of the relative importance of melt extraction and mantle metasomatism in the geochemical characteristics of mantle-derived melts. An examination of incompatible trace element behaviour of the lavas has been performed to define the source variations of the lavas using the Th and Ta concentrations (Fig. 5). Ytterbium is used as a normalizing factor to minimize the effects of fractional crystallization and crystal accumulation (e.g. Pearce & Peate, Reference Pearce and Peate1995; Pearce et al. Reference Pearce, Stern, Bloomer and Fryer2005).
Plot of Th/Yb v. Ta/Yb for the MORB-, OIB- and SSZ-type basaltic lavas from the Tethyan suture zone in western Turkey. Also plotted for comparison are some typical oceanic basaltic and mantle compositions including the depleted MORB mantle, primitive mantle (PM), N-MORB and E-MORB. Partial melting trends predicted using the depleted MORB mantle and PM compositions as the source are shown as solid lines with the calculated degrees of melting on each curve (shown as thick marks). Contours parallel to the mantle array denote the percentage of subduction-derived element Th in the mantle source, assuming that Ta is subduction-immobile (e.g. Pearce et al. Reference Pearce, Stern, Bloomer and Fryer2005).

A projection of Th/Yb versus Ta/Yb (Fig. 5) defines three different rock assemblages with reference to the classification made in Figure 2. Among these, the rocks with MORB geochemical signatures contain both N-MORB and E-MORB compositions. Thorium and Ta have similar distribution coefficients for melting and fractional crystallization, so that MORB forms a diagonal array on the projection in Figure 5 with a slope close to unity. Extremely large variations in both Th/Yb and Ta/Yb ratios for the MORB suite suggest that these subduction-unmodified lavas can be interpreted to have originated from mixing of melts from sub-lithospheric sources with variable, but systematic, enrichments in incompatible trace elements, and are likely to define the local MORB array of increasing Th/Yb with increasing Ta/Yb. Higher values in both Th/Yb and Ta/Yb ratios for some samples (E-MORB in particular) may be explained by the involvement of an incompatible element enriched component in their source mantle.
The OIB-type alkaline rocks are characterized by strong enrichments in highly incompatible elements relative to less incompatible elements (e.g. higher LREE/HREE ratios than that of MORB). They plot on the MORB–OIB mantle trend on a Th/Yb v. Ta/Yb diagram, indicating that their mantle source had no subduction influence and the resulting magmas were not affected by any significant contamination of lithospheric material. Higher ratios of both Ta/Yb and Th/Yb relative to MORB compositions, however, may be explained by a number of processes including magma generation by: (1) small degrees of melting of a convectively homogenized source that is enriched in incompatible elements relative to depleted MORB source; or (2) small degrees of partial melting of a mantle source that leaves garnet-bearing residue (e.g. Aldanmaz et al. Reference Aldanmaz, Pearce, Thirlwall and Mitchell2000); or (3) systematic mixing between increments of melt derived from a compositionally uniform source by variable degrees of melting (e.g. Aldanmaz, Gourgaud & Kaymakci, Reference Aldanmaz, Gourgaud and Kaymakci2005; Aldanmaz et al. Reference Aldanmaz, Köprübaşi, Gürer, Kaymakci and Gourgaud2006).
The SSZ tholeiite lavas exhibit clear displacements from the MORB–OIB array to higher subduction-mobile element Th. It is known that Ta/Yb ratios are not affected, or little affected, by additions of components during plate subduction, whereas an increase in Th/Yb, due to the introduction of additional Th into the source, reflects additions of slab-derived components (Pearce et al. Reference Pearce, Baker, Harvey and Luff1995). These components are widely thought to be crust-derived aqueous fluids and sediment-derived siliceous fluid, that is, supercritical fluid or melt (Pearce et al. Reference Pearce, Baker, Harvey and Luff1995; Hawkesworth et al. Reference Hawkesworth, Turner, McDermott, Peate and van Calsteren1997). The addition of a subduction component to a constant mantle source would be expected to give a vertical trend on the diagram, as only Th is added while Ta and Yb remain nearly constant. However, the SSZ tholeiites from the ophiolitic suites of western Turkey form a trend that diverges sub-vertically from the MORB array, indicating that variable contribution from a subduction-enriched component has strongly influenced the mantle source chemistry.
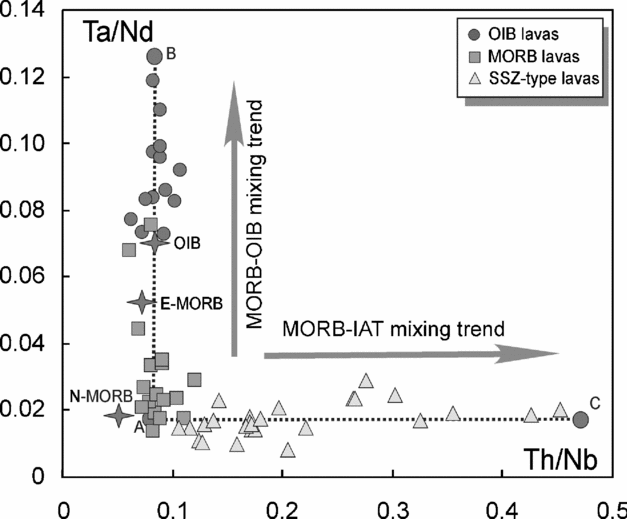
The compositional effects of the slab-derived components and enriched versus depleted mantle sources on the oceanic basalts can also be investigated using the plot of Ta/Nd versus Th/Nb (Fig. 6). Two distinct trends in the diagram diverge strongly from N-MORB compositions. One of these trends is defined by MORB–OIB compositions and characterized by increasing Ta/Nd ratios at near constant Th/Nb. This trend could be the result of mixing between melts from MORB- and OIB-type sources, or alternatively, variable degrees of partial melting of a source similar in composition to the depleted MORB mantle. The second trend, on the other hand, displays increases in Th/Nb ratios with no significant change in Ta/Nd. This horizontal trend, which is defined by the compositions of SSZ tholeiite lavas, can be interpreted to represent MORB-subduction component mixing, or addition of subduction component to the depleted MORB mantle source prior to mantle melting to produce oceanic crust with composition resembling typical back-arc basin lavas.
Variation of Ta/Nd with Th/Nb for the MORB-, OIB- and SSZ-type basaltic lavas from the Tethyan suture zone in western Turkey. The predicted mixing trend between MORB and OIB compositions defines the vertical trend comprising the compositional variations of the MORB- and OIB-type lavas from western Turkey, while the model prediction constituting the subduction influx into the depleted MORB mantle can account for the compositions of the lavas with SSZ geochemical signatures. End-member components shown in the figure are defined by 17% melting of a depleted mantle source (A), 4% melting of an enriched mantle source (B) and 20% melting of a subduction-enriched mantle source (C).

5.b. La/Yb v. Zr/Nb and La/Sm v. La plots: modelling source characteristics of the MORB- and OIB-type lavas
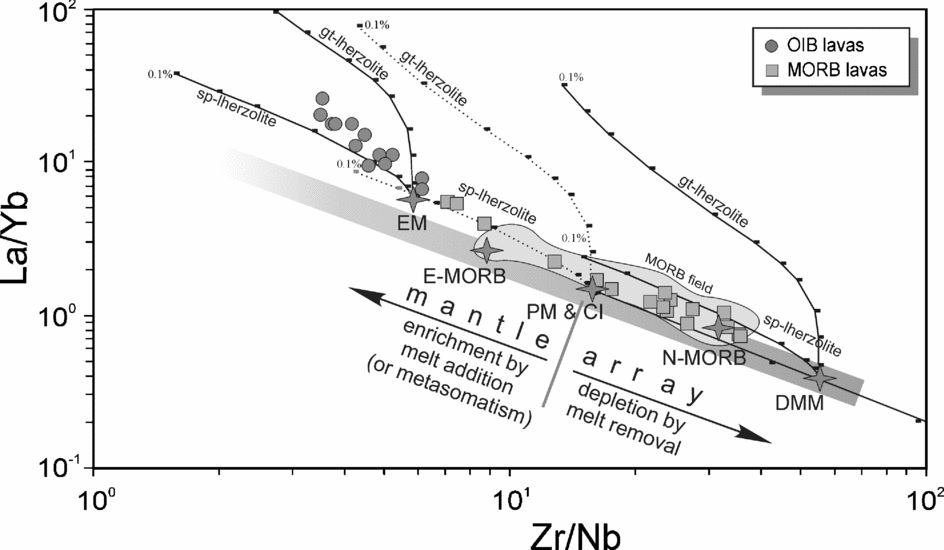
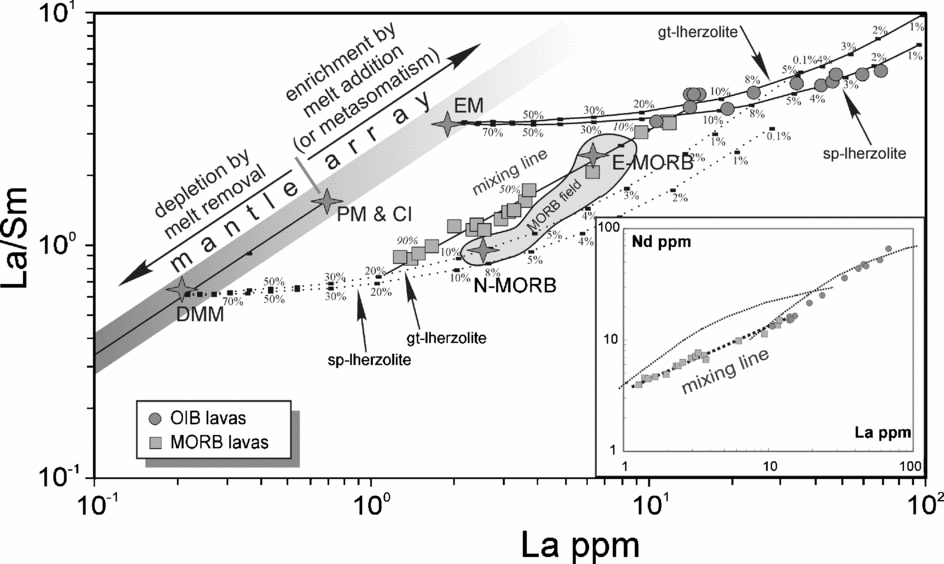
In Figures 7 and 8 we attempted to model numerically the REE and Zr and Nb abundances and ratios in an effort to constrain the source variations in the genesis of subduction-unmodified (e.g. MORB- and OIB-type) lavas from the ophiolitic suites of western Turkey. Ratios of highly incompatible trace elements such as La/Sm or Zr/Nb in tholeiitic and alkali basalts provide constraints on their source chemistry and degree of melting because these ratios are unlikely to be strongly fractionated by mineral separation (Aldanmaz, Reference Aldanmaz2002). Therefore, the variation in such ratios in basalts from oceanic basins can be used to document the range of source compositional variations present beneath oceanic spreading systems or seamounts.
Plot of La/Yb v. Zr/Nb showing melt curves (or lines) obtained using the non-modal batch melting model (see Aldanmaz et al. Reference Aldanmaz, Pearce, Thirlwall and Mitchell2000 and Aldanmaz, Reference Aldanmaz2002 for details). The parameters and common geochemical reservoirs used in the diagram are as described in Aldanmaz et al. (Reference Aldanmaz, Pearce, Thirlwall and Mitchell2000). The enriched mantle (EM) is assumed to have incompatible element concentrations similar to that proposed in Aldanmaz et al. (Reference Aldanmaz, Köprübaşi, Gürer, Kaymakci and Gourgaud2006). The mantle array is defined using melt-residual compositional trends from depleted MORB mantle (DMM) and primitive mantle (PM; similar in composition to CI chondrite) compositions. Mantle depletion and enrichment trends are defined by melt extraction from the mantle (towards the residues) and melt addition to the mantle (or influx of material from outside the mantle prior to solid-state mixing and homogenization) respectively. The melting trends from depleted MORB mantle and enriched mantle compositions are shown by solid curves (or lines) while the dashed curves (or lines) represent the melting trends from primitive mantle. Thick marks on each curve (or line) correspond to degrees of partial melting for a given mantle source. MORB field defines the compositional range of basalts from the East Pacific Rise (Niu et al. Reference Niu, Bidaeu, Hèkinian and Batiza2001).

Plot La v. La/Sm showing melt curves (or lines) obtained using the parameters described in the caption of Figure 7. The straight line array represents a mixing line between melts from enriched (e.g. enriched mantle, EM) and depleted (e.g. depleted MORB mantle) components. The numbers in italic denote the mixing proportion of the depleted component in the final melt produced. The inset diagram compares the variations of highly versus moderately incompatible elements (La v. Nd) for the MORB- and OIB-type lavas from the ophiolitic suites of western Turkey with model partial melting curves (or lines) for both depleted and enriched mantle components obtained assuming the non-modal batch melting model. Continuous partial melting of any single source predicts curved trends for moderately versus highly incompatible elements. In contrast, highly and moderately incompatible trace elements from the MORB and OIB lavas from western Turkey generally exhibit individual quasi-linear trends suggesting a mixing between melts derived from sources with different compositions. Descriptions of geochemical reservoirs are as given in Figure 7.

Using the approach by Aldanmaz (Reference Aldanmaz2002) and Aldanmaz et al. (Reference Aldanmaz, Köprübaşi, Gürer, Kaymakci and Gourgaud2006), it is shown by plots of La/Sm v. La and La/Yb v. Zr/Nb that MORB and OIB types of basalts are unlikely to have originated from the same source, if melt production is considered in the conventional context of single-stage melting and instantaneous melt extraction (Figs 7, 8). The modelling shows that although some of the N-MORB compositions from the ophiolitic suites of western Turkey can be generated by 10–15% melting of a source similar to depleted MORB mantle, the majority of the rocks display compositional trends that are different from the model liquid compositions (or melt extraction trajectories) produced using depleted MORB mantle as the source composition. In particular, most of the E-MORB and the OIB compositions have highly incompatible to less incompatible element ratios (e.g. La/Sm and Nb/Zr) greater than those that could be generated by a single-stage melting of depleted MORB mantle, even when the degree of partial melting is taken to be unrealistically small (e.g. 0.01%).
Figure 8 further illustrates that the MORB lavas define a linear trend on a La/Sm v. La diagram with a depleted end-member representing N-MORB composition formed by about 15% melting of depleted MORB mantle and an enriched end-member representing the most enriched E-MORB formed by melting of a mantle component enriched in incompatible elements. The lavas representing the entire spectrum of the MORB suite can therefore be interpreted as resulting from mixing between an enriched (defined by some of the enriched E-MORB and the entire spectrum of OIB-type lavas) and a depleted (defined by the N-MORB lavas) component. Because the concentrations of incompatible trace elements in the two sources are remarkably different, only 1–2% of enriched component is needed to overwhelm the trace element characteristics of the lavas resembling typical N-MORB, while the compositions of the most enriched E-MORB- and OIB-type lavas can be explained by melting of the enriched component with slight or no contribution from the depleted component.
Model predictions show that the majority of the N-MORB and E-MORB compositions can be produced by systematic mixing of melts produced by variable degrees of partial melting of these two compositionally distinct sources. In this context, ‘melting-induced mixing’ of at least two-component mantle can be considered a viable mechanism to produce the compositional spectrum observed in these subduction-unmodified ophiolitic lavas. The process envisioned resembles that proposed to explain mantle melting and melt extraction in many extensional settings including oceanic spreading systems, back-arc environments and continental break-up settings (Cousens et al. Reference Cousens, Allan, Leybourne and Chase1995; Niu et al. Reference Niu, Regelous, Wendt, Batiza and O'Hara2002; Meibom & Anderson, Reference Meibom and Anderson2003; Pearce, Reference Pearce2005; Korenaga, Reference Korenaga2004).
6. Petrogenetic considerations
6.a. Heterogeneous MORB–OIB source and multi-component mantle melting
It is a common notion that MORB lavas are remarkable for their tremendous chemical homogeneity (e.g. Dupre et al. Reference Dupre, Lambert, Rousseau and Allègre1981; Hofmann, Reference Hofmann1997). Almost all MORB are olivine-normative tholeiites with a significantly restricted range in major and trace element compositions, motivating many workers to treat the MORB source as a large-scale homogeneous reservoir. However, numerous studies from presently active oceanic spreading systems have demonstrated that the chemical variability of ocean floor basalts dramatically increases for samples not erupted at established ridge axes, and significant chemical variations in oceanic basalts occur in relatively short time- and length-scales (e.g. Cousens et al. Reference Cousens, Allan, Leybourne and Chase1995; Niu, Collerson & Batiza, Reference Niu, Collerson and Batiza1999; Lundstrom et al. Reference Lundstrom, Sampson, Perfit, Gill and Williams1999; Donnelly et al. Reference Donnelly, Goldstein, Langmuir and Spigelman2004; Graham et al. Reference Graham, Blichert-Toft, Russo, Rubin and Albarède2006).
The observed trace element compositional diversity between the sources of N-MORB- and E-MORB- (and OIB)-type magmas is, in general, evident by relative enrichment of E-MORB- and OIB-type sources in more incompatible over less incompatible elements. This clear chemical distinction is essentially the common characteristic of the vast majority of OIB and E-MORB suites and could best be explained by the upper mantle compositional heterogeneities and the existence of enriched components. This would allow the chemical composition of enriched magmas to be explained in terms of involvement of two or more chemically distinct end-members, which requires that the mantle comprises a mixture of enriched and depleted components (e.g. Schilling, Reference Schilling1973; Allègre & Turcotte, Reference Allègre and Turcotte1986; Sleep, Reference Sleep1984; Cousens et al. Reference Cousens, Allan, Leybourne and Chase1995; Meibom & Anderson, 2004; Ito, Lin & Graham, Reference Ito, Lin and Graham2003; Pearce, Reference Pearce2005; Debaille et al. Reference Debaille, Blichert-Toft, Agranier, Doucelance, Schiano and Albarède2006).
The trace element modelling presented above shows that the melt compositions forming the temporally associated, subduction-unmodified basaltic lavas from the ophiolitic suites of western Turkey display geochemical trends that change from N-MORB through E-MORB to OIB-type magmas. In particular, the MORB suite exhibits a compositional trend that ranges from LREE-depleted to extremely LREE-enriched varieties. The variations in incompatible element concentrations and ratios among different types of MORB (and OIB) compositions are too large to be explained by either fractional crystallization from a single parental melt or melting of a single, chemically uniform mantle source. Moreover, E-MORB lavas are broadly similar in major element composition to N-MORB, with some subtle differences. This may indicate that E-MORB and N-MORB may result from similar degrees of melting, meaning that higher incompatible element concentrations and different trace element ratios in E-MORB are likely inherited from their source.
The model liquid compositions produced using concentrations and ratios of highly incompatible and less incompatible trace elements (e.g. La/Sm v. La, and La v. Nd) are expected to form curvilinear trends (Fig. 8). This is consistent with the theoretical assessment of mantle melting, which requires the rate of depletion of the highly incompatible element with progressive melting to be significantly higher than that of the less incompatible element. The MORB- and OIB-type ophiolitic lavas from western Turkey, however, are represented by two distinct straight line arrays rather than curvilinear trends, suggesting that magma generation by continuous melting from a single mantle source is difficult to reconcile with the incompatible trace element relationships of these lavas.
The simplest explanation for the correlations shown in Figure 8 is mixing of melts from a heterogeneous source region. Such correlations between highly incompatible trace element abundances (or ratios) indicate that N-MORB, E-MORB and OIB compositions are intimately linked in the melting process and that at least two distinct mantle sources, one similar to the depleted MORB mantle and the other more enriched than the depleted MORB mantle, must participate in generating the basalts with MORB and OIB compositions.
The concentration relations within the MORB and OIB suites suggest that typical E-MORB reflects a mix of 75% OIB and 25% N-MORB. The overall higher ratios of the highly to less incompatible elements of the samples probably reflect a greater contribution from the OIB-like end-member, or sometimes even OIB formation, which can be explained by diminished amounts of melt derivation from the depleted source, probably due to the integrated effects of conductive cooling and insufficient pressure release away from the ridge axis. The relatively homogeneous chemical composition of N-MORB, however, may simply reflect mixing that occurs because of magma focusing and passage through axial melting regions in spreading centres, which result from efficient homogenization of melts at the ridge axis where melt generation is dominated by a relatively large extent of melting (about 15%) of a depleted component. It is therefore reasonable to expect N-MORB (depleted) formation at the ridge axis and E-MORB or even OIB-type compositions (enriched) away from the axis (e.g. off-axis sea mounts).
6.b. Origin of subduction component in producing SSZ-type tholeiites in an oceanic basin
A distinctive geochemical feature of many back-arc magmas is the depletion in HFSE, enrichment in LILE, and common enrichment in LREE relative to N-MORB compositions. Since both HFSE and LILE behave incompatibly during partial melting of mantle rocks, this characteristic is difficult to reconcile with a single-stage melting and melt extraction from a source with geochemical characteristics similar to that of the ambient MORB mantle. Thus, it is commonly suggested that more than a one-stage melting process is required to explain geochemical characteristics of back-arc basin basalts (e.g. McCulloch & Gamble, Reference McCulloch and Gamble1991; Woodhead, Eggins & Gamble, Reference Woodhead, Eggins and Gamble1993; Pearce et al. Reference Pearce, Stern, Bloomer and Fryer2005). The commonly used model predictions suggest that the initial stage of melt extraction depletes the source in all incompatible trace elements (e.g. LILE and HFSE), leaving a depleted and refractory mantle residue. A subsequent melting occurs after, or during, a hydrous LILE (and LREE)-enriched but HFSE-depleted component, most probably a subduction component, is added to the source mantle.
The existence of SSZ-type tholeiites with geochemical signatures indicative of pre-melting subduction influence provides evidence for the development of arc-like crust by the inferred second-stage melt generation. In particular, geochemical data from some of the basaltic rocks from the ophiolitic units of western Turkey require generation from a relatively refractory source (depleted in HFSE and REE), most likely residual from previous melting and MORB extraction that was subsequently enriched in subduction-mobile LILE and LREE.
The origin of oceanic crust with arc-like geochemical signatures can therefore be explained by a mechanism in which an influx of aqueous fluids (or siliceous melts) carrying the subduction-related enriched components (e.g. rich in mobile incompatible elements) triggers a second-stage melting event in the SSZ residual mantle that had previously yielded MORB-type melts at the spreading centre. This depleted and subsequently enriched mantle domain may undergo either simple decompression or flux-induced melting at the spreading centre to produce basaltic magmas with convergent margin geochemical signatures.
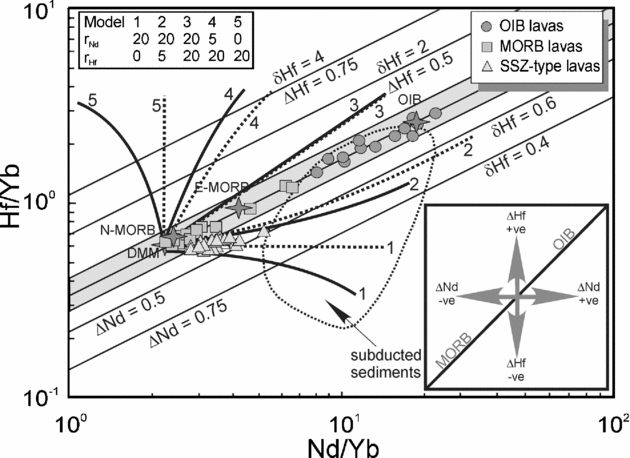
The relative importance of siliceous melts and aqueous fluids in creating subduction components in SSZ mantle melting regions can be examined using Hf–Nd systematics. In particular Hf–Nd variations can be used to understand the HFSE anomalies that characterize magmas produced along convergent plate boundaries and modelling of mixing trends on Hf–Nd element plots places constraints on the Nd/Hf ratio in the subduction component. With their similar incompatibilities HFSE and REE are generally expected to behave coherently in mantle melting systems where relatively homogenized mantle domains melt to produce MORB and OIB magmas. In areas of plate convergence and subduction, however, relative enrichment in REE results in negative anomalies in Hf concentrations with respect to Nd (e.g. Thirlwall et al. Reference Thirlwall, Smith, Graham, Theodorou, Hollings, Davidson and Arculus1994; Pearce & Peate, Reference Pearce and Peate1995).
Pearce et al. (Reference Pearce, Kempton, Nowell and Noble1999) suggest that a Hf/Yb–Nd/Yb plot can be used to provide constraints on possible roles of slab-derived components (e.g. aqueous fluids released from the slab during dehydration or silicate melts generated by partial melting of slab components) in creating convergent margin geochemical signatures. On a log–log binary plot, these element ratios give a straight-line relationship and form a horizontal mantle trend if the basaltic melt is produced by partial melting of ambient mantle compositions (e.g. MORB–OIB production). Displacements from the mantle trend, however, should be associated with addition of components having Nd/Hf ratios different from the ambient mantle-derived melt compo-sitions.
Most of the SSZ-type lavas from the ophiolitic suites of western Turkey are displaced from the ‘mantle array’ defined by MORB–OIB compositions toward the lower Hf/Yb (Fig. 9), consistent with their slight to moderate negative Hf anomalies (δHf<1). Hafnium anomalies shown by these samples seem to be consistent with the addition of a subduction-related component, in which the Nd/Hf ratio exceeds a value of about 20, or approximately five times that of the local MORB source (Fig. 9). It is suggested that Hf, although soluble to varying degrees in siliceous melts, has a low solubility in aqueous fluids derived from subducted materials and is unlikely to have been transported to the mantle in fluids originated from slab dehydration (e.g. Barry et al. Reference Barry, Pearce, Leat, Millar and Roex2006). In contrast, Nd is more soluble in both subduction-derived fluids and melts. Thus, elevated Nd/Hf ratios in slab-derived fluxes would be inconsistent with melting of sediment or oceanic crust, but could only be explained if aqueous fluids dominated subduction-related inputs to the basalt source region (e.g. Pearce et al. Reference Pearce, Kempton, Nowell and Noble1999). The data suggest that the SSZ-type tholeiitic lavas sampled from the ophiolitic suites of western Turkey are the products of melting of depleted MORB mantle which presumably interacted with subduction fluid originated largely from processes of slab dehydration.
Hf–Nd co-variations (after Pearce et al. Reference Pearce, Kempton, Nowell and Noble1999) in the basaltic lavas from the Tethyan suture zone ophiolites in western Turkey. ΔHf and ΔNd define extent of positive and negative displacements of samples from the mantle array (shown as shaded area) defined by average MORB–OIB compositions (Pearce et al. Reference Pearce, Kempton, Nowell and Noble1999). Δ values indicate displacements from the mantle array and positive Δ value corresponds to high element ratios with respect to the mantle array. Equal Hf anomalies (δHf) are represented by straight lines parallel to the MORB–OIB array, with positive ΔNd values corresponding to negative Hf anomalies. Positive ΔNd values record the proportion of subducted Nd in mantle sources. δHf describes the negative Hf anomaly as a Hf depletion (that is, δHf<1), whereas ΔNd describes the anomaly as a Nd enrichment. Both ΔHf and ΔNd can be expressed in terms of the element compositions of the mantle and subduction zone end-members. Mixing trends between depleted MORB mantle (DMM) and subducted pelagic sediment (see Pearce et al. Reference Pearce, Kempton, Nowell and Noble1999 for detail) are also shown for a mass fraction of subduction component in the mantle between 0.05 and 0.2 and a range of values of rNd and rHf at rYb equal to 0 (dashed lines) or 2 (solid lines). Representative ratios (r) for Hf and Nd between the subduction component and the mantle are shown as inset.

7. Remarks on the tectonic setting of crust generation
Because the lavas from the ophiolitic suites of western Turkey are largely accreted fragments of oceanic crust, their sampling locations may not be representative of the entire spread and nature of this particular oceanic basin. Therefore, it is difficult to evaluate the temporal geochemical changes of magmatic events that took place over the entire history of the oceanic basin. However, it is possible to identify individual mantle source components that contributed to the processes of crust generation and the relevant tectonic setting in which the oceanic crust formation took place.
Spatial or temporal modification of the magmatic affinities in ophiolites is usually thought to reflect the variation of the geotectonic setting of the primary magma source. Existence of basaltic extrusive rocks with clear geochemical distinctions within the ophiolitic suites of this study may therefore indicate more than one stage of crust generation in an oceanic environment. One of these stages is marked by the formation of lavas with MORB–OIB geochemical signatures and can be modelled by interaction between melts from at least two end-member components, each with its own chemical homogeneity. The magmatic processes during this stage are rather similar to those observed in presently active oceanic spreading systems (e.g. the East Pacific Rise: Niu et al. Reference Niu, Regelous, Wendt, Batiza and O'Hara2002) where melt production is characterized by multi-component mantle interaction and mixing of melts from variably enriched and depleted mantle domains. This stage therefore can be described as the opening stage of an oceanic basin where the crust production is dominated by along-axis pressure-release melting of depleted MORB mantle with some contribution from off-axis melting of more enriched sub-lithospheric sources.
The other stage, however, is remarkable for the formation of SSZ-type basalts and involves melt contribution from a subduction-modified upper mantle source. This stage requires oceanic crust generation in association with plate convergence, most probably along a SSZ-type spreading centre, that is, the upper plate at a convergent plate boundary (Miyashiro, Reference Miyashiro1973; Pearce, Reference Pearce, Dilek and Newcomb2003). The tholeiitic lavas produced during this stage are usually characterized by their relative depletion in subduction-immobile HFSE elements and enrichment in Th compared to average N-MORB. In some places, the subduction-enriched and MORB-type lavas are in close association, but there is no evidence that the subduction-enriched tholeiites were built onto an older MORB crust, indicating that the SSZ-type magmas were probably generated at the same oceanic spreading centre from which the adjacent MORB-type crust formed. The lack of volcanic arc associations directly overlying the MORB basalts within these ophiolitic suites and scarcity of magma compositions toward more evolved silicic intermediate rock types (e.g. andesites) may further indicate that the SSZ-type tholeiitic basalts formed in a supra-subduction-type oceanic spreading centre, rather than in a volcanic arc environment.
Possible scenarios for the addition of a subduction component into the mantle melting region and for melt generation beneath an oceanic spreading system include: (1) influx of the subduction fluid directly into the melting zone beneath the MORB-like lithosphere, thus triggering further melting; (2) hydration of young lithosphere by the subduction fluid followed by reheating by a propagating spreading centre; and (3) decompression melting of depleted and subsequently hydrated mantle as it is tapped by a spreading centre. In either case, however, the geochemical data from the subduction-enriched magmas is consistent with an origin of second-stage melts and formation of arc-like crust, and this may require generation from a relatively refractory source, most likely residual from previous MORB extraction, that was subsequently enriched in subduction-mobile LILE and LREE.
Geological evidence for similar SSZ-type extensional settings for many other ophiolite suites in Anatolia, as well as in other parts of the eastern Mediterranean, suggests that this type of tectonic environment may have been a common characteristic of closure of the Tethyan domain in this region (e.g. Yalınız, Floyd & Göncüoğlu, 1996; Robertson, Reference Robertson2002; Hoeck et al. Reference Hoeck, Koller, Meisel, Onuzi and Kneringer2002; Bortolotti et al. Reference Bortolotti, Marroni, Pandolfi, Principi and Saccani2002; Beccaluva et al. Reference Beccaluva, Coltorti, Giunta and Siena2004; Parlak et al. Reference Parlak, Hoeck, Kozlu and Delaloye2004; Göncüoğlu, Yalınız & Tekin, Reference Göncüoğlu, Yaliniz and Tekin2006a). The geological events occurring during the formation and evolution of many presently active arc-basin systems, such as the Mariana Trough, Manus Basin, Lau Basin (western Pacific) and the East Scotia Sea (e.g. Taylor & Martinez, Reference Taylor and Martinez2003; Pearce, Reference Pearce, Dilek and Newcomb2003), may provide a possible analogue for the complexity of the tectonic setting and evolution of the Tethyan oceanic realm in this region of the eastern Mediterranean.
8. Concluding remarks
The geochemical characteristics of basaltic lavas from the Tethyan suture zone ophiolites in western Turkey allow them to be divided into three broad subdivisions: (1) the MORB-type rocks that range in composition from LREE-depleted (N-MORB) through transitional to LREE-enriched (E-MORB) types; (2) the OIB-type alkaline basaltic rocks that are characterized by significant enrichment in LILE, HFSE and L-MREE, and a slight depletion in HREE, relative to MORB compositions; and (3) the SSZ-type tholeiites originated from mantle sources that are characterized by selective enrichments in fluid-soluble large ion lithophile elements (LILE) and LREE relative to the high field strength elements (HFSE).
The geochemical characteristics and temporal distributions of the eruptive products suggest two distinct stages of melt production. The first of these stages is characterized by the formation of MORB–OIB-type eruptive rock associations and is considered to be related to the opening stage of an oceanic basin, while the second stage is marked by the formation of SSZ-type tholeiitic lavas. The modelling indicates that N-MORB, E-MORB and OIB compositions in the first stage are intimately linked in the melting process and that at least two compositionally distinct mantle sources, one similar to the depleted MORB mantle and the other more enriched than the depleted MORB mantle, play a role in producing these subduction-unmodified basaltic lavas. Among the subduction-unmodified basaltic lavas, the most depleted (N-MORB) and the most enriched (OIB) compositions can be interpreted to represent melting of the depleted and enriched components, respectively, and melting-induced mixing of multi-component mantle can be considered a viable mechanism to produce the MORB–OIB compositions.
The existence of SSZ-type tholeiites with geochemical signatures indicative of pre-melting subduction influence provides evidence for the development of arc-like crust by melting of a mantle source above a subduction zone. The relative depletion in HFSE and REE for some of the SSZ basalts with respect to the average N-MORB composition further suggests generation from a relatively refractory source, which was most likely experienced from previous melting and MORB extraction and subsequent enrichment in subduction-mobile elements. This second-stage melt generation is likely to be explained by development of an arc–back-arc system in proximity to an active spreading centre, during which the SSZ-type crust generation is related to initiation of intra-oceanic subduction within a pristine MORB lithosphere.
Acknowledgements
This study was carried out as part of a research project funded in part by the University of Kocaeli and TÜBİTAK (199Y100). Gurhan Baltic is thanked for his help with the sampling in the field. We would like to thank two anonymous referees for their constructive reviews and David Pyle for much helpful editorial handling.