1 Introduction
Thermal convection occurs in many industrial and geophysical applications, ranging from heat exchangers or nuclear/chemical reactors to atmospheric circulation. In most of these cases, the flow is highly turbulent and transports heat very efficiently. Nevertheless, understanding and modelling the local and global properties of the temperature, velocity and heat-flux fields in these situations is still a challenge. To analyse turbulent thermal convection in a laboratory, we choose the Rayleigh–Bénard configuration: a horizontal layer of fluid confined between a cooling plate above and a heating plate below. In this flow configuration, the temperature gradient is confined in the thermal boundary layers close to the heating and cooling plates. Due to the strong mixing, a nearly homogeneous temperature distribution is observed in the bulk. The driving force of the flow is measured by the Rayleigh number:
 $$\begin{eqnarray}Ra=\frac{g{\it\alpha}{\rm\Delta}TH^{3}}{{\it\nu}{\it\kappa}},\end{eqnarray}$$
where
 $H$
is the height of the cell,
 $g$
is the gravitational acceleration,
 ${\it\alpha}$
is the constant pressure thermal expansion coefficient,
 ${\rm\Delta}T=T_{h}-T_{c}$
is the difference of temperature between the heating and the cooling plate,
 ${\it\nu}$
is the kinematic viscosity of the fluid and
 ${\it\kappa}$
is its thermal diffusivity. The Prandtl number expresses the ratio between viscous and thermal dissipation:
 $$\begin{eqnarray}Pr=\frac{{\it\nu}}{{\it\kappa}}.\end{eqnarray}$$
A further input parameter is the aspect ratio
 ${\it\Gamma}$
, i.e. the ratio between the horizontal and the vertical size of the cell. The response of the system is represented by the Nusselt number, which compares convective and conductive heat flux:
 $$\begin{eqnarray}Nu=\frac{QH}{{\it\lambda}{\rm\Delta}T},\end{eqnarray}$$
where
 $Q$
is the global heat flux and
 ${\it\lambda}$
is the thermal conductivity of the fluid.
Assuming locally homogeneous and isotropic turbulence, for sufficiently high Reynolds and Péclet numbers, passive scalars and velocity spectra follow the well-known Kolmogorov–Obukhov laws (Kolmogorov Reference Kolmogorov1941; Monin & Yaglom Reference Monin and Yaglom2007). However, in thermally driven flow, temperature is not a passive scalar and the similarity theory requires a further generalization. It has been argued that for small scales a thermally stratified fluid can be considered locally stationary and homogeneous, but not isotropic and axially symmetric relative to the vertical direction (Bolgiano Reference Bolgiano1959; Obukhov Reference Obukhov1959). Within this framework, the scalings become dependent on the Bolgiano–Obukhov (BO59) lengthscale measuring the importance of the thermal stratification,
 $$\begin{eqnarray}L_{BO}\equiv {\it\epsilon}^{5/4}{\it\epsilon}_{{\it\theta}}^{-3/4}({\it\alpha}g)^{-3/2},\end{eqnarray}$$
where
 ${\it\epsilon}_{T}$
and
 ${\it\epsilon}_{u}$
are the temperature and kinetic energy dissipation rate, respectively. Here
 $L_{B}$
characterizes the minimum length scale of inhomogeneities beyond which stratification should be taken into account. The ordinary Kolmogorov spectrum scalings (
 $k^{-5/3}$
) are expected to be recovered at scales smaller than the Bolgiano length. On the other hand, if
 $L_{B}$
becomes much larger than the external turbulence length scale
 $L_{0}$
, the effect of the mean flow becomes important and the similarity theory does not apply. Yet, all of the theoretical predictions and scalings are assessed for regions of space far enough from solid boundaries. In general, stratification affects a certain range of scales, which cannot be considered locally isotropic. Corrections to the velocity and temperature correlations and spectra may be universal and may be in principle determined empirically. For stable stratified flows, Bolgiano (Reference Bolgiano1959) established a theoretical framework to determine the asymptotic form of these functions for scales much greater than
 $L_{B}$
. These Bolgiano–Obukhov (BO59) scalings predict spectra that are steeper for the velocity and milder for the temperature compared with those given by Kolmogorov–Obukhov scalings. Nevertheless, the ultimate picture on velocity and temperature scalings in thermal convection is far from being obtained (Lohse & Xia Reference Lohse and Xia2010). Experimental measurements at
 $Ra\approx 10^{10}$
and
 $Pr=4.4$
exhibit a K41 behaviour for velocity (Zhou, Sun & Xia Reference Zhou, Sun and Xia2008) and for velocity and temperature (Sun, Zhou & Xia Reference Sun, Zhou and Xia2006) structure functions. However, direct numerical simulations (DNS) of thermal convection on a cylindrical domain (Kunnen et al.
Reference Kunnen, Clerx, Geurts, Bokhoven, van Akkermans and Verzicco2008) show a BO59 scaling for temperature structure functions in the radial direction and for vertical velocity structure functions in the longitudinal direction (
 $Ra=10^{8}$
,
 $Pr=1$
).
Even though remarkable progress has been made towards a deeper understanding of scaling laws between control and response parameters (Grossmann & Lohse Reference Grossmann and Lohse2000; Chavanne et al.
Reference Chavanne, Chillà, Chabaud, Castaing and Hébral2001; Stevens et al.
Reference Stevens, van der Poel, Grossmann and Lohse2013), new investigations are required to clarify some of the open issues (Lohse & Xia Reference Lohse and Xia2010; Chillà & Schumacher Reference Chillà and Schumacher2012). Most literature studies on Rayleigh–Bénard turbulence have been focused on Eulerian measurements of velocity and temperature distribution (Tilgner, Belmonte & Libchaber Reference Tilgner, Belmonte and Libchaber1993; Xia, Sun & Zhou Reference Xia, Sun and Zhou2003), with the aim of characterizing the behaviour of the local heat flux,
 $Nu$
, as a function of the Rayleigh number,
 $Ra$
(Shang et al.
Reference Shang, Qiu, Tong and Xia2004). Although the mean velocity in the central region of the convection cell is homogeneous and close to zero, the velocity root-mean-square is neither homogeneous nor isotropic (Qiu, Yao & Tong Reference Qiu, Yao and Tong2000; Xia et al.
Reference Xia, Sun and Zhou2003). These flow inhomogeneities prevent from using the frozen-flow hypothesis (Taylor Reference Taylor1938): this makes the connection between time-domain measurements and space-domain predictions difficult.
More recently, improvements in computing power and storage capacities have allowed the appearance of Lagrangian studies of turbulence, which naturally provide useful information on transport mechanisms. The Lagrangian description of turbulence has significantly contributed to our current comprehension of transfer processes (Toschi & Bodenschatz Reference Toschi and Bodenschatz2009). In particular, a number of experimental (La Porta et al. Reference La Porta, Voth, Crawford, Alexender and Bodenschatz2001; Mordant et al. Reference Mordant, Metz, Michel and Pinton2001; Voth et al. Reference Voth, La Porta, Crawford, Alexender and Bodenschatz2002), numerical (Yeung Reference Yeung2002; Biferale et al. Reference Biferale, Boffetta, Celani, Devenish, Lanotte and Toschi2004) and theoretical (Chevillard et al. Reference Chevillard, Roux, Lévêque, Mordant, Pinton and Arnéodo2003) studies focused on velocity and acceleration statistics in homogeneous and isotropic turbulence. The first numerical Lagrangian studies of thermal convection were those of Schumacher (Reference Schumacher2008, Reference Schumacher2009), which were specifically focused on pair dispersion and on acceleration statistics. Although the tracer motion was largely anisotropic due to the vertical buoyancy, pair dispersion was close to the homogeneous and isotropic turbulence. Acceleration and temperature statistics showed a non-Gaussian behaviour characterized by a large intermittency (higher in the horizontal directions). Relevant to the present work was also the finding of the non-symmetric behaviour of the heat transport probability density function (PDF). From an experimental point of view, measurements of turbulent thermal convection in a Lagrangian framework are relatively scarce. Only recently, Ni, Huang & Xia (Reference Ni, Huang and Xia2012) used three-dimensional particle tracking velocimetry to analyse velocity and acceleration statistics in turbulent Rayleigh–Bénard convection. In particular, they observed a Gaussian and a stretched exponential distribution for the PDF of velocity and acceleration in the centre of the cell.
From the above review, phenomenological and statistical analyses of turbulent Rayleigh–Bénard convection in a Lagrangian frame of reference appear not yet complete and require further investigation. This is exactly the purpose of the present study. In this work, we present both experimental and numerical measurements of temperature and velocity in a Lagrangian frame. For the experiments, we improved the neutrally buoyant instrumented particle presented in Shew et al. (Reference Shew, Gasteuil, Gibert, Metz and Pinton2007) and already used and tested by Gasteuil et al. (Reference Shew, Gibert, Chillà, Castaing and Pinton2007). This smart particle explores a rectangular Rayleigh–Bénard cell filled with water. We compare Eulerian maps obtained from our Lagrangian data with particle-image velocimetry (PIV) measurements, to show that the particle samples correctly the entire flow (and to deduce pseudo-Eulerian maps of temperature and thermal flux). At the same time, we perform DNS of Lagrangian particle tracking of massless tracers in turbulent Rayleigh–Bénard convection. These numerical simulations correspond to the ideal case of a particle of zero diameter and, therefore, they can be viewed as a ‘thought experiment’ built to highlight possible finite-size effect of the smart particle in the experiments. Velocity, temperature and heat flux statistics obtained from experiments and numerical simulations are compared and discussed.
2 Smart particle, experimental set-up and numerical simulation method
2.1 Smart particle
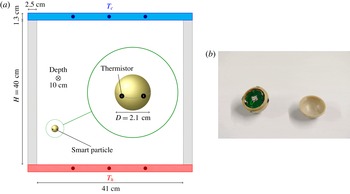
The mobile sensor consists of a 2.1 cm in diameter capsule containing temperature instrumentation, a radiofrequency emitter and two batteries. The mobile cover is polyvinyl chloride (PVC) with a thermal conductivity
 ${\it\lambda}_{p}=0.19~\text{W}~\text{m}^{-1}~\text{K}^{-1}$
at ambient temperature. Four cylindrical thermistors (
 $0.8~\text{mm}$
in length,
 $0.4~\text{mm}$
in diameter,
 $230~\text{k}{\rm\Omega}$
, response time 0.6 s in water) are mounted on the capsule wall protruding 0.5 mm into the surrounding flow (see sketch in zoom of figure 1(a) and photograph figure 1(b)). A resistance controlled oscillator is used to create a square wave whose frequency depends on the average of the four measured temperatures. This square wave is used directly to modulate the frequency of a radio wave generated by the radiofrequency emitter. The temperature signal is recovered on the fly by a stationary receiver. The capsule has been redesigned (compared with that described by Shew et al. (Reference Shew, Gasteuil, Gibert, Metz and Pinton2007)) in order to have the four thermistors at the equator and a simpler handling. A new shell has been conceived to contain two batteries and to extend the emission time which can now reach up to 1000 turnover times. The position of the batteries fixes one rotation axis. As a consequence, the four thermistors lay on a horizontal plane during the particle displacement. At the same time the trajectory of the particle is recorded with a digital camera placed in front of the large face of the cell (due to cell dimensions, we assume that the mean flow is quasi-bidimensional).
(a) Sketch of the convection cell and of the mobile sensor. The six dark dots in the plates show the location of the PT100 temperature sensors. (b) Photograph of the instrumented particle (open). We see the batteries in place.

2.2 Experimental set-up
Our convection cell is a
 $10.5~\text{cm}$
thick
 $41.5~\text{cm}\times 41.5~\text{cm}$
rectangular cell with 2.5 cm thick PMMA walls (see sketch figure 1(a)). Both plates consist of 4 cm thick copper plates coated with a thin layer of nickel. The bottom plate is Joule-heated while the top plate is cooled with a temperature regulated water circulation. Plate temperatures are controlled by PT 100 temperature sensors. We work with deionized water. The bulk temperature is fixed between 37.05 and
 $38.35\,^{\circ }\text{C}$
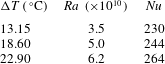
in different experiments. The corresponding Prandtl number are in the range 4.62–4.49. Main parameters are grouped in table 1.
Parameters used for acquisitions in the experiments.

We can estimate the thermal boundary layer thickness by
 $$\begin{eqnarray}{\it\delta}_{{\it\theta}}=\frac{H}{2\,Nu}.\end{eqnarray}$$
In our case,
 ${\it\delta}_{{\it\theta}}$
is in the range
 $0.8{-}0.9~\text{mm}$
. This is consistent with measurements of Salort et al. (Reference Salort, Liot, Rusaoen, Seychelles, Tisserand, Creyssels, Castaing and Chillà2014), who used the same cell, though with a rough bottom plate, and found
 ${\it\delta}_{{\it\theta}}\approx 0.8~\text{mm}$
close to the top-smooth plate (assuming plates independence (Tisserand et al.
Reference Tisserand, Creyssels, Gasteuil, Pabiou, Gibert, Castaing and Chillà2011)). The corresponding kinetic boundary layer thickness, in the Prandtl–Blasius theory for
 $Pr>1$
, can be estimated by
 $$\begin{eqnarray}{\it\delta}_{v}\approx Pr^{1/3}{\it\delta}_{{\it\theta}},\end{eqnarray}$$
which leads to a kinetic boundary layer thickness in the range
 $1.3{-}1.5~\text{mm}$
. Consequently the smart particle, with its diameter of
 $21~\text{mm}$
, cannot be influenced by the thermal and the kinetic boundary layers.
2.3 Numerical simulations
DNS are performed to complement our experimental results. We consider an incompressible and Newtonian turbulent flow of water confined between two rigid boundaries. Horizontal and wall-normal coordinates are indicated by
 $x$
,
 $y$
and
 $z$
, respectively.
The bottom wall is kept at uniform high temperature (
 $T_{h}$
), whereas the top wall is kept at uniform low temperature (
 $T_{c}$
). The size of the computational domain is
 $L_{x}\times L_{y}\times L_{z}=2{\rm\pi}H\times 2{\rm\pi}H\times 2H$
(in
 $x$
,
 $y$
and
 $z$
, respectively), where
 $H$
is the half-channel height. Periodic boundary conditions are imposed on velocity and temperature along the horizontal
 $x$
and
 $y$
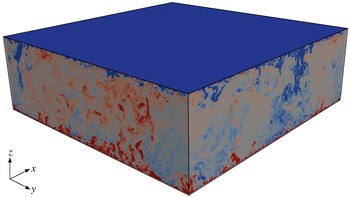
directions; at the walls, no slip conditions are enforced for the momentum equations while constant temperature conditions are adopted for the energy equation. A sketch of the computational domain/flow conditions is presented in figure 2.
Sketch of the numerical simulation domain. Temperature contours for
 $Ra=10^{9}$
are also shown (red indicates regions of high temperature whereas blue indicates regions of low temperature).

The imposed temperature difference
 ${\rm\Delta}T=(T_{h}-T_{c})$
between the bottom and the top wall induces an unstable buoyancy effect within the flow field (the acceleration due to gravity
 $g$
acts downward along
 $z$
). Mass, momentum and energy equations in dimensionless form and under the Boussinesq approximation are
 $$\begin{eqnarray}\displaystyle & \boldsymbol{{\rm\nabla}}\boldsymbol{\cdot }\boldsymbol{u}=0, & \displaystyle\end{eqnarray}$$
 $$\begin{eqnarray}\displaystyle & \displaystyle \frac{\partial \boldsymbol{u}}{\partial t}+(\boldsymbol{u}\boldsymbol{\cdot }\boldsymbol{{\rm\nabla}})\boldsymbol{u}=-\boldsymbol{{\rm\nabla}}p+4\sqrt{\frac{Pr}{Ra}}{\rm\nabla}^{2}\boldsymbol{u}+{\it\delta}_{i,z}{\it\theta}, & \displaystyle\end{eqnarray}$$
 $$\begin{eqnarray}\displaystyle & \displaystyle \frac{\partial {\it\theta}}{\partial t}+(\boldsymbol{u}\boldsymbol{\cdot }\boldsymbol{{\rm\nabla}}){\it\theta}=+\frac{4}{\sqrt{PrRa}}{\rm\nabla}^{2}{\it\theta}, & \displaystyle\end{eqnarray}$$
where
 $\boldsymbol{u}$
is the velocity vector,
 ${\it\theta}$
is the dimensionless temperature
 ${\it\theta}=(T-T_{ref})/{\rm\Delta}T$
,
 $p$
is pressure, whereas
 ${\it\delta}_{i,z}{\it\theta}$
is the buoyancy force (acting in the vertical direction only) that drives the flow. Equations (2.3)–(2.5) have been obtained using
 $H$
as the reference length,
 $u_{ref}=\sqrt{Hg{\it\alpha}{\rm\Delta}T/2}$
as the reference velocity,
 $T_{ref}=(T_{h}+T_{c})/2$
as the reference temperature and
 $p={\it\rho}g{\it\alpha}H{\rm\Delta}T/2$
as the reference pressure. Density
 ${\it\rho}$
, kinematic viscosity
 ${\it\nu}$
, thermal diffusivity
 ${\it\kappa}$
and thermal expansion coefficient
 ${\it\alpha}$
are evaluated at a mean fluid temperature of
 $\simeq 30\,^{\circ }\text{C}$
. The Prandtl and the Rayleigh numbers in (2.3)–(2.5) are defined as
 $Pr={\it\nu}/{\it\kappa}$
and
 $Ra=(g{\it\alpha}{\rm\Delta}T(2H)^{3})/({\it\nu}{\it\kappa})$
, respectively. In the present study, we keep the Prandtl number
 $Pr=4$
and we vary the Rayleigh number between
 $Ra=10^{7}$
and
 $10^{9}$
. The resulting set of equations are discretized using a pseudo-spectral method based on transforming the field variables into wavenumber space, through Fourier representations for the periodic (homogeneous) directions
 $x$
and
 $y$
, and Chebychev representation for the wall-normal (non-homogeneous) direction
 $z$
(see Zonta, Onorato & Soldati Reference Zonta, Onorato and Soldati2012; Zonta & Soldati Reference Zonta and Soldati2014 for details). We used up to
 $512\times 512\times 513$
grid points to discretize the computational domain. We injected
 $N_{p}=1.28\times 10^{5}$
Lagrangian tracers and we computed their dynamics as
 $$\begin{eqnarray}\dot{\boldsymbol{x}}_{p}=\boldsymbol{u}(\boldsymbol{x}_{\boldsymbol{p}}(t),t)\quad {\it\theta}_{p}={\it\theta}(\boldsymbol{x}_{\boldsymbol{p}}(t),t),\end{eqnarray}$$
with
 $\boldsymbol{x}_{\boldsymbol{p}}$
the tracers position and
 ${\it\theta}_{p}$
their temperature. Velocity and temperature at particle position are obtained by sixth-order Lagrange polynomials. Time advancement for the Lagrangian tracers is achieved using a fourth-order Runge–Kutta scheme.
As discussed above, numerical simulations are carried out in a laterally opened (along
 $x$
and
 $y$
) domain configuration, which is similar to that considered in the theory (where the vertical direction is not homogeneous, because of the buoyancy, while the other two are homogeneous and isotropic). Experiments must be performed in a closed cell and effects due to anisotropy may appear also in the other directions. Moreover, passive tracers in numerical computations are free to explore the entire domain, whereas the smart particle, due to its dimensions, cannot directly access the tiny boundary layer region. The comparison between experiments and simulations is precisely aimed at highlighting these differences, which might have some influence on the flow statistics, as will be discussed in the following.
3 Lagrangian measurements
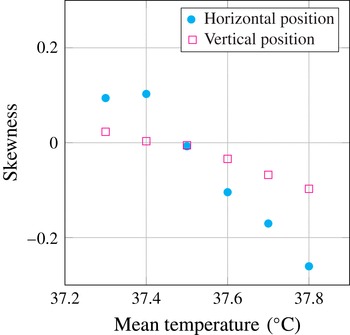
To follow accurately the flow, the capsule and fluid density are carefully matched within 0.005 %. This is the main difficulty of the experiment. In figure 3 we plot the skewness of the distributions of the horizontal and vertical positions while varying the mean temperature of the cell. Due to the flow symmetry, we assume that the particle ideally matches the fluid density when both horizontal and vertical skewness are close to zero, which happens for a temperature of
 $37.5\,^{\circ }\text{C}$
. If the mean temperature is shifted by a few tenths of degrees Centigrade, symmetry is broken while the particle becomes less neutrally buoyant. The effect is more dramatic on the horizontal position. To explain it, we assume a particle denser than the fluid. When travelling along the top plate, it is easily advected by cold plumes: the particle goes downwards earlier during the travel. When travelling along the bottom plate, it is more difficult for a plume to advect the particle: it goes upwards only when reaching the corner of the cell. As a consequence, the average horizontal particle trajectory is shifted close to the plate region where hot plumes rise. This reasoning holds also for a less-dense particle and explain the large skewness of the distribution of the horizontal position.
Skewness of the distribution of the vertical and horizontal positions of the smart particle versus the temperature of the cell centre.

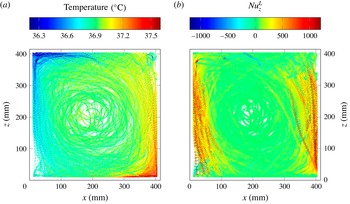
We performed measurements from 6 to 20.3 h. The cell is kept as horizontal as possible to minimize the influence of additional flow parameters on the final results. Although flow reversals may occur in horizontal cells, in the present experiments we have never observed such events. Figure 4(a) shows an example of a temperature measurement along the particle trajectory. In this case,
 $Ra=5.0\times 10^{10}$
while the acquisition time is 6 h. Globally, the particle describes a loop in the counterclockwise direction (the rotation direction can change for other acquisitions). Its mean speed is
 $1~\text{cm}~\text{s}^{-1}$
. Close to walls and plates, its speed is typically
 $2{-}3~\text{cm}~\text{s}^{-1}$
.
(a) Flow temperature along the particle trajectory at
 $Ra=5.0\times 10^{10}$
, 6-h acquisition. (b) Corresponding Lagrangian vertical Nusselt
 $Nu_{z}^{L}$
. Trajectories are undersampled for visibility purposes.

As stated previously, the thermal boundary layer thickness can be computed as
 $$\begin{eqnarray}{\it\delta}_{{\it\theta}}=\frac{H}{2Nu},\end{eqnarray}$$
which corresponds to a thickness of less than 1 mm for the considered Rayleigh numbers, which is not directly accessible to our particle. This is why we do not observe large temperature gradients close to the top and bottom plates. However, we clearly detect hot and cold jets near the right and left walls, respectively. Temperature fluctuations in the cell (outside the boundary layers) are typically
 $1\,^{\circ }\text{C}$
and are likely due to advection by plumes. Nevertheless, joint measurements of temperature and trajectory give indications that the particle movement is more influenced by the mean wind than by plumes, except close to the vertical walls, inside hot and cold jets. The reason for this observation could be the size of the smart particle being larger than the typical size of the thermal plumes, which in turn scales with the thermal and boundary layer thickness (
 ${\approx}$
1 mm). Note that a smaller particle could be more influenced by plumes than by the mean wind.
From the knowledge of the velocity and temperature of the particle, we can compute the Lagrangian thermal flux. We use a normalized vertical Nusselt number (Ching et al. Reference Ching, Guo, Shang, Tong and Xia2004; Grossmann & Lohse Reference Grossmann and Lohse2004):
 $$\begin{eqnarray}Nu_{z}^{L}=1+\frac{H}{{\it\kappa}{\rm\Delta}T}(T(t)-\langle T(t)\rangle _{t})v_{z}(t),\end{eqnarray}$$
where
 $T(t)$
is the instantaneous temperature measured by the particle,
 $\langle T(t)\rangle _{t}$
is its mean along the trajectory and
 $v_{z}(t)$
is its vertical velocity. Figure 4(b) shows the
 $Nu_{z}^{L}$
along the trajectory. Most of the vertical thermal transfer is symmetrically concentrated in the hot and cold jets, corresponding to plumes where
 $T(t)-\langle T(t)\rangle _{t}$
and
 $v_{z}(t)$
have the same sign. The average vertical heat flux along the trajectory reaches
 $\langle Nu_{z}^{L}\rangle _{t}=138$
. We observe very intense positive events in the jets (up to 30 times larger than the average) but only few, small negative events. This point will be detailed in § 5.1.
4 Pseudo-Eulerian maps
4.1 Methodology and PIV measurements
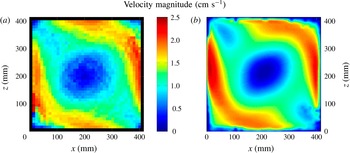
The velocity distribution in the central region of the convection cell is close to that of a solid body rotation, a situation that hinders the particle from exploring this region easily. To obtain a correct resolution of the central region we performed very long experiments. With more than 20-h measurement, we have enough data in the whole cell (including the central zone) to compute pseudo-Eulerian maps of several quantities. To do this, we divide our cell in 1.04 cm
 $\times$
1.04 cm squares and we compute the average of the considered quantity in each cell. The accuracy of the method has been evaluated through a comparison of the pseudo-Eulerian velocity field (figure 5(a)) with the results obtained by PIV measurements in the same cell (figure 5(b)) at similar Rayleigh numbers. We performed PIV measurements with a 1.2 W, Nd : YVO
 $_{4}$
laser. Flow was seeded with Spherical 110P8 glass beads of 1.10
 $\pm$
0.05 in denseness and of
 $12~{\rm\mu}\text{m}$
average diameter. Twelve-hour acquisitions with one picture pair (frequency acquisition 20 Hz) every 10 s were used to compute mean velocity fields. We used CIVx (Fincham & Delerce Reference Fincham and Delerce2000) free software for analysis. Several passes are applied to picture pairs. For the first one, we cut out pictures in 30
 $\times$
30 pixels
 $^{2}$
elementary boxes with 50 % overlap. Search zones was one and a half larger.
The velocity magnitude obtained from PIV is in good agreement with observations from Xia et al. (Reference Xia, Sun and Zhou2003) for a similar cell. The small differences of the flow structure between PIV and pseudo-Eulerian map are linked to the imperfect sampling of space by the smart particle. Moving inside the cell, the smart particle samples more frequently specific regions of the flow rather than others, with possible effects on the Lagrangian statistics compared with Eulerian ones. This is the case of the bottom-left corner (
 $z\approx 100$
mm and
 $x\approx 10$
mm) and of the top-right corner (
 $z\approx 320$
mm and
 $x\approx 400$
mm). The velocity measured with the smart particle is slightly lower than that obtained with the PIV technique, probably due to at least two effects: a small difference in the Rayleigh number and particle size. For particles with the same density of the surrounding fluid and moving in a turbulent flow, experimental (Qureshi et al.
Reference Qureshi, Bourgoin, Baudet, Cartellier and Gagne2007a
, Reference Qureshi, Arrieta, Baudet, Cartellier, Gagne and Bourgoin2008) and numerical (Lucci, Ferrante & Elghobashi Reference Lucci, Ferrante and Elghobashi2011) studies show that the size of the particles has a slight effect on the velocity dynamics but a strong effect on the acceleration variance (not shown here). This is consistent with our observations on the mean velocity field. Moreover, and contrary to the PIV measurement, we observe a minimum of the magnitude of the velocity near the corners, where a vertical velocity becomes a horizontal velocity. This could be due to the particle size and stiffness (small deformability). In the corners, streamlines are deflected and the smart particle filters the flow at a characteristic spatial and temporal scale. As a consequence, the change of direction is much more complex for the smart particle than for the fluid, which can lead to a deceleration of the particle in these regions.
A further explanation for the lower velocity measured by the smart particle compared with PIV could be the time response of the particle to temperature fluctuations. We can estimate the time response of the particle by
 $$\begin{eqnarray}t_{r}\sim \frac{d^{2}}{{\it\kappa}},\end{eqnarray}$$
where
 $d^{2}$
is a characteristic length. The response time of the 1 mm thick PVC mobile cover is
 $t_{r}^{p}\sim 13$
s. If we assume that the smart particle is filled with air, the corresponding response-time is
 $t_{r}^{i}\sim 19$
s. These values of the response time are close to the time the smart particle spends to travel from the top to the bottom plate and vice versa. Consequently, in some regions of the flow, the smart particle could have a slightly different denseness from the fluid which could have a small influence on the velocity measured by the smart particle. Nevertheless, as we can observe in figure 5, the particle motion is very similar to the fluid one.
(a) Pseudo-Eulerian field of the velocity magnitude from Lagrangian data,
 $Ra=5.0\times 10^{10}$
. (b) Field of the velocity magnitude obtained by PIV,
 $Ra=5.6\times 10^{10}$
.

We can also estimate the Stokes number of the smart particle. For the case of neutrally buoyant particles with a size larger than the Kolmogorov length scale
 ${\it\eta}$
, we can estimate the Stokes number by Qureshi et al. (Reference Qureshi, Arrieta, Baudet, Cartellier, Gagne and Bourgoin2008) and Xu & Bodenschatz (Reference Xu and Bodenschatz2008):
 $$\begin{eqnarray}St=\frac{d_{p}^{4/3}}{12{\it\eta}^{4/3}},\end{eqnarray}$$
where
 $d_{p}$
is the particle diameter. The Stokes number turns out to be about 12. Some experimental (Qureshi et al.
Reference Qureshi, Bourgoin, Baudet, Cartellier and Gagne2007b
, Reference Qureshi, Arrieta, Baudet, Cartellier, Gagne and Bourgoin2008) and numerical (Lucci et al.
Reference Lucci, Ferrante and Elghobashi2011) works show that for neutrally buoyant particles, the Stokes number does not have a strong effect on the velocity dynamics. However we will observe some finite-size effects, especially on spectra.
4.2 Temperature and thermal flux maps
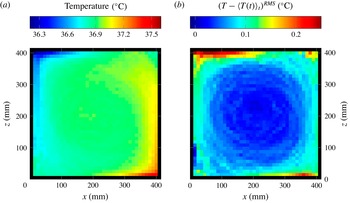
Our Lagrangian method can be efficiently used to obtain pseudo-Eulerian map of temperature in the whole cell. To the best of the authors’ knowledge, this is the first Lagrangian experiment giving the whole temperature map for this range of Rayleigh and Prandtl numbers. The pseudo-Eulerian temperature field is plotted in figure 6(a). We observe that the flow is homogeneous in the bulk, whereas hot and cold jets dominate the regions close to the walls. Deviations of temperature from the bulk value are in particular seen in the top-left and bottom-right corners and are likely due to the effect of buoyant plumes driving the smart particle along the vertical walls. As suggested by Scagliarini, Gylfason & Toschi (Reference Scagliarini, Gylfason and Toschi2014), the mean wind acts stabilizing the boundary layers and reducing the plume emission activity. Moreover, the intense mixing makes the plume temperature close to the bulk temperature along the plates but in the top-left and bottom-right corners (where the mean wind is blocked and mixing cannot be observed).
Pseudo-Eulerian (a) temperature field and (b) root mean square of the difference between the temperature and the temperature average along the trajectory. Measurements at
 $Ra=5.0\times 10^{10}$
.

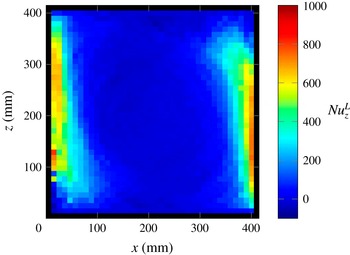
This situation is well represented in figure 6(b), where we observe large fluctuations in the corners but fewer fluctuations in the vertical jets and close to the plates. The observed slight asymmetry can be explained by a non-perfect particle-to-fluid density matching. With velocity and temperature joint measurements, this is the only Lagrangian experimental technique that gives a pseudo-Eulerian thermal flux map which is presented in figure 7. We observed that
 $Nu_{z}^{L}$
is large inside both cold and hot jets, where vertical velocity
 $v_{z}$
is large, and indicates that the spatial distribution of
 $Nu_{z}^{L}$
is chiefly influenced by plumes.
Vertical Nusselt
 $Nu_{z}^{L}$
pseudo-Eulerian map at
 $Ra=5.0\times 10^{10}$
.

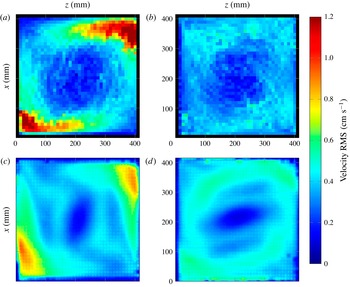
(a) Vertical velocity RMS pseudo-Eulerian map; (b) horizontal velocity RMS pseudo-Eulerian map; (c) vertical velocity RMS obtained by PIV; (d) horizontal velocity RMS obtained by PIV. Here
 $Ra=5.0\times 10^{10}$
for pseudo-Eulerian maps and
 $Ra=5.6\times 10^{10}$
for PIV fields.

4.3 Velocity fluctuations
Now we discuss velocity root-mean-square (RMS) maps obtained by our smart particle in connection with the results obtained by PIV measurements. From the velocity pseudo-Eulerian maps, we can compute smooth velocity mean fields by interpolation. This velocity value at each point
 $(x,z)$
is indicated as
 $v_{i}^{E}(x,z)$
where
 $i=x,z$
is the horizontal or vertical velocity, respectively. Thus, in each square
 $s$
described above, for all
 $(x_{s},y_{s})$
Lagrangian coordinates of the particle trajectory included in the square we have
 $$\begin{eqnarray}v_{i,s}^{RMS}=\sqrt{\langle (v_{i}^{L}(x_{s},z_{s})-v_{i}^{E}(x_{s},z_{s}))^{2}\rangle _{s}},\end{eqnarray}$$
where
 $v_{i}^{L}(x_{s},z_{s})$
represents the Lagrangian velocity events inside the considered square and
 $\langle .\rangle _{s}$
is the average of these events. This is similar to the velocity RMS computed from PIV measurements for all
 $(x,y)$
in the cell:
 $$\begin{eqnarray}v_{i}^{RMS}(x,z)=\sqrt{\langle (v_{i}(x,z,t)-\langle v_{i}(x,z,t)\rangle _{t})^{2}\rangle _{t}}.\end{eqnarray}$$
In these two definitions, both
 $v_{i}^{E}(x,z)$
and
 $\langle v_{i}(x,z,t)\rangle _{t}$
represent the mean flow. Figure 8 compares vertical (a,c) and horizontal (b,d) velocity fluctuations from the smart particle (a,b) and from PIV (c,d). First, we note that RMS values recorded by the particle are slightly smaller compared with those evaluated by PIV (excepted in the top-right and bottom-left corners). This is mainly due to the filtering effect played by the particle on small-scale fluctuations. This is consistent with an experimental study in a Von-Kármán flow (Machicoane et al.
Reference Machicoane, Zimmermann, Fiabane, Bourgoin, Pinton and Volk2015). The velocity RMS of large particles decreases slightly when their diameter increases relatively to the integral scale. There is also a secondary effect due to a small difference in the value of
 $Ra$
(
 $Ra=5\times 10^{10}$
for the Lagrangian particle and
 $Ra=5.6\times 10^{10}$
for PIV measurements). The two regions characterized by the largest fluctuations (where Lagrangian velocity fluctuations can be up to 50 % more intense than those measured by PIV) are those where vertical plumes impinge on the horizontal walls and induce large turbulence patches. In our Lagrangian measurements, we also observe significant fluctuations along the horizontal plates: these fluctuations, which are not visible in the PIV measurements, are due to particle rebounds on the horizontal walls. To estimate their influence on the pseudo-Eulerian velocity RMS map we propose a simple model. A fluid particle impinging on a wall follows faithfully the flow streamlines and converts instantaneously its vertical velocity into a horizontal one. By contrast, the smart particle is characterized by a finite size and by a large stiffness. When it approaches the wall, its trajectory will not adapt immediately to the flow streamlines and the particle will hit the wall. If we assume an elastic rebound with the wall, a positive vertical velocity will become a negative one and vice versa. Due to this rebound, the RMS of the velocity measured by the smart particle will be twice the size of that characterizing the fluid. Since we observe one particle rebound at the wall every two large-scale turnovers, the increase of the velocity RMS is of the order of 50 %. This is exactly the increase of vertical velocity RMS observed between pseudo-Eulerian and Eulerian maps. Although these rebounds have an influence on the vertical-velocity statistics in the corners, the effect on the vertical Lagrangian Nusselt number is negligible. These corners are indeed characterized by a local temperature that is close to the mean one (see figure 6(b)). Consequently, seeing the
 $Nu_{z}^{L}$
definition (3.2), this will weakly affect the vertical heat flux.
5 Flow statistics
5.1 PDFs
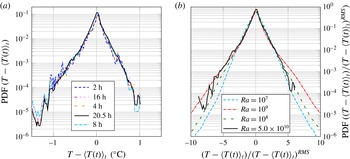
In figure 9(a) we show the PDF of the temperature fluctuations recorded by our instrumented particle at
 $Ra=5\times 10^{10}$
for different measurement time (
 $t=2$
, 4, 8, 16,
 $20.5~\text{h}$
). We note that the shape of the PDF becomes increasingly smooth for increasing measurement times. Present results based on
 $20.5~\text{h}$
measurements substantially improve previous results of Gasteuil et al. (Reference Shew, Gibert, Chillà, Castaing and Pinton2007) obtained with a 2-h acquisition. Nevertheless, the global shape is conserved, and confirms the overall quality of the results by Gasteuil et al. (Reference Shew, Gibert, Chillà, Castaing and Pinton2007). The nearly symmetric shape of the PDF is a further signature of the quality of the results (good buoyancy neutrality). However, there is a small asymmetry of the shape of the temperature PDF, whose skewness is
 $-0.5$
. This effect is due to a very small buoyancy of the smart particle. The skewness of the distribution of the horizontal and the vertical position are respectively 0.06 and 0.03. By looking at figure 3, it corresponds to an error of about
 $0.05\,^{\circ }\text{C}$
above the isodensity temperature (equivalent to an error of 0.002 %). Since we have a buoyancy-driven flow, the smart particle can be very sensitive to small density differences. In the present case, the particle stays a little longer in the top-left corner, where it likely measures cold temperatures rather than hot ones.
(a) PDF of the temperature fluctuations
 $T-\langle T(t)\rangle _{t}$
at
 $Ra=5.0\times 10^{10}$
for different measurement times. (b) Comparison between experimental and numerical results of the PDF of temperature fluctuations,
 $T-\langle T(t)\rangle _{t}$
, normalized by the corresponding standard deviation. Solid line represents experimental data whereas dashed lines correspond to DNS data at different
 $Ra$
.

The PDF has sharp exponential tails, in agreement with previous Eulerian measurements (Belmonte, Tilgner & Libchaber Reference Belmonte, Tilgner and Libchaber1994) performed far from the boundary layers and using air at
 $Ra=4.8\times 10^{7}$
. However, tails are wider due to the passage of the particle in hot and cold jets. This suggests that Eulerian measurements in Rayleigh–Bénard convection are delicate: since the flow is largely inhomogeneous, the position at which the measurement is taken is fundamental. The generalization of the behaviour of the entire cell based on a local measurement requires a lot of care. In figure 9(b), we compare experimental results of the PDF of temperature fluctuations obtained in the 20.5-h measurement with our results from numerical simulations at different Rayleigh numbers. Results are normalized by the corresponding temperature standard deviation,
 $\text{std}(T)$
. Even though numerical experiments are carried out at smaller Rayleigh number, the agreement between experiments and simulations is satisfactory when
 $Ra>10^{8}$
. Deviations between experimental and numerical results are observed only for
 $(T-\langle T(t)\rangle _{t})/(T-\langle T(t)\rangle _{t})^{RMS}>3$
, hence highlighting the accuracy of the present experiments. Indeed, our numerical simulations can be seen as an ideal experiment, since we sample the flow field with massless (pointwise) fluid tracers (no size/inertia effect of the Lagrangian probes). Within this framework, the difference between experiments and simulations can give indications on the effect of the size of our smart particle: due to the finite size, our smart particle acts as a filter for small/short space/time scale events, and numerical experiments show larger tails. It is worth noting that the particle does not visit all the regions of the cell, notably close to walls, and that might be in principle one of the reason of such difference. However, at sufficient high
 $Ra$
(
 ${>}10^{9}$
) boundary layer is very thin and figure 9 together with similar comparisons for the velocity (not presented here) show that the difference is always confined to the tails of distributions.
As mentioned previously, with our instrumented particle we are able to record simultaneously velocity and temperature, hence we can compute the local value of the vertical Nusselt number
 $Nu_{z}^{L}$
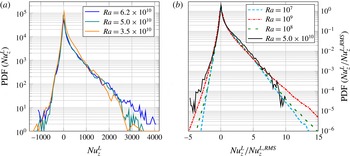
. Figure 10(a) shows the histogram of the vertical Nusselt for three different Rayleigh numbers. The most probable value is
 $Nu_{z}^{L}=0$
, corresponding to the time during which the particle has a horizontal trajectory or is advected by the mean wind far from the walls (hence, far from plumes), where no significant vertical heat flux is observed. Interestingly, there is a larger positive tail, which is the signature of near-wall intense events (Gasteuil et al.
Reference Shew, Gibert, Chillà, Castaing and Pinton2007). When
 $Ra$
increases, the shape of the histogram does not change, but we observe more intense events at higher
 $Ra$
. In figure 10(b) we compare our experimental and numerical results of
 $\text{PDF}(Nu_{z}^{L})$
. Results are normalized by their corresponding standard deviation,
 $\text{std}(Nu_{z}^{L})$
. We observe a very good agreement between experiments and simulations over the entire range of measured
 $Nu_{z}^{L}/\text{std}(Nu_{z}^{L})$
, for
 $Ra>10^{8}$
. Deviations are seen only for extreme and rare events,
 $Nu_{z}^{L}/\text{std}(Nu_{z}^{L})>7$
, due to the filtering effect of the smart particle size on velocity/temperature fluctuations.
(a) PDF of the vertical thermal flux
 $Nu_{z}^{L}$
for different Rayleigh numbers, 6-h measurements. (b) Comparison of the vertical Nusselt PDF
 $Nu_{z}^{L}$
normalized by the standard deviation. Solid line represents experimental data whereas dashed lines correspond to DNS ones.

5.2 Spectral analysis
We conclude our discussion with a spectral analysis of velocity and temperature Lagrangian time series recorded at different Rayleigh numbers. Let us recall some scalings in stratified flows based on Kolmogorov similarity theory (Monin & Yaglom Reference Monin and Yaglom2007). In the inertial range, dimensional considerations suggest
 $$\begin{eqnarray}E_{u}(k)={\it\epsilon}^{2/3}k^{-5/3}{\it\Psi}_{u}(k/L_{BO}),\quad E_{{\it\theta}}(k)={\it\epsilon}_{{\it\theta}}{\it\epsilon}^{-1/3}k^{-5/3}{\it\Psi}_{{\it\theta}}(k/L_{BO}),\end{eqnarray}$$
where
 ${\it\epsilon}_{{\it\theta}}={\it\kappa}\langle \boldsymbol{{\rm\nabla}}{\it\theta}^{2}\rangle$
is the temperature dissipation, and
 ${\it\Psi}_{i}$
are appropriate universal functions. For isotropic turbulence
 ${\it\Psi}_{i}\sim 1$
and the scalings reduce to
 $E_{u}(k)\sim k^{-5/3}$
,
 $E_{{\it\theta}}(k)\sim k^{-5/3}$
. It is worth emphasizing that these scalings are local, and thus typically apply to Eulerian measurements. Assuming a Lagrangian perspective, these scalings are influenced by sweeping and become
 $E_{u}(f)\sim f^{-2}$
,
 $E_{{\it\theta}}(f)\sim f^{-2}$
, in a local moving frame of reference, as it can be found by dimensional arguments (Monin & Yaglom Reference Monin and Yaglom2007). In non-homogeneous flows the situation is even more complex, since multiple scales can play a role and different scalings can be observed. Possible scalings above the Bolgiano–Obukhov length are
 $$\begin{eqnarray}E_{u}(k)\sim {\it\epsilon}_{{\it\theta}}^{2/5}(g{\it\alpha})^{4/5}k^{-11/5},\quad E_{{\it\theta}}(k)\sim {\it\epsilon}_{{\it\theta}}^{4/5}(g{\it\alpha})^{-2/5}k^{-7/5}.\end{eqnarray}$$
These scalings have been recently observed in Rayleigh–Taylor turbulence (Boffetta et al. Reference Boffetta, Mazzino, Musacchio and Vozella2009), upon assumption of a correspondence between the box length in the horizontal direction and the Bolgiano length (which is otherwise a priori unknown).
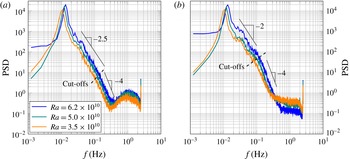
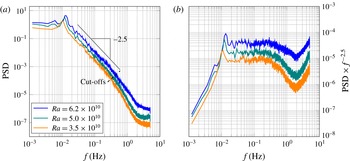
Figures 11(a,b) and 12(a) show the frequency spectra (for 6-h acquisitions) of horizontal velocity, vertical velocity and temperature, respectively. We observe three distinctive characteristics. First, a peak appears at a frequency
 $f\simeq 1.25\times 10^{-2}$
Hz (80 s), which is consistent with the typical large-scale turnover time for each Rayleigh number. Yet, when
 $Ra$
increases, the spectrum shifts upwards, indicating a more intense dynamics. Finally, a cut-off occurs at
 $f\simeq 0.15$
Hz for vertical velocity and at
 $f\simeq 0.5$
Hz for temperature, whereas the cut-off is less visible for the horizontal velocity. These cut-offs are probably due to finite-size effect. We could estimate the cut-off frequency as the turbulence timescale (obtained dimensionally) at the particle size
 $t_{c-o}\sim d_{p}^{2/3}{\it\epsilon}^{-1/3}$
. It leads to a cut-off frequency of about 0.2 Hz which is consistent with the observed one. For the temperature, the cut-off appears for a higher frequency because of the lower size of the sensors.
(a) Horizontal and (b) vertical velocity spectra at different Rayleigh numbers.

(a) Temperature spectra at different Rayleigh numbers. (b) Same temperature spectra compensated by
 $f^{-2.5}$
.

From the proposed scaling laws (lines in figures 11 and 12) we note some interesting features. A
 $f^{-2}$
power law characterizes the vertical velocity, whereas a
 $f^{-2.5}$
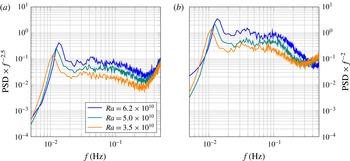
power law characterizes the horizontal velocity. Compensated spectra (by
 $f^{-2}$
and by
 $f^{-2.5}$
) are also shown to indicate the scaling properties in a more convincing way, in figure 13. In particular, the plateau and the cut-off become well visible and define clearly the inertial range for both components. It is important to note here that, even though compensated spectra appear rather convincing, the scaling exponents should not be considered as exact because of statistical errors and possible lack of resolution. A similar flow anisotropy has been also observed by Ouellette et al. (Reference Ouellette, Xu, Bourgoin and Bodenschatz2006) in a Von-Kármán flow. From the above observations, we can infer the following physical interpretation. The particle has a large vertical velocity when it enters hot and cold jets along the lateral walls, whereas it has a large horizontal velocity when it is driven by the mean wind along the top and bottom walls. Since the hot and cold jets are characterized by more intense fluctuations, the corresponding spectra have a weaker slope. Upon substitution of
 $k=f/u$
in (5.2), we obtain the Bolgiano scaling
 $E_{u}(f)\sim f^{-11/5}$
, in which the frequency
 $f$
describes the global dynamics observed from a fixed frame. Note that this scaling is different from that obtained in a frame moving with the fluid. In this case, from dimensional arguments, we find
 $E_{u}(f)\sim f^{-4}$
. This indicates that the velocity scalings (
 $f^{-2}$
and
 $f^{-2.5}$
) observed at large scale are reasonably consistent with the Bolgiano global scaling. After the cut-off, a
 $f^{-4}$
power law appears for both spectra, which is consistent to the stochastic model of Sawford (Reference Sawford1991). Concerning the temperature spectra, we observe a
 $f^{-2.5}$
power law with very visible plateaus on the compensated spectra figure 12(b). Note that due to the anisotropic and inhomogeneous flow condition we do not find a
 $f^{-2}$
slope, as expected for a passive scalar in local isotropy conditions. Yet, temperature cannot be considered as a pure passive scalar, in particular inside hot and cold jets. Unfortunately, at present we do not have a quantitative explanation for this power law. It probably stems from the mixing of different scalings due to the Lagrangian measurements. Results from numerical simulations (not shown here) differ from the present experimental results due to the different flow configuration: our simulations are run in a domain with top and bottom walls but no side walls, whereas experiments are run in a square enclosure. The absence of a characteristic confinement length in the simulations hinders the possibility of observing a clear scaling at large scales.
(a) Horizontal and (b) vertical velocity spectra compensated by
 $f^{-2.5}$
and
 $f^{-2}$
, respectively, for different Rayleigh numbers.

6 Conclusion
In this work, we have used an improved version of our smart particle to perform new experimental measurements in Rayleigh–Bénard convection at different Rayleigh numbers (up to
 $Ra=6.2\times 10^{10}$
). To corroborate the experiments and isolate possible finite-size effects, we have also carried out DNS of Rayleigh–Bénard turbulence with Lagrangian tracking of massless tracers.
In the experiments, due to the extended autonomy of the particle, we are able to sample velocity and temperature at the particle position for long periods of time, up to 20 h. This long data recording allows not only to acquire long time series describing the temporal evolution of a turbulent flow, but also to build pseudo-Eulerian maps of the flow field and to compute converged PDF and spectra. The particle trajectory is driven by the interaction between the mean large-scale circulation (along the horizontal walls) and the thermal plumes generating vertical hot and cold jets. Velocity and temperature fluctuations are essentially concentrated in the bottom-right and top-left corners, and denotes strong turbulence events in these regions.
Upon comparison between experimental and numerical results, we are able to demonstrate the accuracy of our experimental technique in recovering all of the fundamental statistical features of the flow. The same comparison allows a quantification of the finite-size effect of the smart particle, which acts filtering out the smallest turbulent scales. This can be appreciated by comparing the tails of the pdf of velocity/temperature fluctuations. Yet, simulations and experiments agree on the description of the large scales of the flow.
We finally computed velocity and temperature frequency spectra. Interestingly, horizontal and vertical velocity spectra exhibit different scaling (
 $f^{-2.5}$
and
 $f^{-2}$
, respectively), as a consequence of the strong flow anisotropy in the vertical and horizontal directions. For temperature, we observe a steep
 $f^{-2.5}$
scaling, likely representing the hybrid passive and active scalar behaviour of temperature.
A further study of these observations will be the subject of a future paper. As the flow is dominated by a mean vortical structure, we can remove it from the recorded signal to study the behaviour of turbulence fluctuations and the interactions between fluctuations and mean structure along the line proposed by Machicoane & Volk (Reference Machicoane and Volk2016) for Von-Kármán flows.
Acknowledgements
We thank D. Le Tourneau and M. Moulin for the manufacture of the cell. We thank also M. Tanase for his major support about the electronic device of the particle. We are also grateful to the smartINST company for their collaboration. We acknowledge É. Rusaoüen, R. Volk and M. Bourgoin are also gratefully acknowledged for fruitful discussions. PIV measurements were made possible with the help of PSMN computing resources.