Introduction
It has long been established that, at broad scales, the spatial distributions of species are related to climate (Holdridge Reference Holdridge1947; Whittaker Reference Whittaker1975) and that distributions are dynamic, changing over time in response to climate variability (Tallis Reference Tallis1991; Webb & Bartlein Reference Webb and Bartlein1992). Consequently, given the rate and magnitude of human-induced climate change (Williams et al. Reference Williams, Jackson and Kutzbach2007; Diffenbaugh & Field Reference Diffenbaugh and Field2013), species distributions are changing now (Parmesan & Yohe Reference Parmesan and Yohe2003; Lenoir et al. Reference Lenoir, Gégout, Marquet, de Ruffray and Brisse2008; Chen et al. Reference Chen, Hill, Ohlemüller, Roy and Thomas2011) and are expected to continue to change significantly over future decades and centuries (Thuiller et al. Reference Thuiller, Lavorel, Araújo, Sykes and Prentice2005, Reference Thuiller, Lavorel, Sykes and Araújo2006; McKenney et al. Reference McKenney, Pedlar, Lawrence, Campbell and Hutchinson2007). Consistent with this accumulating knowledge, there has been a rapid increase in evidence that supports the response of lichens to future climate change (e.g. Ellis et al. Reference Ellis, Coppins and Dawson2007a, Reference Ellis, Coppins, Dawson and Seawardb, Reference Ellis, Eaton, Theodoropoulos, Coppins, Seaward and Simkin2014; Binder & Ellis Reference Binder and Ellis2008; Allen & Lendemer Reference Allen and Lendemer2016; Nascimbene et al. Reference Nascimbene, Casazza, Benesperi, Catalano, Cataldo, Grillo, Isocrono, Matteucci, Ongaro and Potenza2016; Fačkovcová et al. Reference Fačkovcová, Senko, Svitok and Guttová2017; Rubio-Salcedo et al. Reference Rubio-Salcedo, Psomas, Prieto, Zimmermann and Martínez2017; Devkota et al. Reference Devkota, Dymytrova, Chaudhary, Werth and Scheidegger2019).
The broad scale projected response of lichen distributions to climate change, for a given region, for a given climate change pathway (Nakićenović & Swart Reference Nakićenović and Swart2000; Moss et al. Reference Moss, Edmonds, Hibbard, Manning, Rose, van Vuuren, Carter, Emori, Kainuma and Kram2010; van Vuuren & Carter Reference van Vuuren and Carter2014), and over a given timescale, can be characterized as the species ‘exposure’ (Ellis Reference Ellis2013), that is the degree to which the climate will become more or less suitable. Exposure is widely estimated using the bioclimatic technique of matching a species distribution to the macroclimate in which it occurs, and quantifying the loss or spatial shift in suitable climate space (Pearson & Dawson Reference Pearson and Dawson2003; Thomas et al. Reference Thomas, Cameron, Green, Bakkenes, Beaumont, Collingham, Erasmus, de Siqueira, Grainger and Hannah2004), an approach that can be used to assess climate change risk for lichens (Ellis Reference Ellis2019a). While quantifying the species exposure to climate change may be a useful first step in assessing risk, the future outcome for a species depends, critically, on its ‘vulnerability’ (Ellis Reference Ellis2013).
Vulnerability characterizes the species' ability to respond to climate change; for lichens this includes migration to track suitable climate space (Lättman et al. Reference Lättman, Lindblom, Mattson, Milberg, Skage and Ekman2009; Ronnås et al. Reference Ronnås, Werth, Ovaskainen, Várkonyi, Scheidegger and Snäll2017), acclimation through phenotypic plasticity, as evidenced by increased specific thallus mass in drier habitats (Gauslaa et al. Reference Gauslaa, Lie, Solhaug and Ohlson2006, Reference Gauslaa, Palmqvist, Solhaug, Holien, Nybakken and Ohlson2009; Gauslaa & Coxson Reference Gauslaa and Coxson2011; Merinero et al. Reference Merinero, Hilmo and Gauslaa2014), or potential for algal switching that optimizes fitness (Yahr et al. Reference Yahr, Vilgalys and DePriest2006; Fernández-Mendoza et al. Reference Fernández-Mendoza, Domaschke, García, Jordan, Martín and Printzen2011; Domaschke et al. Reference Domaschke, Vivas, Sancho and Printzen2013), as well as evolutionary adaptation (Murtagh et al. Reference Murtagh, Dyer, Furneaux and Crittenden2002). Lichen vulnerability will therefore depend on the match between the species biology and its landscape context, such as whether it is niche specialist or dispersal limited and occurs within a more or less fragmented habitat (Ellis Reference Ellis2015; Ellis & Eaton Reference Ellis and Eaton2018). The requirement of conservationists to act, in order to mitigate vulnerability factors, will generally scale with the species exposure to future climate change, while the understanding of vulnerability presents the positive opportunity to take climate change action at a local scale. Thus, a species' vulnerability might be proactively reduced through landscape management, such as by creating habitat stepping-stones or corridors to facilitate climate change migration (e.g. Schwartz Reference Schwartz1993; Collingham & Huntley Reference Collingham and Huntley2000; Travis Reference Travis2003). An additional important opportunity to reduce vulnerability is through habitat heterogeneity, and specifically, ensuring that a sufficient range of microclimatic niche space is maintained within a landscape.
It is already established that for topographically complex habitats, such as montane systems, local variability in climatic factors such as temperature replicate over small scales the regional trends that are measured and interpolated at larger scales (Scherrer & Körner Reference Scherrer and Körner2010, Reference Scherrer and Körner2011; Scherrer et al. Reference Scherrer, Schmid and Körner2011). This local microclimatic variability creates a mosaic of potential microrefugia (Rull Reference Rull2009; Dobrowski Reference Dobrowski2010) that could maintain within short distances suitable climatic conditions even as the macroclimate changes. It follows that the migration rates required to track changing climates are reduced in topographically complex environments, where species can exploit the varied local microrefugia, compared to more uniform landscapes (Loarie et al. Reference Loarie, Duffy, Hamilton, Asner, Field and Ackerly2009; Brito-Morales et al. Reference Brito-Morales, Molinos, Schoeman, Burrows, Poloczanska, Brown, Simon Ferrier, Harwood, Klein and McDonald-Madden2018). In a similar vein, the forest or woodland is a topographically complex system of interacting gradients including light, moisture and temperature (Chen & Franklin Reference Chen and Franklin1997; Parker Reference Parker1997), to which bryophyte and lichen epiphytes respond (McCune et al. Reference McCune, Amsberry, Camacho, Clery, Cole, Emerson, Felder, French, Greene and Harris1997b; Lyons et al. Reference Lyons, Nadkarni and North2000; McCune et al. Reference McCune, Rosentreter, Ponzetti and Shaw2000). A key question, therefore, is how a forester might optimally manage a forest or woodland to maximize microclimatic heterogeneity that will operate as microrefugia in reducing climate change vulnerability. Is there a particular set of forest or woodland features that one might focus on, for example, in order to most effectively reduce climate change vulnerability?
To answer this question, we compared the community composition of bryophyte and lichen epiphytes to a large-scale climate gradient, using fuzzy set ordination (Roberts Reference Roberts1986, Reference Roberts2008). As a form of direct gradient analysis, community samples are positioned along axes to provide an optimized estimate of the expected climate given the species composition; residuals can then be defined through comparison with the observed climate. For example, positive residuals could be communities that appear to have a species composition more reflective of warmer/wetter conditions than might be expected given the larger scale climate, with negative residuals having the converse. Residuals were therefore tested against two sets of predictor variables using multimodel inference (Grueber et al. Reference Grueber, Nakagawa, Laws and Jamieson2011; Symonds & Moussalli Reference Symonds and Moussalli2011). First, residuals were compared to features that determine the physical microclimate of moisture-temperature-light at landscape, stand and tree-scales, while including tree species and tree age as compound variables known to affect epiphyte community composition (Kuusinen Reference Kuusinen1996; Jüriado et al. Reference Jüriado, Liira, Paal and Suija2009; Mežaka et al. Reference Mežaka, Brūmelis and Piterāns2012). Second, to explore proximal effects nested within tree species and tree age, these were accompanied, in their explanation of residuals, by microhabitat properties including bark chemistry, texture and water holding capacity.
It was thus possible to estimate the woodland features, at different scales, that have the greatest apparent control over microclimatic variability, and which account for epiphyte community composition. Since the majority of epiphytes on which the analysis was based were lichens, these structures can be prioritized in forest management when aiming to reduce the climate change vulnerability of lichen epiphytes.
Materials and Methods
Field sampling and datasets
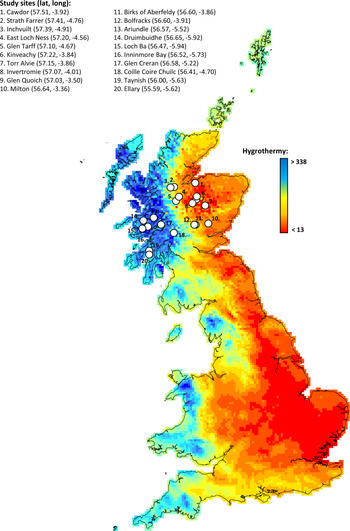
Our analysis used species and environmental data that were previously sampled in a systematic survey of bryophyte, lichen and vascular plant epiphyte communities in Scotland (see Ellis et al. (Reference Ellis, Eaton, Theodoropoulos and Elliott2015a) for method details, summarized here). The survey recorded frequency of occurrence for a total of 376 epiphytes (80% lichens) sampled from 1013 quadrats across 250 trees occurring in 20 sites, which were protected ancient woodlands in a relatively clean-air region of northern Scotland (Fig. 1). Sites were positioned across a steep climatic gradient from the oceanic west to more continental eastern Scotland. Trees were located at equidistant points distributed within sites, aiming to sample a representative range of tree species and ages, with a minimum of four quadrats sampled from each tree bole, at cardinal aspects, for a random height of between 30 and 200 cm above the ground. Quadrats were accompanied by data for 35 environmental variables, which were selected because a literature review (Ellis Reference Ellis2012) had shown them to be important in explaining epiphyte community structure. Furthermore, in its original analysis the dataset was reduced to only those species occurring in ≥ 15 quadrats, before hierarchical clustering was combined with Indicator Species Analysis (Dufrêne & Legendre Reference Dufrêne and Legendre1997; McCune & Grace Reference McCune and Grace2002) to identify 15 statistically significant community types, matching these to phytosociological communities identified by Barkman (Reference Barkman1958) and James et al. (Reference James, Hawksworth, Rose and Seaward1977), and with subsequent interpretation of environmental controls using nonparametric multiplicative regression (McCune Reference McCune2006, Reference McCune2011). These are referred to here as ‘Community Types’ (Table 1).
Twenty study sites aligned along a hygrothermy gradient (see Eq. 1; oceanic-to-continental climates: Ellis Reference Ellis2016), from a relatively clean-air region spanning western to north-eastern Scotland; sites were ancient woodland stands designated within the European and UK nature conservation networks (Special Areas of Conservation, Sites of Special Scientific Interest).

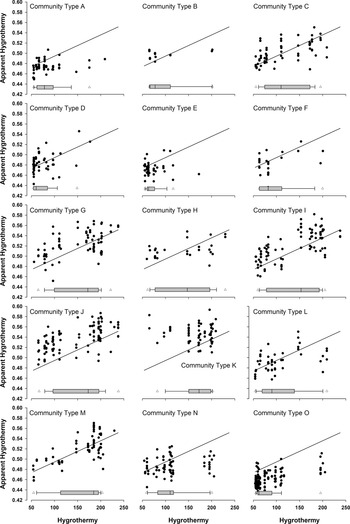
Epiphyte Community Types identified by Ellis et al. (Reference Ellis, Eaton, Theodoropoulos and Elliott2015a) and plotted into Fig. 2 to compare apparent and observed hygrothermy. Community Types are cross-referenced with previous synecological classifications (Barkman Reference Barkman1958; James et al. Reference James, Hawksworth, Rose and Seaward1977); nomenclature follows (Smith et al. Reference Smith, Aptroot, Coppins, Fletcher, Gilbert, James and Wolseley2009). Communities with weak levels of support are indicated by ‘!’, and cryptic species that remained undifferentiated (for example, Parmelia saxatilis: Molina et al. Reference Molina, Crespo, Blanco, Lumbsch and Hawksworth2004; Corsie et al. Reference Corsie, Harrold and Yahr2019) are noted as aggregates.

The current analysis treated the epiphyte community data slightly differently. First, considering the importance of tree species identity in the explanation of epiphyte communities (Kuusinen Reference Kuusinen1996; Jüriado et al. Reference Jüriado, Liira, Paal and Suija2009; Mežaka et al. Reference Mežaka, Brūmelis and Piterāns2012), tree species with low sample replication (n ≤ 4) were excluded a priori: Craetagus monogyna (4 trees, 16 quadrats), Fagus sylvatica (1 tree, 4 quadrats), Ilex aquilifolium (2 trees, 8 quadrats), Juniperus communis (2 trees, 8 quadrats) and Ulmus glabra (4 trees, 16 quadrats). Second, while the original dataset included species abundance data, this was converted to presence-absence. Excluding epiphyte species with ≤ 4 occurrences, the final community matrix for analysis included 208 species and 949 quadrats. Third, the original environmental data (35 variables) were sub-selected to target features relevant to physical microclimate and excluded, for example, landscape-scale spatial metrics such as woodland connectivity at 1–10 km scales.
Fuzzy set ordination
Each of the sites was assigned a value of hygrothermy (Seaward Reference Seaward1975), which has been used as a key measure in the gradient from oceanic to continental climates in Britain (Ellis Reference Ellis2016) and is calculated as follows:
 $$H = [{\lpar {{\rm P} \times {\rm T}} \rpar / \lpar {{\rm t}_{\rm h}-{\rm t}_{\rm c}} \rpar }] $$
where P is the mean annual precipitation (cm), T is the mean annual temperature, and th and tc are the mean temperatures of the warmest and coldest months, respectively. Values of hygrothermy were calculated using the UK Met Office interpolation of instrumental climate records at a 1 km grid-scale, averaged for the period 1981–2010 (Hollis et al. Reference Hollis, McCarthy, Kendon, Legg and Simpson2019).
Fuzzy set ordination (Roberts Reference Roberts1986, Reference Roberts2008; Boyce & Ellison Reference Boyce and Ellison2001) was performed using the R package ‘fso’ (Roberts Reference Roberts2018), applying a pairwise distance matrix calculated among quadrats using Sørensen's index. Community structure was summarized using hygrothermy as a constraint, and statistical significance of the ordination was tested using 10 000 permutations. To visualize the community response, the apparent hygrothermy, estimated from the community composition, was plotted against observed hygrothermy, while separately coding the epiphyte Community Types.
Multimodel inference
Residuals calculated from a linear relationship between the apparent and observed hygrothermy (see Fuzzy set ordination, above) were used as the response in a generalized linear mixed model (GLMM: Pinheiro & Bates Reference Pinheiro and Bates2000; Zuur et al. Reference Zuur, Ieno, Walker, Saveliev and Smith2009), with a Gaussian error structure and with site and tree identity as nested random effects. The GLMM was implemented using the ‘nlme’ package in R (Pinheiro et al. Reference Pinheiro, Bates, DebRoy, Sarkar and Core Team2020), with maximum likelihood (ML) for model inter-comparison. Fixed effects (predictor variables, thirteen in total, Table 2) were features expected to determine the physical microclimate of moisture-temperature-light defined at: 1) landscape scale including altitude above sea level, physical exposure related to wind speeds (detailed aspect method of scoring (DAMS) (Quine & White Reference Quine and White1994; Suárez et al. Reference Suárez, Gardiner and Quine1999)), an index of topographic wetness (Beven & Kirkby (Reference Beven and Kirkby1979), calculated using the D8 algorithm in ArcMap v.10 (ESRI, Redlands, California) and based on the UK Ordnance Survey digital terrain model at a 50 m resolution) and watercourse distance measured from the nearest running and still water; 2) stand scale including a heatload index (based on latitude, aspect and slope (McCune & Keon Reference McCune and Keon2002; McCune Reference McCune2007)), a measure of tree density as basal area (calculated using the five trees closest to the sampled tree) and canopy openness (measured using a densiometer (Lemmon Reference Lemmon1956; Englund et al. Reference Englund, O'Brien and Clark2000; Paletto & Tosi Reference Paletto and Tosi2009)); 3) tree scale representing the angle of tree lean, the aspect on the tree bole, and the height on the tree bole. Tree species, and tree age determined by dendrochronology, were included as compound variables that are known to affect epiphyte community composition (Kuusinen Reference Kuusinen1996; Jüriado et al. Reference Jüriado, Liira, Paal and Suija2009; Mežaka et al. Reference Mežaka, Brūmelis and Piterāns2012).
Fixed effect coefficients for thirteen predictor variables (including their range and mean values, with age values for individual tree species) expected to determine the physical microclimate of moisture-temperature-light for epiphytic communities; coefficients derived from multimodel averaging and ordered according to their cumulative Akaike weights for a subset of models achieving a threshold ≥ 0.95 (Fig. 3).

Using a framework of multimodel inference and averaging (Grueber et al. Reference Grueber, Nakagawa, Laws and Jamieson2011; Symonds & Moussalli Reference Symonds and Moussalli2011), GLMM models were first constructed for all possible subsets of the 13 predictor variables, using the ‘MuMIn’ package in R (Bartón Reference Bartón2019). Models were ranked by their scores for corrected Akaike's Information Criterion (AICc) and their Akaike weight, which calculates the probability that a given model is the best at approximating the data. Akaike weights were then summed, proceeding cumulatively from the model with the lowest AICc, until the summed weights were ≥ 0.95; this identified a subset of models which would contain the best approximating model at 95% confidence. The importance of predictor variables was estimated by summing the Akaike weights for each of the models within which the variable occurs (that is the probability that a given variable will be a component of the best approximating model). Finally, models within the subset were re-evaluated using restricted maximum likelihood (REML), and model averaging was used to provide parameter estimates of the fixed effects (predictor variables) using full model averaging based on the Akaike weights.
Second, GLMM models were constructed with tree species and age included as compound variables, and then including the three proximal variables of bark texture (furrow depth, mm), bark pH, and bark water holding capacity (g H2O, per g bark dry weight). For pH, bark was cleaned of debris, oven-dried to constant weight (30 °C) and fragments soaked for 12 h in distilled water at a ratio of 0.1 g bark to 20 ml water; the pH of the water was measured. Water capacity was the difference between an oven dry and saturated bark sample weight. Multimodel inference was performed for this subset of predictor variables, as described above. The relationship between the proximal and compound variables was further examined using multiple linear regression with each of the proximal variables as a response, and tree species, tree age and their interaction as fixed effects (predictor variables). The initial full model was simplified using forward and backward selection to minimize the Akaike's Information Criterion.
Results
Fuzzy set ordination provided a statistically significant explanation of epiphyte community composition with respect to hygrothermy: r = 0.683, P < 0.0001 for 10 000 permutations. The distribution of quadrat samples was therefore related to hygrothermy in a way that partitioned among contrasting epiphyte Community Types (cf. Fig. 2 and Table 1). For example, Community Type D (Phlyctis argena-Ramalina farinacea) tended to occur in relatively continental climates with lower hygrothermy (mean hygrothermy value = 73), and Community Type M (Hypotrachyna laevigata-Loxospora elatina) in more oceanic climates with higher hygrothermy (mean hygrothermy value = 156).
Comparison of observed and apparent hygrothermy for epiphyte Community Types, estimated using fuzzy set ordination and plotted as a regression line. Individual graphs show the occurrence of a given epiphyte Community Type (Table 1), previously identified by Ellis et al. (Reference Ellis, Eaton, Theodoropoulos and Elliott2015a) and broadly consistent with James et al. (Reference James, Hawksworth, Rose and Seaward1977). The position of each Community Type with respect to the observed hygrothermy is plotted as a boxplot showing median (line), 25th–7th percentiles (boxes), 10th and 90th percentiles (whiskers) and 5th and 95th percentiles (open triangles). The relationship of the Community Types (closed circles) to the regression line shows their skewness to positive or negative residuals with respect to the observed hygrothermy.

However, it was apparent that the relationship between apparent hygrothermy, estimated from community composition, and observed hygrothermy had structured residuals. For example, the distributions of the ‘Lobarion’ Community Type G (Lobaria virens-Normandina pulchella-Metzgeria furcata) and Type K (Lobaria pulmonaria-Isothecium myosuroides) were skewed towards more oceanic climates with higher hygrothermy but occurred in relatively more continental climates as positive residuals, inferred as locally wetter/warmer microhabitats. Contrastingly, the distributions of Community Type A (Arthonia radiata-Lecidella elaeochroma) and Type N (Mycoblastus sanguinarius-Protoparmelia ochrococca-Sphaerophorus globosus) were skewed towards relatively more continental climates, but occurred in more oceanic climates as negative residuals, inferred to be locally drier/cooler microhabitats. Community Type O (Bryoria fuscescens-Ochrolechia microstictoides-Parmeliopsis hyperopta) occurred in locally drier/cooler microhabitats (negative residuals) even for relatively more continental climates (in the context of northern Britain), and with limited occurrence as increasingly negative residuals in more oceanic climates.
The fuzzy set ordination therefore supports a general trend in epiphyte community composition that transitions across a regional gradient from an oceanic to a relatively more continental climate (Fig. 1), but with variance in this pattern that, from the observation of hygrothermy residuals, can be explained by the occurrence of more oceanic or continental Community Types than might be expected for a given macroclimatic setting (Fig. 2). The subsequent hypothesis is that these anomalous Community Types can be explained by locally wetter/warmer, or drier/cooler microhabitats, caused by a combination of landscape, stand or tree-scale effects that create the microclimate.
To gain an understanding of which landscape, stand or tree-scale effects might be important in creating the local microclimates that shape epiphyte community composition, 13 predictor variables were tested using all-subsets multimodel inference. There were 8192 candidate subset models (213) and, when ranked by AICc, 685 of these (8%) generated the cumulative Akaike weight threshold ≥ 0.95. All of the predictor variables were included in at least one of these models (Fig. 3A); summing the Akaike weights for the models within which a given predictor occurred, suggested that the most important effects were likely to be tree-scale (bole lean and height on the bole), compound variables (tree species and tree age), followed by two landscape-scale effects (topographic wetness index and physical exposure of a site).
Rank order of thirteen fixed effects (predictor variables) to explain hygrothermy residuals (shown in Fig. 2 for individual Community Types) using GLMM; cumulative AICc weights were calculated for models generating an Akaike weight threshold ≥ 0.95. A, showing landscape, stand and tree-scale effects with tree species and age as compound variables. B, showing the additional effect of proximal variables (bark pH, furrow depth and bark water holding capacity) considered in addition to tree species and age.

Subsequent model-averaging (Table 2) provided a framework from which hygrothermy residuals (locally wetter/warmer, or drier/cooler microhabitats) could be predicted and installed into a given macroclimate (hygrothermy) through woodland management. Positive residuals (wetter/warmer microhabitats) were associated with increasing angle of bole lean (uppermost aspect) and proximity to the ground, increasing topographic wetness and decreasing physical exposure, and for the compound variables, increasing tree age with the presence of certain trees, notably ash (Fraxinus excelsior), aspen (Populus tremula) and rowan (Sorbus aucuparia).
A second test using multimodel inference explored the proximal effects of bark pH, furrow depth and water holding capacity, and their role in complementing or improving on the compound effects of tree species and tree age. There were 32 candidate subset models (25) and, when ranked by AICc, 6 of these (19%) generated the cumulative Akaike weight threshold ≥ 0.95. All of the predictor variables were included in at least one of these models (Fig. 3B); summing the Akaike weights for the models within which a given predictor occurred, suggested that the most important proximal effect was bark water holding capacity, while the compound effects of tree species and tree age remain relevant and were not substituted by bark pH or bark furrow depth. Model averaging indicated that increased water holding capacity was associated with positive residuals (wetter/warmer microhabitats), with an estimated parameter value of 0.08887 ± 0.02893 (z = 3.067, P = 0.00216).
To further investigate these relationships, proximal effects were explained by tree species and tree age using multiple linear regression. Full models (tree species, age and interaction) were retained for bark pH and furrow depth, with the interaction term dropped for bark water holding capacity. There were stronger relationships between tree species/age and bark pH (adj-R2 = 0.19, P < 0.0001 with 931 df) and furrow depth (adj-R2 = 0.43, P < 0.0001 with 931 df) than for bark water holding capacity (adj-R2 = 0.08, P < 0.0001 with 931 df), and this accords with how these proximal variables are selected into the multimodel framework, alongside tree species and age (Fig. 3B). For bark pH, there was a relationship with tree age that varied depending on tree species (Table 3); Fraxinus excelsior and Populus tremula on average tended to have higher pH than other trees. For furrow depth, Pinus sylvestris tended to have deeper bark furrows on average, while there was a strong effect of age across all tree species, though this age-dependent relationship appeared different from other trees for Populus tremula (Table 3). For bark water holding capacity, Betula spp. tended to have lower water holding capacity on average, with Fraxinus excelsior having a higher capacity, and in general water holding capacity declined with tree age (Table 3).
Regression analysis to estimate how proximal microhabitat effects can be explained by the compound effects of tree species and tree age.

Discussion
Forest and woodland managers are challenged to find locally relevant actions that mitigate the negative effects of global climate change (Ogden & Innes Reference Ogden and Innes2007; Keenan Reference Keenan2015; Sousa-Silva et al. Reference Sousa-Silva, Verbist, Lomba, Valent, Suškevičs, Picard, Hoogstra-Klein, Cosofret, Bouriaud and Quentin Ponette2018). Focusing on the conservation of forest/woodland biodiversity, bioclimatic studies have demonstrated the threat to lichen epiphytes of climate change (Ellis Reference Ellis2019a, references therein); this threat is relevant from the standpoint of both species protection (Nitare Reference Nitare2000; Nilsson et al. Reference Nilsson, Hedin and Niklasson2001) and in maintaining the resilience of ecosystem functions and services (Jönsson et al. Reference Jönsson, Ruete, Kellner, Gunnarsson and Snäll2017). There is therefore a pressing need to identify relevant local actions that can reduce the vulnerability of lichen epiphytes to global climate change. These actions start to emerge from our results and are explored below with particular reference to lichen epiphytes in oceanic temperate rainforest, a case study that is relevant globally (Alaback Reference Alaback1991; DellaSala Reference DellaSala2011) and which represents a threatened habitat in Europe, including within our study region (Scotland).
Our results demonstrated a significant relationship between lichen epiphyte distributions (patterned as Community Types) and large-scale climate trends, from oceanic to relatively more continental, using hygrothermy as a proxy (Seaward Reference Seaward1975; Ellis Reference Ellis2016). The gradients within our study region spanned the range 3155 to 828 mm precipitation per year, with minimum mean winter temperatures from −2.7 to 2.1 °C. Although consistent with previous work demonstrating a large-scale climate effect on lichen distributions (McCune et al. Reference McCune, Daey, Peck, Heiman and Will-Wolf1997a; Werth et al. Reference Werth, Tømmervik and Elvebakk2005; Giordani Reference Giordani2006) we were able to identify epiphyte Community Types that were anomalous, either more ‘oceanic’ or more ‘continental’ than expected for a given macroclimate. We subsequently tested the effect of landscape, stand and tree-scale factors in explaining these residuals.
Based on an exploratory approach using multimodel inference (Grueber et al. Reference Grueber, Nakagawa, Laws and Jamieson2011; Symonds & Moussalli Reference Symonds and Moussalli2011), we propose that the important features explaining climate residuals can be split into four categories: landscape, tree type/age, micro-topography and substratum-moisture. The application of these categories has two caveats. First, we assume that blanket negative effects such as air pollution (Hawksworth & Rose Reference Hawksworth and Rose1970; van Herk et al. Reference van Herk, Mathijssen-Spiekman and de Zwart2003; Geiser & Neitlich Reference Geiser and Neitlich2007) or the spread of aggressively invasive species (e.g. Rhododendron ponticum: Usher Reference Usher1986; Coppins & Coppins Reference Coppins and Coppins2005) would be addressed as priorities, since these would undermine any local actions emerging from this study. Second, we caution that the estimated importance of different predictor variables (Fig. 3) is conditional on the sampling design, and any implicit bias. This may explain, for example, the apparent weak effect of tree density and/or canopy cover. Lichen epiphyte species (Gauslaa et al. Reference Gauslaa, Lie, Solhaug and Ohlson2006, Reference Gauslaa, Palmqvist, Solhaug, Holien, Hilmo, Nybakken, Myhre and Ohlson2007; Coxson & Stevenson Reference Coxson and Stevenson2007) and community composition and diversity, are known to be sensitive to canopy cover (McCune & Antos Reference McCune and Antos1982; Leppik & Jüriado Reference Leppik and Jüriado2008; Marmor et al. Reference Marmor, Tõrra, Saag and Randlane2012), while secondary regeneration (increasing both tree density and canopy cover) can negatively impact lichen epiphytes (Leppik et al. Reference Leppik, Jüriado and Liira2011; Paltto et al. Reference Paltto, Nordberg, Nordén and Snäll2011). The focus of our sampling in ancient semi-natural woodlands might, however, have normalized tree density and canopy cover values, by focusing only on a relatively gladed structure compared to a wider range of conditions pertaining to forest/woodland across the landscape. Recommendations emerging from this study should be framed within this environmental context (Table 2) and extrapolated cautiously. With these caveats in mind, we consider how the results are relevant to two starting points in forest/woodland conservation: existing and new woodland stands.
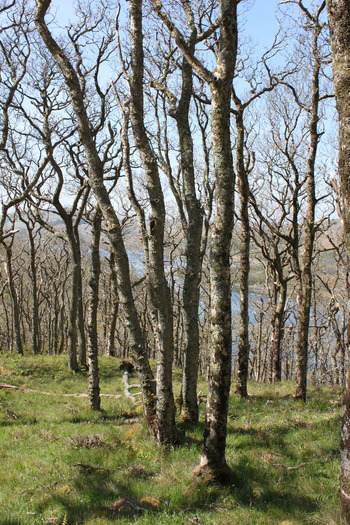
Existing woodland stands are already positioned within a landscape and the factors of tree type/age and micro-topography are relevant to their management. For example, remnant woodlands in Europe have been widely used in the past as a resource (Rackham Reference Rackham2003, Reference Rackham2006) and have undergone a process of simplification. Atlantic oakwoods, which are an archetype for Europe's oceanic temperate rainforest (Baarda Reference Baarda2005; Bain Reference Bain2015), provide examples of this simplified woodland structure, with 19th century coppicing for charcoal and bark tannin (Smout Reference Smout2005; Smout et al. Reference Smout, MacDonald and Watson2007) often resulting in the present-day pattern of similarly spaced and even-aged oak trees (Fig. 4). If a management goal is to reduce the climate change vulnerability of rainforest epiphytes, by increasing their opportunity to exploit local microclimates ≈ microrefugia (see Introduction), then two recommendations emerge that are relevant to these simplified woodland structures.
A landscape of straight-grown, even-aged oak trees in Scotland's oceanic rainforest zone (Taynish NNR, Argyll); characteristic of 19th century coppice management.

First, with respect to micro-topography, the height on the bole creates a gradient in moisture that affects individual lichen species (Antoine & McCune Reference Antoine and McCune2004; Merinero et al. Reference Merinero, Martínez, Rubio-Salcedo and Gauslaa2015) and epiphyte communities (Kenkel & Bradfield Reference Kenkel and Bradfield1986; Bates Reference Bates1992; McCune et al. Reference McCune, Rosentreter, Ponzetti and Shaw2000), but which is normalized across trees, that is a majority of trees can be considered as incorporating this gradient! However, angle of lean creates a similar and interacting effect (Kenkel & Bradfield Reference Kenkel and Bradfield1986; Bates Reference Bates1992; McCune et al. Reference McCune, Rosentreter, Ponzetti and Shaw2000; Doering & Coxson Reference Doering and Coxson2010) and for woodlands with a predominant structure of straight grown trees (Fig. 4) there may be opportunity to create or preferentially retain a proportion of boles that are leaning to various degrees, in order to increase microhabitat diversity. Second, it may also be possible to increase the diversity of tree species and maximize tree ages. These are compound variables that do not necessarily determine the microclimate per se, but which nevertheless facilitate lichen species outside of their climate optima, substituting for proximal effects such as bark pH and furrow depth. For example, different tree species have contrasting bark pH (Kuusinen Reference Kuusinen1996; Jüriado et al. Reference Jüriado, Liira, Paal and Suija2009; Mežaka et al. Reference Mežaka, Brūmelis and Piterāns2012), and trees with sub-neutral bark may support the more rapid establishment and growth of oceanic lichen species such as those in the ‘Lobarion’ community (James et al. Reference James, Hawksworth, Rose and Seaward1977; Rose Reference Rose1988: Bidussi et al. Reference Bidussi, Goward and Gauslaa2013), also evidenced as a drip-zone effect (Goward & Arseneau Reference Goward and Arseneau2000; Gauslaa & Goward Reference Gauslaa and Goward2012). Tree species may therefore operate through lichen demographics, with certain trees facilitating growth of oceanic lichens, particularly in sub-optimal climates. Furthermore, while bark pH and furrow depth might be related to tree age/size (Ellis & Coppins Reference Ellis and Coppins2007; Fritz et al. Reference Fritz, Brunet and Caldiz2009; Jüriado et al. Reference Jüriado, Liira, Paal and Suija2009), the time over which trees exist may also increase the probability of colonization under the constraints of slower growth, longer generation times and smaller population sizes (see Supplementary Figure E in Ellis (Reference Ellis2018)). In the multimodel inference, tree species and age substitute for the effects of bark pH and furrow depth because they are related, though as compound variables tree species and age will include additional unmeasured though relevant effects, such as edaphic position determined by tree ecology (Rodwell Reference Rodwell1991; Averis et al. Reference Averis, Averis, Birks, Horsfield, Thompson and Yeo2004) and linking to a wider range of chemical responses that are not simply correlated with bark pH (Bates Reference Bates1992; Gustafsson & Eriksson Reference Gustafsson and Eriksson1995). Consequently, tree species and tree age, as proxies for chemical and physical microhabitats, and demographic parameters, remain a simple and powerful focus for woodland management. In the context of temperate rainforest, the occurrence of ash (Fraxinus excelsior), aspen (Populus tremula) and rowan (Sorbus aucuparia) appears to have the strongest positive effect, taking account of European hazelwoods being a special case that were outside the scope of our field sampling (Coppins & Coppins Reference Coppins and Coppins2012).
Bark water holding capacity represented a proximal variable that was not substituted by tree species or age but which strongly favoured oceanic epiphyte species and communities. Previous studies have implicated water holding capacity in explaining lichen epiphyte community structure across different forest types (Wolseley & Aguirre-Hudson Reference Wolseley and Aguirre-Hudson1997; Loppi & Frati Reference Loppi and Frati2004; Mistry & Beradi Reference Mistry and Beradi2005) and, by affecting moisture availability, it is likely to be an important factor determining climate change vulnerability. There were differences between trees with lower (Betula spp.) and higher bark water holding capacity (Fraxinus excelsior). However, on average, bark water holding capacity had values that were less strongly related to tree species and age. This is in contrast to some previous studies (e.g. Ilek et al. Reference Ilek, Kucza and Morkisz2017) but is consistent with other work showing that bark water holding capacity can have relatively high intraspecific variability within tree species and/or tree ages (Larson et al. Reference Larson, Rasmussen and Nord-Larsen2017; McGee et al. Reference McGee, Cardon and Kiernan2019). Given the apparent importance of this effect, additional research towards a predictive framework for water capacity, and incorporation into forest/woodland management, could be warranted.
Present-day European temperate rainforest is reduced in extent, and new woodland stands are necessary to reverse species declines (Johansson et al. Reference Johansson, Snäll and Ranius2013; Ellis Reference Ellis2017). Native woodland sites in oceanic western Scotland cover just 22 743 ha in small (median size = 25 ha) and isolated patches (Ellis & Eaton Reference Ellis and Eaton2018; Atlantic Woodland Alliance 2019). Expanding the area of, or creating new, native rainforest is aligned with current government policy for increasing Scottish native woodland cover (Anon 2006, 2019). As woodland cover is planned and regenerated, the tree type and longevity (tree ages), micro-topography and effects of substratum-moisture remain relevant (see above). However, new woodland provides an opportunity to exploit the additional effect of the landscape. The strong importance of landscape demonstrated here is supported by previous studies showing that internal stand microclimates are influenced more importantly by topographic position than by stand structure such as tree density or canopy cover (Vanwalleghem & Meentemeyer Reference Vanwalleghem and Meentemeyer2009; Joly & Gillet Reference Joly and Gillet2017; Macek et al. Reference Macek, Kopecký and Wild2019). Thus, new woodland should exploit gradients of topographic wetness and physical exposure, with water-accumulating and more sheltered sites potentially acting as oceanic microrefugia (Rolstad et al. Reference Rolstad, Gjerde, Storaunet and Rolstad2001; Radies et al. Reference Radies, Coxson, Johnson and Konwicki2009; Doering & Coxson Reference Doering and Coxson2010). Our calculation of topographic wetness would have incorporated, to some extent, the effect of distance to running and still water (since watercourses appear as sites with the most intense water accumulation), and these were therefore superseded by topographic wetness during multimodel averaging, though distance to watercourse has been shown to explain both lichen occurrence/abundance (Belinchón et al. Reference Belinchón, Martínez, Otálora, Aragón, Dimas and Escudero2009; Rambo Reference Rambo2010; Stehn et al. Reference Stehn, Nelson, Roland and Jones2013) and growth (Rambo Reference Rambo2010; Ellis Reference Ellis2020).
In conclusion, our results highlight the key features of both existing and new woodland cover that might be required to generate climate change resilience, by securing an availability of suitable microclimates ≈ microrefugia. The approach taken here aims to reduce species vulnerability by maintaining a sufficient heterogeneity of niche space into which epiphytes might disperse locally, within the same woodland, or between suitable woodland patches in response to changing macroclimate. This accommodates local turnover in species composition, in order to maintain species richness. The recommendations suggested below are based on the multimodel inference applied to 13 predictor variables and their inter-relationships:
• When expanding existing forest/woodland, or creating new woodland: do not plant uniformly but maximize the use of landscape gradients in topographic wetness (including distance to streams/rivers) and physical exposure (landscape);
• When expanding existing forest/woodland, creating new woodland, or managing existing woodlands:
○ select a diversity of native tree species and plan for certain stands to mature over 100s of years (tree type/age); for temperate rainforest epiphytes this might include a focus on ash, aspen and rowan, while avoiding over-representation of birch;
○ allow for microhabitat diversity, particularly trees with varying angles of lean (micro-topography).
In the context of temperate rainforest, used as a case study here, our current knowledge of climate change risk necessitates the focus on landscape or microhabitat heterogeneity, rather than targeting a more specific set of optimal microrefugia for future climates. This is because temperate rainforest is an ecosystem that, within our study region, appears to lack a clear analogue for its future climate (Ellis & Eaton Reference Ellis and Eaton2016). On the one hand it may experience increasing periods of summer drought (Jenkins et al. Reference Jenkins, Murphy, Sexton, Lowe, Jones and Kilsby2010; Murphy et al. Reference Murphy, Harris, Sexton, Kendon, Bett, Clark, Eagle, Fosser, Fung and Lowe2018), and bioclimatic models suggest some oceanic epiphytes may be negatively affected by warmth combined with dryness (Ellis et al. Reference Ellis, Coppins, Dawson and Seaward2007b, Reference Ellis, Eaton, Theodoropoulos, Coppins, Seaward and Simkin2014, Reference Ellis, Eaton, Theodoropoulos, Coppins, Seaward and Simkin2015b). On the other hand, increased winter wetness, for a low light period, may have a negative effect on epiphyte physiology and growth (Čabrajić Reference Čabrajić2009; Ellis Reference Ellis2019b). Since both summer drought and winter wetness could pose alternative threats, resilience should be maximized by designing woodlands that exploit the breadth of available heterogeneity in a landscape, from sheltered water-accumulating sites through to drier exposed areas, and along this continuum ensuring that a mixture of tree species with high levels of microhabitat complexity are integrated into stand management. Until we have predictive capability that confidently integrates lichen physiology with a more certain knowledge of future microclimates, this bet-hedging approach maximizes resilience given climate change uncertainty. The extent to which we can stack the odds in favour of temperate rainforest epiphyte survival is, however, weakened by the threat to tree species that are critical to providing suitable microhabitat, such as the potential loss of ash (Pautasso et al. Reference Pautasso, Aas, Queloz and Holdenrieder2013; Mitchell et al. Reference Mitchell, Beaton, Bellamy, Broome, Chetcuti, Eaton, Ellis, Gimona, Harmer and Hester2014).
Acknowledgements
We thank the Esmée Fairbairn Foundation for partly funding this research (field sampling and species identification), and government and private landowners for permission to access woodlands. The data analysis contributed to the Scottish Government Rural and Environment Science and Analysis Services (RESAS) Division through Work Package 1.3 of its 2016–2021 Strategic Research Programme. Three anonymous reviewers read and improved an earlier version of the manuscript.
Author ORCID
Christopher J. Ellis, 0000-0003-1916-8746.