Introduction
As databases in all fields of science are becoming increasingly accessible via the Internet, and as the exchange of information between these databases increases, data quality is rapidly gaining importance.
In the field of biodiversity informatics, the Global Biodiversity Information Facility (GBIF) plays a leading role in making primary information about biodiversity accessible via a single interface (GBIF, 2011a). This includes information about museum specimens, field observations and living collections, as well as genebank collections. GBIF periodically harvests and indexes data from their current 322 sources automatically. Thus, the GBIF interface allows the user to search each contributing database with only a single query. This option obviously created challenges regarding data quality and standardization. To tackle these challenges, GBIF commissioned the writing of a number of guides and manuals (Chapman, Reference Chapman2005a, Reference Chapman2005b; Chapman and Wieczorek, Reference Chapman and Wieczorek2006), and organized a series of regional courses and workshops for data curators training them in data curation techniques. However, at the current scale of 11,708 datasets from 322 data publishers (GBIF, 2011b), data quality remains a problem.
In the domain of genebanks, the data quality issue is best illustrated by focusing on EURISCO, the European catalogue of ex situ plant genetic resources (PGR). EURISCO is a web-based catalogue that provides information about ex situ plant collections maintained in Europe (EURISCO, 2011a). The data are uploaded by a network of data providers, one in each country, maintaining an inventory of the PGR in that country. As of January 2011, a total of 1,083,447 accessions from 37 European National Inventories were documented in this system.
van Hintum and Knüpffer (Reference van Hintum and Knüpffer2010) showed that the high number of spelling errors and the low level of standardization of the taxonomic names in EURISCO made access unnecessary complicated; the use of a relatively simple ‘translation table’ translating the used names in standardized names could solve most of the problems. This study clearly highlighted the problems associated with sharing data from different sources caused by low data quality.
In this context, the need was felt to evaluate and analyse the quality of passport data. Data quality is a complex property and consists of aspects such as ‘fitness for use’ and ‘representation of reality’. In the case of passport data quality, one can define the following most prominent components:
(1) Does the dataset cover the material in the domain; i.e. is it complete at the collection level, does it describe all accessions that it should describe?
(2) Do the information elements – called descriptors in the genebank domain – in the dataset sufficiently describe the relevant aspects of the material?
(3) Is the information interpretable, i.e. can an informed user understand the meaning of the data points?
(4) Is the information correct and plausible, in other words does it reflect reality?
(5) Is the information complete at the accession level, sufficiently precise and consistent?
It is quite obvious that without additional information about the objects described in the database the first (coverage) and the fourth (correctness and plausibility) component cannot be addressed. It is clear that an altitude of a collection site above 10,000 m is not plausible, because we know that there is no spot on earth with such an elevation. But an answer to the question as to whether all material in French collections is included, or whether an accession is actually the variety it is supposed to be (van de Wouw et al., Reference van de Wouw, van Treuren and van Hintum2011), cannot be answered without additional data.
The second component of data quality is a matter of fit for use and is as such dependent on the context in which the data have to be used. In this study, the National Inventories, as created by the different countries in Europe and uploaded to EURISCO were studied. The descriptors used for this database were determined in a lengthy process. Choices were aimed at maximizing the fitness for use. The list has been widely adopted by the PGR community, and can thus be considered fit for use (although a process to update the current list has been started).
This implied that only components three and five could be studied: the interpretability and completeness of the information. The aspect of interpretability involves the checking of format, and the comparison with standard or accepted codes and terms. The interpretability of the taxonomic names was explored by van Hintum and Knüpffer (Reference van Hintum and Knüpffer2010), and will only be further explored to a small extent in this paper.
The fifth component, the completeness, precision and consistency of the data can be determined analysing the information itself. In the case of passport data, the parameter precision only applies to longitude and latitude of the collection site. It has not been further considered in this study, but might deserve future attention when updates of the descriptors for data exchange are considered. In this regard, the concepts of Wieczorek et al. (Reference Wieczorek, Guo and Hijmans2004) dealing with geo-references, allowing an indication of uncertainty of the data points might prove very useful. Also, the issue of consistency was not explored in any depth, because it falls beyond the scope of this paper. In the case of passport data consistency might be measured by comparing distribution areas of species with their collection sites assuming that crops cannot be collected from fields where they are not grown and wild species cannot be collected where they do not occur. It could also be measured by comparing the varieties in a pedigree with the origin year of the accession; the parents should be older than the offspring. However, such analyses were not performed.
The main purpose of this study was to create an indicator for the completeness of the data, after removal of uninterpretable data points.
Materials and methods
Data
The complete content of EURISCO was made available on January 5th 2011 by Milko Skofic of Bioversity International as a zipped file with comma separated values. It contained 1,083,447 accessions from 37 National Inventories and 40 countries, covering the collections of 313 individual institutes. The four Nordic countries are represented by one National Inventory created by NordGen.
Data processing
Since the number of records in EURISCO exceeded the maximum number of rows in Excel 2007 (1,048,576), the file was cut in halves and loaded in Excel. All calculations were done in Excel 2007, using Visual Basic for Applications when necessary. The scripts are available on request from the authors.
Removal of non-informative data points
Non-informative data points were removed from the dataset. This involved 1,741,778 times the value ‘-’, 3728 times ‘unknown’, 53 times ‘unknown, unknown’ and 147 times ‘n.n.’.
The value ‘sp.’ was removed 57,553 times and ‘sp.’ 249 times from the field with the species name.
Removal of uninterpretable data points
Two aspects of interpretability were examined: one was the compliance with the descriptor list and the second was the plausibility.
All values in columns that did not comply with the format and coding rules as described in the EURISCO descriptor list (EURISCO, 2011b) and which could not be automatically corrected, were deleted. For example, if according to the descriptor list multiple values were allowed in a field provided that they were separated by a semicolon without space, and instead a semicolon with space was used to separate values, this was not considered an erroneous value since it could be corrected automatically. Also, if in data fields only a year was listed without the hyphens to complete the field, as defined in the descriptor list, these hyphens were automatically appended, etc. If a data point contained a code indicating that the information was provided in the remarks field with the appropriate prefix, this prefix needed to be present, otherwise the code was deleted; for example if the field for sample status contained the code ‘999’, the remarks field had to contain the prefix ‘SAMPSTAT:’. If it did not, the ‘999’ was deleted.
All codes had already been examined when the individual datasets were uploaded in EURISCO. At that stage the plausibility of the coordinates was also examined: all latitudes outside the range of − 90 to 90 and longitudes not between − 180 and 180 were removed (Milko Skofic, pers. commun.).
Calculation of the passport data completeness index (PDCI)
To quantify the completeness of the passport data, the PDCI was calculated for each record in EURISCO after the removal of uninterpretable data points. The value of this PDCI depends on the absence or presence of data points, taking into account the presence or value of other data points. For example, if the population type indicated that the record concerned a wild accession, it was important that the collection site was well documented with a description of the location or longitude and latitude, but the variety name was not considered to be applicable. However, if it concerned a modern variety the variety name was considered very important whereas the collection site was not applicable.
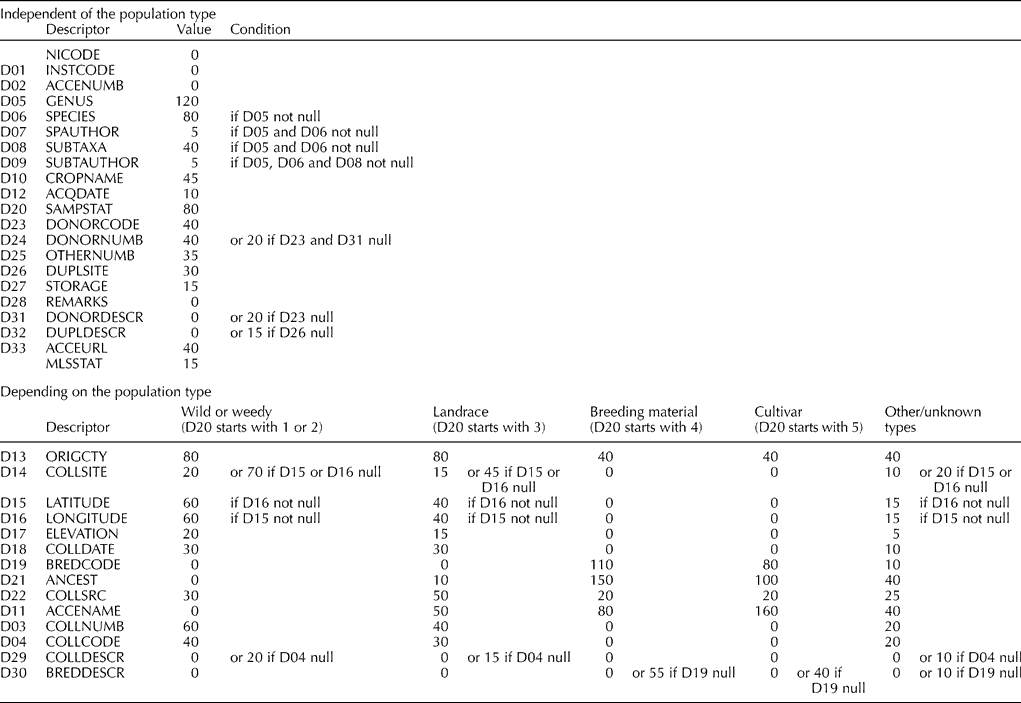
In Table 1, an overview of the conditional values of the presence of data points is given. (A preliminary version of this index was used in the paper of van Dooijeweert and Menting (Reference van Dooijeweert and Menting2008)).
Key to calculating the PDCI. The descriptors correspond to those of the FAO/IPGRI Multi Crop Passport Descriptor List, NICODE and MLSSTAT are specific to the EURISCO uploading format. The final PDCI is the sum of values divided by 100

The values used in this calculation are, by default, arbitrary. A few principles were used:
(1) Any type of accession can attain the maximal score, i.e. a wild accession as well as a landrace or variety can score a PDCI of ten. If the population type was not known the maximal score was 6.7.
(2) The generic part of the descriptors represent 60% of the PDCI value, the remaining 40% is dependent on the population type.
(3) In cases where a code for a type of information was available, such as the code for donor, zero PDCI value was allotted for the corresponding field with the decoded information, since these fields are intended only to be used if the code is not available.
(4) The PDCI value of a coded field was twice as that for the field for decoded information.
(5) In case there is dependency between fields, the lack of one implied zero PDCI value for the other as well. For example, if there is a latitude but no longitude, there is no value assigned to the latitude data.
After calculation of the PDCI for each individual record, the scores were averaged over groups of accessions, and standard deviations were calculated. For this purpose the names of the genera were cleaned and standardized as described in van Hintum and Knüpffer (Reference van Hintum and Knüpffer2010), using the genera names listed in GRINTax (2010).
Results
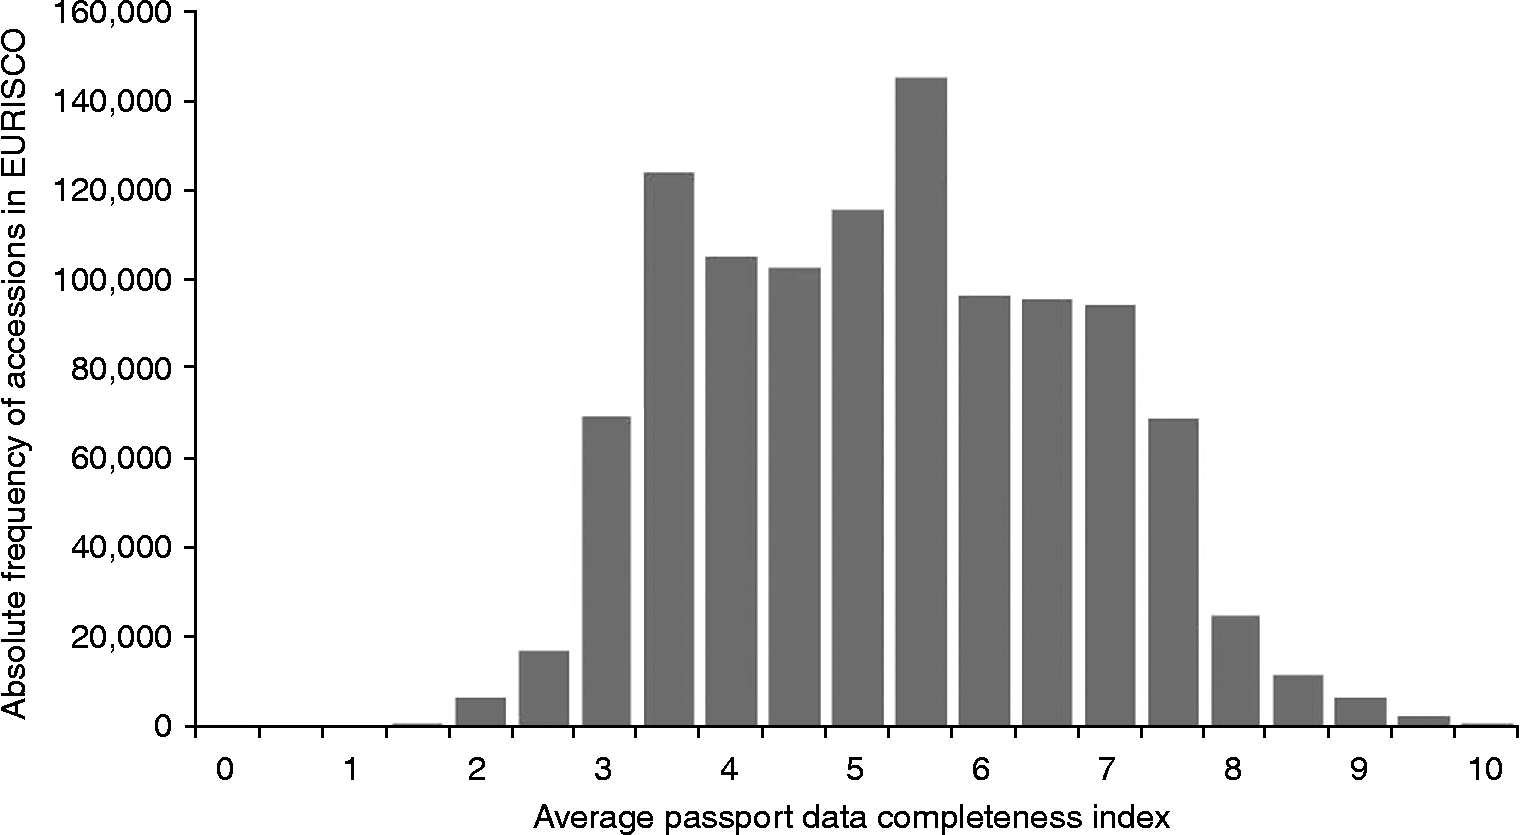
The complete set of 1,083,447 accessions documented in EURISCO had an average PDCI of 5.2. This is a score that can be attained for example, when, a variety is documented by data on genus, species, subtaxa, sample status, origin country and accession name or a wild accession by data on genus, species, subtaxa, sample status, origin country, latitude and longitude. The individual PDCIs ranged from 1.2 to 10.0, see Fig. 1 for a frequency distribution of PDCIs of all accessions in EURISCO.
Frequency distribution of PDCI scores of the accessions in EURISCO (absolute frequencies of the classes with size 0.5).

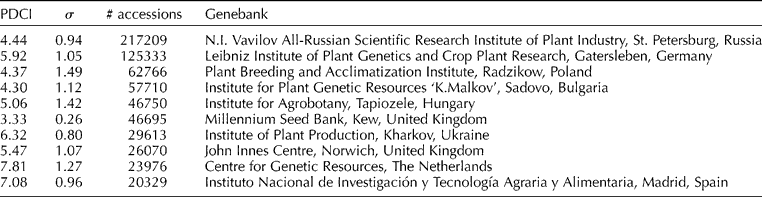
When grouped by the country of the holding institute, the highest average score was 7.4 for a country with 26,947 accessions in EURISCO. The lowest country-based scores were for a few smaller countries with scores well below 4. The highest score for an individual holding institute was 7.8 (23,976 accessions). The lowest scores for institutes were well below 3. An overview of the ten largest genebanks is given in Table 2.
Average PDCI, standard deviation (σ) and number of accessions of the ten genebanks with the highest number of accessions in EURISCO (ordered by the number of accessions)

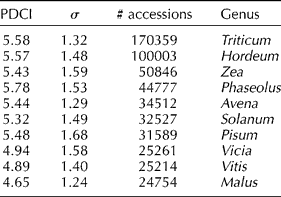
Taking a genus based perspective, it appeared that, disregarding genera only represented with one accession, the genus Cytisus (a fodder legume) with 307 accessions had the most complete passport data, scoring an average of 7.4. This was mainly due to the 196 accessions maintained in a Spanish collection that scored an average PDCI of 8.7, the highest index for a single crop collection. The five genera with high numbers of accessions (>10,000 accessions) and the highest scores were Lactuca (6.4), Dactylis (6.3), Brassica (6.1), Lolium (6.0) and Panicum (5.8). The lower tail of the distribution of PDCI scores over genera consisted of a very large number of wild genera with a single accession, Pleiospermium with one accession scoring the lowest PDCI of 1.7. The five ‘large genera’ with the lowest scores were X Triticosecale (4.1), Pyrus (4.5), Prunus (4.6), Malus (4.7) and Glycine (4.8). An overview of the ten largest genera is given in Table 3. Overall, it could be observed that genera with large number of accessions showed higher PDCIs than the smaller genera. The largest seven genera, together comprising 43% of the accessions, all had PDCI scores above 5.2 (see Table 3), whereas the 5021 genera with 100 accessions or less had an average PDCI of only 3.9.
Average PDCI, standard deviation (σ) and number of accessions of the ten genera with the highest number of accessions in EURISCO (ordered by the number of accessions)

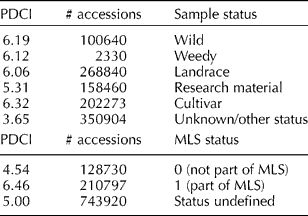
Analysing other descriptors of EURISCO showed that cultivars are best documented, whereas the research material exhibited poorest information levels, disregarding material of which the status is not known (see Table 4). If the relatively new descriptor for the Multilateral System (MLS) status was taken to distinguish accessions, it appeared that the material in the MLS of the International Treaty on PGR for Food and Agriculture (FAO, 2002) had a much higher average PDCI than material that was not included (Table 4).
Average PDCI and number of accessions per sample status and per MLS status of accessions in EURISCO

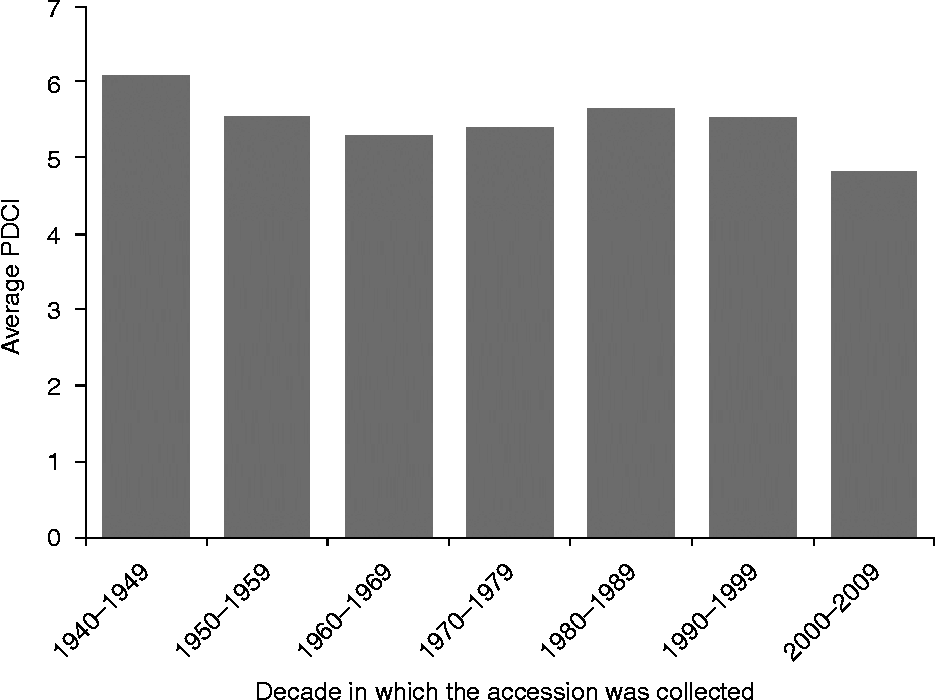
No consistent effect of the acquisition date (the date the material was included in the collection) could be observed. If only acquisition years for which more than 1000 accessions were included in EURISCO were considered, all PDCIs were between 5.16 and 5.84 without a clear trend. However, there seemed to be a small effect of the date of collecting, as shown in Fig. 2. Although the trend is not steady or strong, there seems to be a decline in PCDI values over the last couple of decades of collecting; the 5882 accessions that were collected in the earliest decade (1940–1949) appeared to have the highest average PDCI of all decades of 6.1, whereas the 94,512 accessions from the most recent complete decade (2000–2009) had an average PDCI of 4.8, the lowest of all decades. This can be explained by the fact that in recent decades, relatively few collections of the ‘large genera’, which exhibited generally high PDCI scores, were added to the collections.
Average PDCI scores over the decade in which the accession was collected. Only the decades with over 1000 accessions are shown.

Discussion
The quality of data is clearly an important parameter in the modern information age (Redman, Reference Redman2004), and genebank data form no exception. The International Standards Organization defines quality as ‘the totality of characteristics of an entity that bear on its ability to satisfy stated and implied needs’ (ISO, 1994). Data of low quality will, per definition, not satisfy the needs of genebanks and their users; low data quality will result in less efficient conservation and utilization of the PGR in the genebank. Incomplete data will force the user to request more accessions than needed since she/he does not have the information to allow for a proper selection. Genebanks will not be aware of undesired duplication, since the identification of duplication heavily depends on the availability of proper data (van Hintum, Reference van Hintum2000).
The importance of data quality implies that it needs to be managed. Data quality management will generally involve three steps (1) the prevention of insufficient data quality, (2) the detection of imperfect data and their causes, (3) actions to be taken/corrections (Arts et al., Reference Arts, de Keizer and Scheffer2002). This paper deals with a few components of the first element of the second step, the detection of imperfect data by quantifying the completeness of passport data. This is an important the first step towards proper management of the data quality in genebanks.
An index was defined that can indicate the level of completeness of the passport data of an individual genebank accession. However, like any indicator, this index will only be a proxy of the true quality with drawbacks that need to be taken into account when interpreting the results. It measures just a small aspect of the quality of the passport data: the conditional presence of values. It does not consider any other issue related to data quality such as completeness in terms of the coverage of the material in the domain, interpretability, correctness, plausibility or precision. This implies that it needs to be interpreted with some care, also because the PDCI can result in false readings, for example in the case of fictional values entered into datasets. Furthermore, the values attributed to the conditional presence of certain data points and the basis of the calculation of the PCDI is fundamentally arbitrary, questions such as ‘should the crop name be more important than the donor code?’ do not have a definite answer. However, it appears that the overall picture is not very sensitive to changes in these values: well-documented accessions will remain well documented even if the value ascribed to different descriptors is modified.
van Dooijeweert and Menting (Reference van Dooijeweert and Menting2008) used an earlier version of the PDCI to monitor efforts to improve the quality of passport data. In their experience the accessions with an intermediate completeness of passport data allowed improvement whereas the data quality of accessions that were well documented already or very poorly documented accessions, could generally not be improved. The fact that Table 2 showed that the completeness of the passport data of most accessions in Europe is intermediate, 83.1% of the accessions had a PDCI between 3.0 and 7.0 (when classes of width 0.1 are considered) might thus imply much potential for improvement.
The analysis of the data in EURISCO showed that the PDCI can be used to identify datasets or parts thereof that might need additional attention, or that need more careful interpretation than other (parts of) datasets. In general, genera with smaller number of accessions showed lower PDCI scores compared with the larger genera, and the usage of this type of material will thus require more attention than genebank material of larger crops. Another, but probably related example, is the very low PDCI of the Millennium Seed Bank in the United Kingdom (Table 3). This ‘seed bank’ concept comes from a herbarium background, and is not an agricultural genebank, and might therefore apply another standard of data quality.
Most of the results presented in this paper were not unexpected: fruit trees are generally poorly documented, modern cultivars have better documentation compared with other types of samples, and countries tend to have included the well-documented material in the MLS (Table 4). The slight recent decline in PDCI when considered as a function of the time of collecting was unexpected and disquieting. However, this trend was not continuous, there were fluctuations.
In conclusion, the PDCI as presented in this paper, has shown to be a useful tool in comparing (parts of) datasets or individual accessions. It can be adjusted to other data structures, by simply reallocating the values over the descriptors in the structure, in the way presented earlier (provided that the values accorded are transparent). Based on a clearer picture of this and other aspects of the data quality in genebanks, steps can be taken to improve the data quality in ex situ genebank data quality and in that way ‘the ability to satisfy stated and implied needs’ of genebank users and curators can be improved.
Acknowledgements
The authors would like to acknowledge Milko Skofic, working for EURISCO at Bioversity International, Rome, for his support and comments to the paper and Bert Visser and Rob van Treuren of the Centre for Genetic Resources, the Netherlands, for his useful comments on the manuscript.