Introduction
Excessive sound exposure, when experienced at high levels, can cause damage to the ear and result in noise-induced hearing loss (NIHL). According to the World Health Organization (WHO), over 12 per cent of the global population (around 600 million people) is at increased risk of developing NIHL, with noise exposure accounting for approximately one-third of all hearing loss cases.Reference Le, Straatman, Lea and Westerberg1 While occupational noise is widely recognised as the leading cause of NIHL, hazardous sound levels can also arise in recreational settings, such as loud dance parties, rock concerts,Reference Ulrich and Pinheiro2 firearm useReference Bapat and Tolley3 and increasingly, among users of personal listening devices (PLDs)Reference Mohammadpoorasl, Hajizadeh, Marin, Heydari and Ghalenoee4 like headphones or earphones. The growing use of smartphones means that many students are exposed to leisure noise through mobile phones, leading to a noticeable rise in high-frequency hearing loss among college students, particularly those who use earphones regularly.Reference Naik and Pai5 To promote safe listening practices, the WHO recommends the 60/60 rule for PLD usage—limiting the volume to no more than 60 per cent for no longer than 60 minutes per day.6 This highlights the need to further evaluate PLD usage and hearing health among young individuals.
Methods
A Cross-Sectional Study was conducted in the Department of Otorhinolaryngology at the All India Institute of Medical Sciences, Jodhpur, India over a duration of two years with a final sample size of 177. (Based on uniform sampling of 319 eligible candidates from 526 responses to an online validated Questionnaire.) Ethical approval was obtained from AIIMS Jodhpur; Institutional Ethical Committee (AIIMS/IEC/2020/3179) and registered under Clinical Trials Registry – India (CTRI/2020/11/028970).
Analysis of usage of personal listening devices
Initially the usage of headphones/earphones was analysed with an online questionnaire filled out through Google forms. The link to the validated questionnaire was shared through online platforms like WhatsApp and e-mail to corresponding groups of medical trainees, namely MBBS students, Postgraduates (Junior Residents), Nursing Students and Senior Residents. The response from the participants was analysed through Google Forms. Those individuals with known hearing loss, audiological or otological abnormalities, systemic co-morbidities and not using PLDs were excluded from the study. Eligible participants were reached online, and those willing for further evaluation were subjected to clinical examination and pure tone audiometry.
Clinical and audiological evaluation
A complete ENT examination was done for all participants.
The pure tone audiometry (PTA) was performed with the MAICO MA 42 two-channel audiometer (voltage, 100–240V; frequency, 50–60Hz) in the sound-proof audiometry room of the department which is generally used for routine patients. Air conduction was checked with headphones with interaural attenuation of 45dB. A bone oscillator was used to check the bone conduction of the patients. Adequate masking was done.
Thresholds of hearing at 250Hz, 500Hz, 1000 Hz, 2000 Hz, 4000 Hz and 8000 Hz were measured using the Hugson Westlakes Ascending method. Average of 500Hz, 1000Hz and 2000Hz frequencies was taken for both air conduction (AC) and bone conduction (BC), and the air–bone gap (AB gap) was calculated. Hearing loss was categorised as slight (average pure tone threshold of 16–25dB), mild (26–40dB), moderate (41–55dB), moderately severe (56–70), severe (71–90dB) and profound (91dB and above).Reference Clark7
Results
Google Forms were used to achieve 526 responses online regarding PLD usage. Of these, 293 (55.7 per cent) were male and 233(44.3 per cent) were females. Maximum response was obtained from MBBS students (318; 6.5 per cent) and the least from senior residents (12–2.3 per cent). A total of 335 (63.7 per cent) reported that they use PLDs for more than 1 hour per day, most of them preferring moderately loud levels (331 [62.9 per cent]; loud, 45 [8.6 per cent] and soft, 150 [28.5 per cent]). Earphones, or in-the-ear type of PLD, were the most preferred type (419; 79.7 per cent), whereas headphones, or over-the-ear, were least preferred. Among 526, 170 (32.3 per cent) had sudden loud noise exposure history, 11 (2.1 per cent) had ear diseases, seven (1.3 per cent) had co-morbidities and 19 (3.6 per cent) did not use any PLDs; hence, these participants were excluded from the study. Among the symptoms of sensorineural hearing loss (SNHL), tinnitus was present in 87 (16.5 per cent) individuals and friend/familial reporting of difficulty in conversation in 100 (19 per cent) individuals.
The results were analysed with SPSS 23 software. Chi-square test and Kruskal–Wallis analysis (non-parametric test) were applied to analyse significance wherever applicable.
Of 319 eligible candidates, 177 candidates (Table 1) volunteered for further evaluation with male predominance (n = 108; 61 per cent). MBBS students responded the maximum (50.8 per cent), followed by junior residents (27.1 per cent), nursing students (17.5 per cent) and senior residents (4.5 per cent). The calculated mean age was 22.35 with a standard deviation of 2.94 and a mode of 21 years. The age was found to be not normally distributed (based on Shapiro–Wilk Test), with an interquartile range of 5 (first quartile, 20; second quartile, 25).
Frequency of different variables

Table 1 Long description
Frequencies for multiple variables are intended to be summarized for a participant sample, but the table body is missing. Without the listed variables and their counts or percentages, no key values, comparisons, or trends can be identified. The only contextual cues indicate the results relate to participants and may include personal listening device use, but the distribution across categories cannot be described. Provide the table rows and columns to generate accurate, WCAG-compliant.
N = total number of participants; PLDs = personal listening devices.
PLD usage of participants volunteering for hearing evaluation
About 58.2 per cent of the volunteer participants use PLDs for more than 1 hour per day, with most of them preferring earphones/in the ear type (78 per cent) than headphone/over the ear type (9.6 per cent) or both (12.4 per cent). Moderately loud volume (61.6 per cent), soft (33.3 per cent) and loud (5.1 per cent) were different volume levels preferred by the participants. The loudness preference was regrouped as two components — loud (loud and moderately loud combined) and soft (taken as such) — as the distribution is not uniform, with many fewer preferring loud noise.
Hearing assessment
The PTA values were analysed as frequency-specific sound levels and average sound levels (Table 2). We can see the maximum mean value of sound threshold was found for lower frequencies (250Hz and 500Hz) and the least for higher frequency (8000Hz), resulting mostly in an upsloping type of audiogram (Figure 1).
Frequency specific Average Pure Tones (Mean). (AC – Air Conduction, BC – Bone Conduction).

Frequency-specific hearing thresholds in right and left ear

Table 2 Long description
Hearing thresholds by test frequency are intended to be reported for both the right and left ear. The structure implies separate results for air-conduction and bone-conduction measurements, with values expressed in decibel hearing level and accompanied by variability such as standard deviation. However, no actual table entries, frequencies, or threshold values are included in the provided data. Because the numeric results are missing, differences between ears, frequency-related patterns, and any degree of hearing loss cannot be summarized or interpreted from this input. Provide the table values to enable an accurate description of key points and comparisons.
AC = air conduction; BC = bone conduction; dB HL = decibel hearing level; SD, standard deviation.
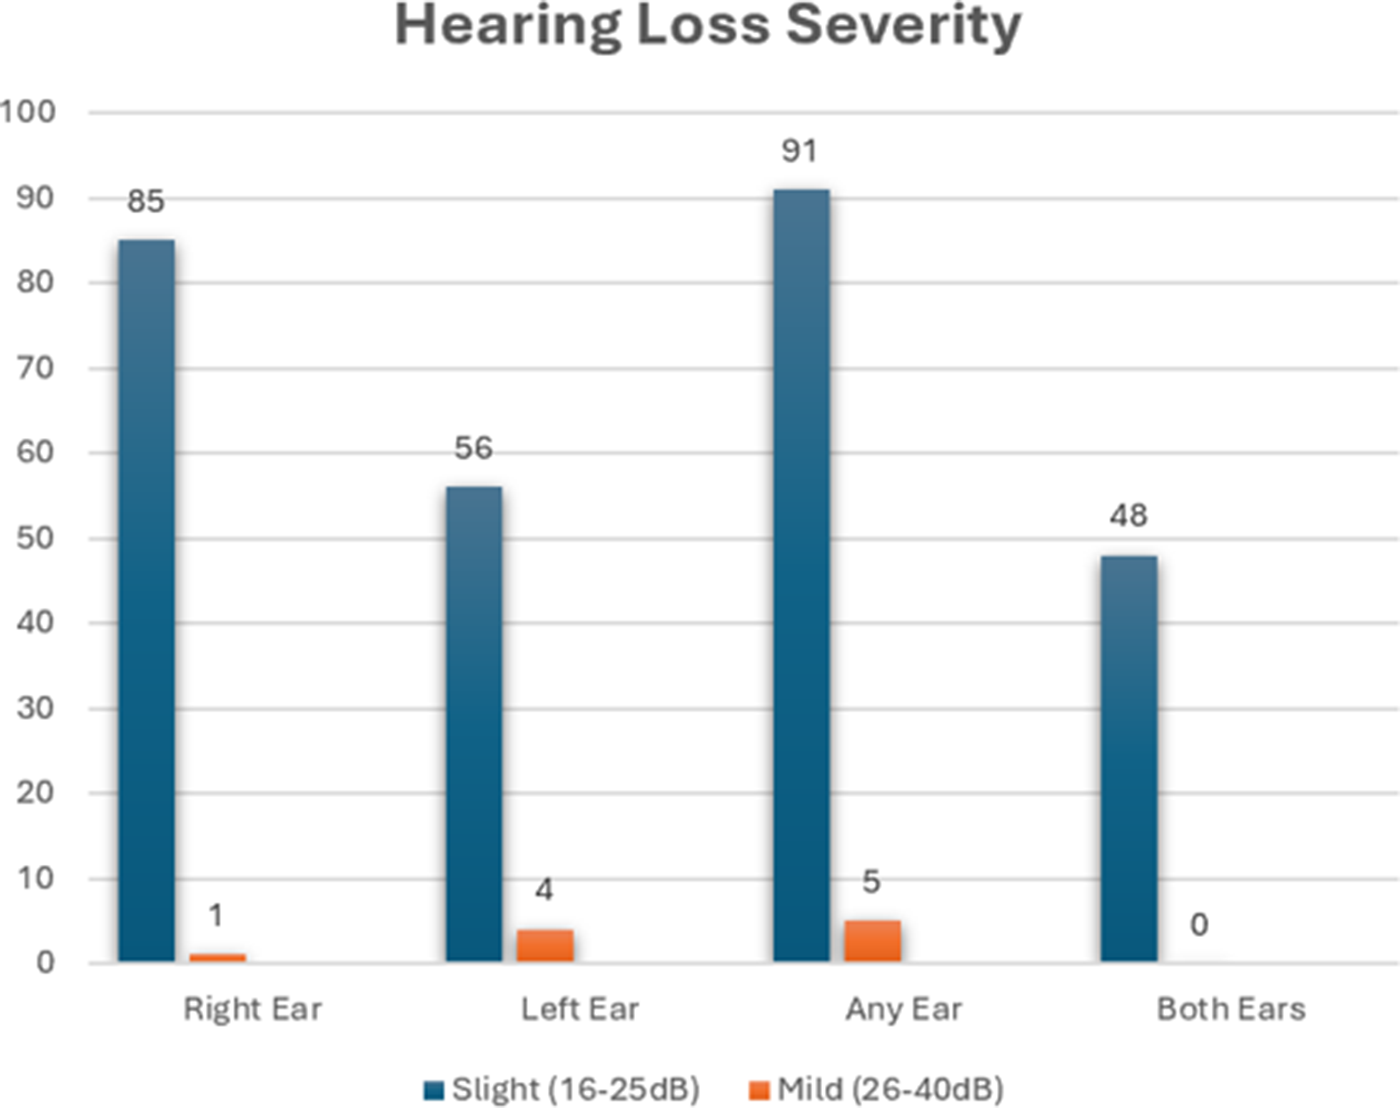
Hearing loss by PTA (at least slight hearing loss, more than 15dB three frequency average) was noted in 48.6 per cent on the right and 33.9 per cent on the left. Among these, 27.1 per cent had hearing loss in both ears and 54.2 per cent had hearing loss in at least one ear. They were categorised based on the severity as mentioned below (Figure 2). Only slight and mild types of hearing loss were noted in this study.
Distribution of hearing loss severity among the study population.

The hearing loss based on PTA (>15dB average) was taken for comparison with various variables. The usage of PLDs (loudness preference and type of device preference) was analysed with the hearing loss calculated by PTA for right, left, both and at least one ear individually (Table 3). No significant difference was found between the type of listening device and hearing loss (by Kruskal–Wallis test); p values: right, 0.563; left, 0.186; any ear, 0.886; both ears, 0.567. Loudness preference and hearing loss; p values: right, 0.915; left, 0.0.312; any ear, 0.337; both ears, 1.0. Duration of usage and hearing loss, correlation analysis (PLD duration and hearing thresholds) and logistic regression also revealed no significant relationship (p > 0.05) with low pseudo R2 (0.01).
Test of significance: hearing loss and duration of PLD usage

Table 3 Long description
Significance testing for the association between hearing loss and duration of PLD use cannot be described because no table entries were provided. The intended content appears to compare hearing-loss outcomes across PLD duration groups and report a p-value from a chi-squared test, along with degrees of freedom. Without the counts or percentages in each duration category and the reported p-value, it is not possible to state whether hearing loss differs by PLD use duration or to identify any trend. Provide the duration categories, hearing-loss categories, sample sizes, and the reported p-value so the key findings can be summarized accurately.
* p-Value calculated by chi-squared test.
df = degree of freedom.
Subgroup analysis
Males had significantly higher hearing loss in both ears (p = 0.015). While taking the mild hearing loss (>25dB Hearing threshold on average) for assessment also, there was no significant difference found (p > 0.05).
Discussion
NIHL is a well-documented occupational hazard. However, NIHL resulting from leisure noise exposure has not been extensively studied. Leisure noise exposure in young adults has evolved from watching television to using PLDs such as CD cassettes and Walkman.Reference Jokitulppo, Björk and Akaan-Penttiä8 With technological advancements, multimedia phones have become an integral part of daily activities, including listening to music, watching videos and online classes. PLDs are increasingly used in public by individuals desiring a personal sound space while performing daily activities. The increase in PLD usage in medical student was studied,Reference Basu, Garg, Singh and Kohli9 which has further increased since coronavirus disease 2019 (Covid-19) times.
In our study, we focused on medical trainees to eliminate two confounding factors: (1) presbycusis — age-related hearing loss, which commonly presents as high-frequency hearing loss around the 5th decade of lifeReference Arvin, Prepageran and Raman10; (2) occupational noise exposure — in the general population, additional noise exposure can occur due to occupation, whereas medical trainees typically do not experience such occupational noise exposure. This population is therefore nearly ideal for assessing the impact of PLDs.
PLDs usage (Table 1)
Type of device
Most individuals preferred in-the-ear earphones over over-the-ear headphones, aligning with Mohammadpoorasl et al.Reference Mohammadpoorasl, Hajizadeh, Marin, Heydari and Ghalenoee4 This preference may be due to portability, affordability and ease of use. However, Kim et al. found that headphones were associated with lower listening levels (7–9 dB lower output),Reference Kim, Hong, Shim, Kim, Cha and Yeo11 suggesting a potentially safer alternative. Further analysis is required as the output level of each headphone or earphone varies, making it difficult to accurately assess actual noise exposure. Our study utilised generic PLDs, not brand-specific devices, so we could not comment on whether different brands and models contribute to varying levels of hearing loss.
Loudness preference
The most preferred volume level was “moderately loud”, making it difficult to categorise as “safe” or “unsafe” based on current standards.
Men showed a higher loudness preference than women, consistent with previous studies.Reference Kageyama12 The most preferred volume level was “moderately loud,” which falls in a grey area and cannot be categorised as more than or less than 60 per cent volume. The complexity of exposure characteristics requires further analysis. We had difficulties while exploring the options to measure the objective loudness exposure for each individual. (Each headphone/earphone having different decibels of loudness in volume rockers.) One method was the KEMAR Mannequin developed by Knowles Electronic,Reference Fligor and Cox13 but it was costly and not easily available. Hence, for noise level assessment, the subject’s subjectively preferred loudness was included, and the actual sound pressure level was not included. Noise exposure levels and hearing impairment calculations were made by National Institute for Occupational Safety and Health (NIOSH) based on industrial noise exposure, and there is no standard for PLDs; this made it difficult to set a standard sound level that is detrimental to an individual while using PLDs.Reference Jiang, Zhao, Guderley and Manchaiah14 Therefore, we emphasise the need for a cost-effective device to estimate output levels from different sources (e.g., mobile phones, music players) and listening devices that can be applied in daily life.
PTA
The mean hearing threshold of low frequencies was higher than that of high frequencies (Table 2). Contrary to the expected down sloping audiograms in NIHL with high-frequency hearing loss, we observed mostly upsloping audiograms. This better high-frequency threshold can be attributed to the young age of the study participants, where high-frequency hearing is usually better than in older individuals. A dip at 4000 Hz, known as the boilermaker’s notch, was used to detect early changes due to NIHL,Reference Agarwal, Nagpure, Pal, Kaushal and Kumar15 and was noted in only one individual. The majority of hearing loss in the study belonged to the slight hearing loss category, with very few cases of mild hearing loss, which is commonly used for pathological hearing evaluation in the general population. This highlights the need for a larger sample size to assess categories other than slight hearing loss.
Hearing loss and its relation to PLD usage
Despite 54.2 per cent of participants showing slight hearing loss in at least one ear, no statistically significant relationship was found between: hearing loss and PLD type (p > 0.05, Kruskal–Wallis test); hearing loss and loudness preference (p > 0.05); hearing loss and duration of PLD usage (p > 0.05) (Table 3).
Possible reasons for the lack of statistical significance to be considered are: sample size limitations — the study may not have had enough power to detect small effect sizes; short duration of PLD exposure — cumulative hearing damage often takes years to manifest; and interindividual variability — genetic predisposition, previous infections and recreational noise exposure (e.g., concerts, gaming) may have influenced results.
Males had significantly higher hearing loss in both ears (p = 0.015) on subgroup analysis supporting the hypothesis that they may be at higher risk due to louder volume preferences.
Studies have shown a significant rise in hearing threshold values with more than 5 or 15 years of PLD usage (12), but average pure tone hearing loss was not compared with duration. No significant results were obtained for both slight and mild types of hearing loss concerning the duration of usage.
Study limitations
Self-reported data on loudness preference and duration of PLD usage may have introduced recall bias. Objective measurement of actual PLD sound levels was not performed, limiting accurate assessment of noise exposure. The cross-sectional study design does not allow differentiation between temporary and permanent hearing loss. In addition, the uneven distribution of PLD usage categories restricted meaningful subgroup comparisons. Potential confounding factors such as genetic predisposition and exposure to ototoxic medications were also not controlled, which may have influenced the findings.
Future research and public health implications
Given the increasing use of PLDs, further studies should employ longitudinal designs to track hearing changes over time and use objective measurements of noise exposure. Future research should investigate dose–response relationships between PLD usage duration, listening volume and hearing loss. In addition, the effectiveness of preventive strategies, such as safe-listening alerts on smartphones and adherence to NIOSH-recommended listening guidelines, should be evaluated. Raising awareness among young adults about safe listening habits is also essential to reduce the risk of NIHL.
Conclusion
Medical trainees predominantly use in-the-ear PLDs at moderately loud volumes for greater than 1 hour daily. Although over half exhibited slight hearing loss in at least one ear, no significant correlation was found between PLD type, loudness preference or usage duration and hearing loss. Significantly higher hearing loss in males is also notable. This study highlights the need for improved methodologies to measure actual noise exposure and calls for larger, longitudinal studies to better understand the long-term effects of PLDs on hearing health. Increased awareness and preventive measures are essential to mitigate the potential risk of noise-induced hearing loss in young PLD users.
Competing interests
None.
Data availability
Yes, available.
Funding
Non funded.
Ethical approval
Ethical approval obtained (AIIMS/IEC/2020/3179).
Pre-registered clinical trial number
CTRI/2020/11/028970.