Introduction
Silicon isotopes and previous interlaboratory calibrations
The use of silicon (Si) isotopes in geosciences has expanded in the past decade to include cosmochemistry (e.g. Georg et al. Reference Georg, Halliday, Schauble and Reynolds2007), earth surface processes (e.g. Opfergelt et al. Reference Opfergelt, De Bournonville, Cardinal, Andre, Delstanche and Delvaux2009), palaeoceanography (e.g. de la Rocha et al. Reference De La Rocha, Brzezinksi, Deniro and Shemesh1998, Brzezinksi et al. 2002, Beucher et al. Reference Beucher, Brzezinksi and Crosta2007, Reference Beucher, Brzezinksi and Jones2008), palaeolimnology (Street-Perrott et al. Reference Street-Perrott, Barker, Leng, Sloane, Wooller, Ficken and Swain2008, Leng et al. Reference Leng, Swann, Hodson, Tyler, Patwardhan and Sloane2009, Swann et al. Reference Swann, Leng, Juschus, Melles, Brigham-Grette and Sloane2010) and biological systems, including Si uptake by diatoms (de la Rocha et al. Reference De La Rocha, Brzezinksi and Deniro1997), plants (Opfergelt et al. Reference Opfergelt, Cardinal, Henriet, Andre and Delvaux2006, Hodson et al. Reference Hodson, Parker, Leng and Sloane2008) and sponges (de la Rocha Reference De La Rocha2003, Hendry et al. Reference Hendry, Georg, Rickaby, Robinson and Halliday2009, Reference Hendry, Georg, Rickaby, Robinson and Halliday2010, Wille et al. Reference Wille, Sutton, Ellwood, Sambridge, Maher, Eggins and Kelly2010).
Si is present in three stable isotopes: 28Si (92.22%), 29Si (4.68%) and 30Si (3.08%). The fractionation factor during a reaction from A to B, α, is defined by Eq.
(1):

where x is either of the two minor isotopes, 29Si or 30Si. The per mil (‰) Si isotopic composition is expressed relative to the NIST standard, NBS 28, according to Eq.
(2):

. The relationship between measured δ29Si and δ 30Si can be used to demonstrate mass dependent fractionation, according to Eq.
(3):

, where z∼0.52 and depends on the ratio of the isotope masses and on whether the fractionation reaction is kinetic or in equilibrium (reviewed by Reynolds et al. Reference Reynolds, Aggarwal, Andre, Baxter, Beucher, Brzezinksi, Engstrom, Georg, Land, Leng, Opfergelt, Rodushkin, Sloane, van der Boorn, Vroon and Cardinal2007).
A previous interlaboratory comparison has been published using three isotopic standards: a rock standard IRMM-018, a “Diatomite” standard, and a highly fractionated SiO2 material, “Big Batch”, originally prepared at the University of California, Santa Barbara (UCSB) by Mark Brzezinksi and Christina de la Rocha (Reynolds et al. Reference Reynolds, Aggarwal, Andre, Baxter, Beucher, Brzezinksi, Engstrom, Georg, Land, Leng, Opfergelt, Rodushkin, Sloane, van der Boorn, Vroon and Cardinal2007). However, IRMM-018 is no longer produced commercially and did not show a good level of reproducibility between research groups, either as a result of isotopic heterogeneity or contamination, so is not a useful reference standard.
Sponge silicon isotopes and deepwater silicic acid
Reconstructing Southern Ocean intermediate and deep Si(OH)4 through time is essential to our understanding of silica cycling, and its potential impact on the carbon cycle. Firstly, diatom blooms rely on upwelling sources of Si(OH)4 because efficient utilization removes almost all of the Si from surface waters (Ragueneau et al. Reference Ragueneau, Tréguer, Leynaert, Anderson, Brzezinksi, Demaster, Dugdale, Dymond, Fischer, Francois, Heinze, Maier-Raimer, Martin-Jezequel, Nelson and Quéguiner2000, Falkowski et al. Reference Falkowski, Katz, Knoll, Quigg, Raven, Schofield and Taylor2004). Secondly, heat transport by the oceans is influenced strongly by high-latitude deepwater formation processes and meridional distribution of deepwater masses. Ocean circulation and biogeographical variations in algal populations results in enriched Si(OH)4 in Antarctic Bottom Water (AABW) compared to North Atlantic Deep Water (NADW) (Garcia et al. Reference Garcia, Locarnini, Boyer and Antonov2006). This difference allows dissolved Si to be used as a tracer of southern component water masses in the Atlantic over 103–104 year timescales. Thirdly, whole ocean changes in Si cycling over long timescales (> 104–105 years) will be reflected in deep water Si(OH)4 concentrations to a greater extent than surface values, which are probably influenced by local processes such as productivity (de la Rocha & Bickle Reference De La Rocha and Bickle2005). The Southern Ocean has been the major sink of opal for the past 2–3 million years, and is a key source area for such palaeoceanographic records (Cortese et al. Reference Cortese, Gersonde, Hillendbrand and Kuhn2004).
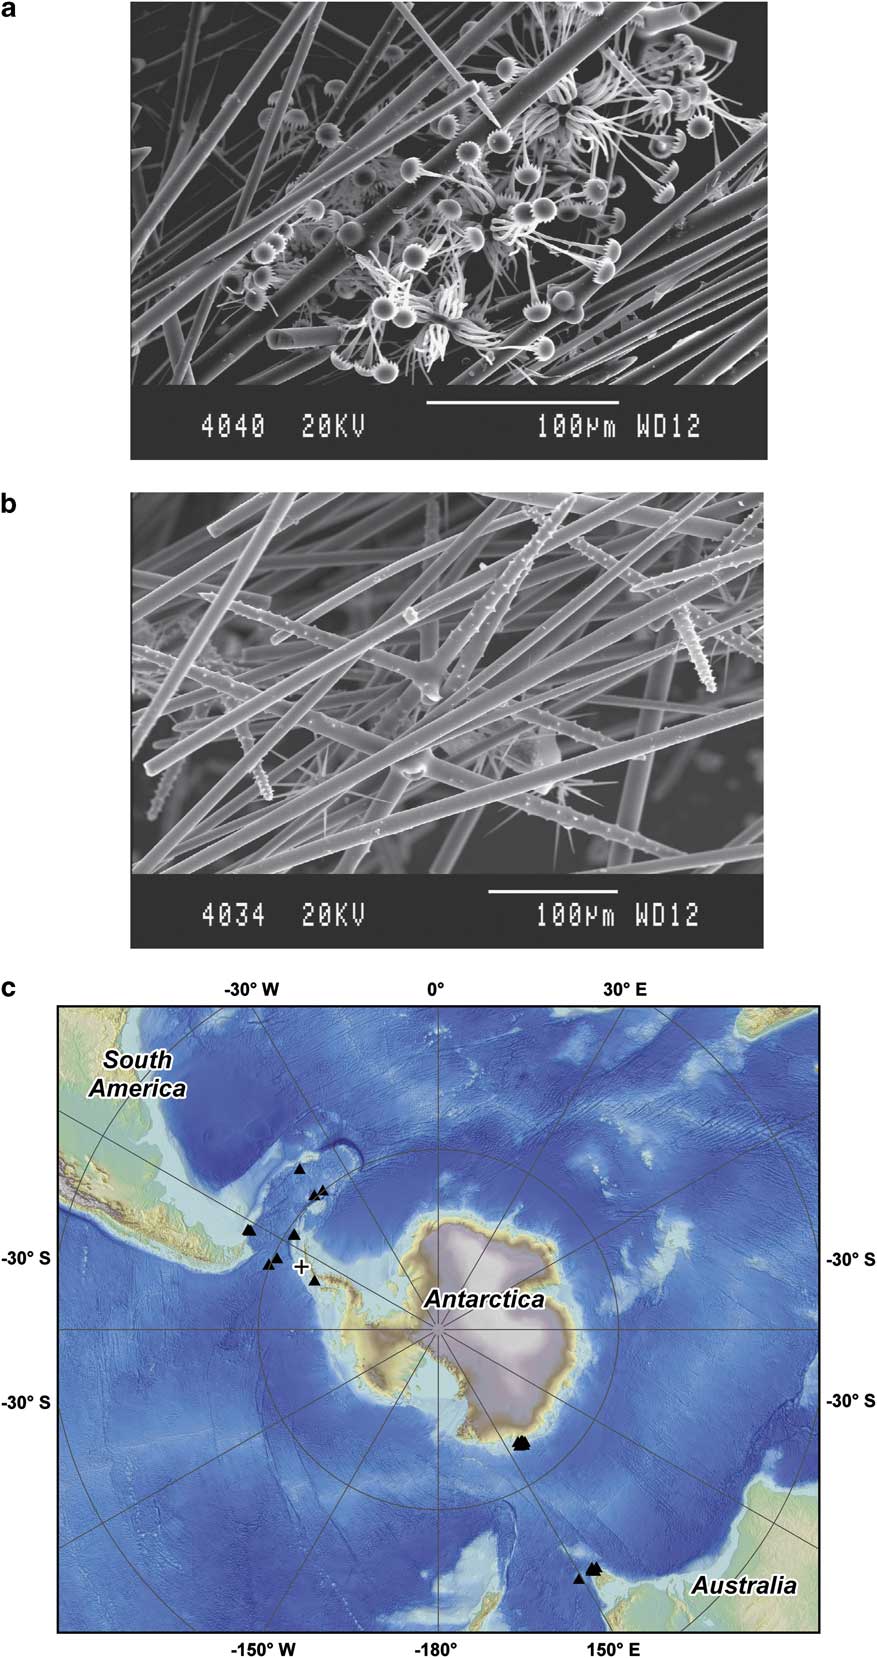
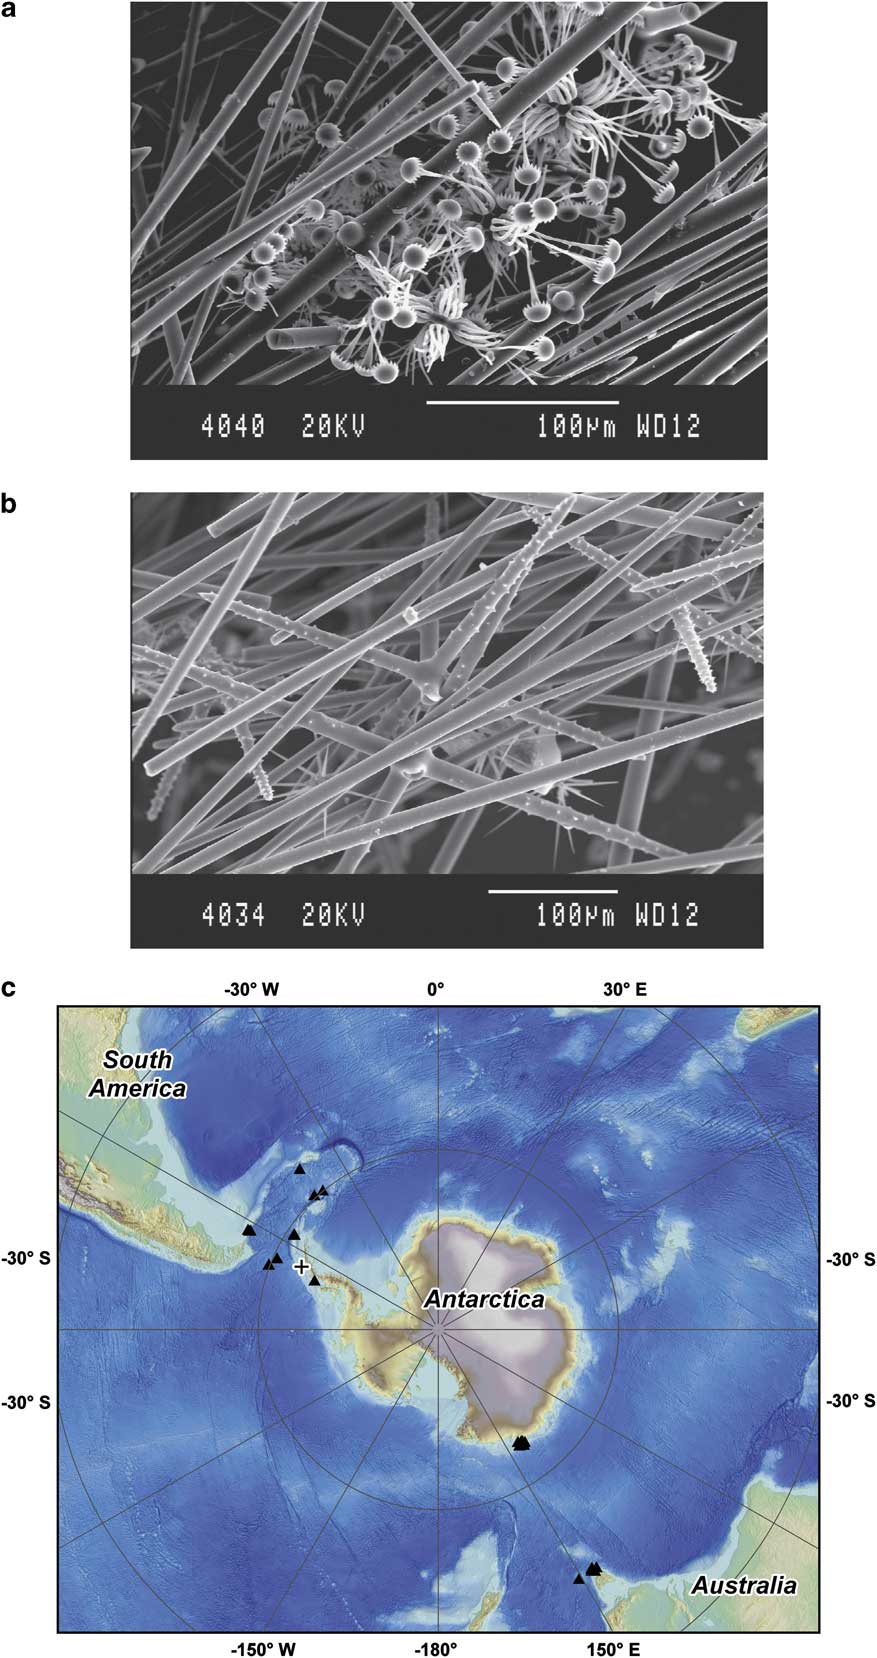
The Si isotopic composition of sponges has been recognized as a potential archive of deepwater Si chemistry (de la Rocha Reference De La Rocha2003, Hendry et al. Reference Hendry, Georg, Rickaby, Robinson and Halliday2010, Wille et al. Reference Wille, Sutton, Ellwood, Sambridge, Maher, Eggins and Kelly2010). Siliceous sponges (Phylum Porifera, Classes Demospongea and Hexactinella) produce needle-like skeletal elements, called spicules, from hydrated amorphous silica. Spicules can be further subdivided into larger megascleres and smaller microscleres (Fig. 1a & b). Uptake of ambient Si(OH)4 occurs via a sodium transporter, which resembles active transporters isolated from other metazoans. The silica deposition occurs about a central organic filament in the axial canal of the filament. Biosilicification is carried out by sclerocyte cells both intra- and extra-cellularly and is controlled by the enzymes silicatein, which promotes condensation reactions, and silicase, which dissolves silica (Uriz et al. Reference Uriz, Turon and Becerro2000, Reference Uriz, Turon, Becerro and Agell2003, Foo et al. Reference Foo, Huang and Kaplan2004, Müller et al. Reference Müller, Schloßmacher, Wang, Boreiko, Brandt, Wolf, Tremel and Schroeder2007). Silicatein is the predominant component of the axial filament and is found on the surface of spicules and in the extra-cellular space, resulting in lamellar growth (Müller et al. Reference Müller, Schloßmacher, Wang, Boreiko, Brandt, Wolf, Tremel and Schroeder2007). During these reactions, sponges fractionate Si isotopes with respect to the ambient Si(OH)4, such that spicules have some of the lightest Si isotopic signatures known in natural systems (de la Rocha Reference De La Rocha2003).
Scanning electron micrographs of sponge spicules: a. Acoelocalyx sp., and b. Rosella sp. c. Map of sample collection area. Black triangles show location of modern sponges from the Scotia Sea/Drake Passage (Hendry et al. Reference Hendry, Georg, Rickaby, Robinson and Halliday2010, this study) and the Pacific Sector (Wille et al. Reference Wille, Sutton, Ellwood, Sambridge, Maher, Eggins and Kelly2010). The cross shows the location off Anvers Island of sponge LMG08, analysed by Hendry et al. (Reference Hendry, Georg, Rickaby, Robinson and Halliday2010) and NIGL/WHOI (this study). Map produced by K. Scanlon, USGS.
With the development of Si isotopes in sponges as a geochemical proxy, it is essential to determine analytical precision and accuracy, and ensure there are no systematic differences between methodologies. Here, we present an interlaboratory comparison of the Si isotopic composition of sponges from the Southern Ocean and the Antarctic Peninsula. We review two independent methods for sample preparation, using three different instruments for Si isotope analysis. We show that sponge Si isotope ratios are homogeneous and influenced strongly by environmental parameters. Further work on the sponge Si isotope uptake and systematics would benefit greatly from a suitable interlaboratory reference standard. Although “Diatomite”, which contains non-opal impurities, and “Big Batch” reproduced well (δ30Si∼+1.27 and -10.48‰ respectively), neither standard has an isotope composition or microstructure similar to sponges (Schroeder et al. Reference Schroeder, Wang, Tremel, Ushijima and Müller2008).
Methods
Sample collection and initial preparation
We collected and analysed modern specimens of sponges from a north–south transect across the Southern Ocean, encompassing a range of Si(OH)4 concentrations (12–120 μM) and depths (300–2500 m). Sponges were collected aboard the RV Nathaniel B. Palmer from sites in the Drake Passage and Scotia Sea (April–May 2008; Fig. 1c). Additional samples were collected from Anvers and Adelaide islands off the West Antarctic Peninsula. Spicules were isolated from organic matter by heating three times in concentrated HNO3 and H2O2 (reagent grade), rinsing each time with 18 MΩ Milli-Q water. Detrital lithogenic grains were then physically removed until visual inspection showed the sample to comprise pure sponge spicules. The spicules were then further chemically cleaned by heating in 50% HNO3 and 10% HCl (in house Teflon distilled) for two hours, followed by five Milli-Q rinses. Subsamples were analysed by three different laboratories using different methods: stepwise fluorination followed by gas-sourced Isotope Ratio Mass Spectrometry (IRMS) at the NERC Isotope Geosciences Laboratory (NIGL; Leng & Sloane Reference Leng and Sloane2008), wet alkaline extraction followed by analysis by NuPlasma Multi-Collector Inductively Coupled Plasma Mass Spectrometer (MC-ICP-MS) at Oxford University (Georg et al. Reference Georg, Reynolds, Frank and Halliday2006, Hendry et al. Reference Hendry, Georg, Rickaby, Robinson and Halliday2010) and wet alkaline extraction followed by analysis by Neptune MC-ICP-MS (Van den Boorn et al. Reference Van den Boorn, Vroon, van Belle, van der Wagt, Schwieters and van Bergen2006, Wille et al. Reference Wille, Sutton, Ellwood, Sambridge, Maher, Eggins and Kelly2010, this study) at Woods Hole Oceanographic Institution (WHOI).
Stepwise fluorination/IRMS (NIGL)
The subsamples were processed using stepwise fluorination, designed for both δ30Si/δ29Si and δ18O analysis of silica, to convert the Si (and O) to a gaseous phase (Leng & Sloane Reference Leng and Sloane2008). First, the samples were dehydrated at 250°C to remove surface and loosely bound water. Secondly, the samples went through a pre-fluorination reaction with a stoichiometric deficient quantity of bromine pentafluoride at low temperature to remove hydroxyl groups and any remaining loosely bound water. Thirdly, the samples were fully fluorinated at 450°C for 12 hours, during which the Si is converted to silicon tetrafluoride (SiF4), which is then measured off-line for 28Si, 29Si and 30Si simultaneously using a Finnegan MAT253 IRMS. Repeat measurements of standards indicate a reproducibility of < 0.24‰ (2 SD) for δ29Si and δ30Si.
Wet alkaline extraction/NuPlasma MC-ICP-MS (Oxford)
The subsamples were dissolved by wet alkaline extraction (Cardinal et al. Reference Cardinal, Savoye, Trull, Dehairs, Kopczynska, Fripiat, Tison and André2007). Briefly, the spicules were dissolved in 4 ml 0.2 M NaOH per mg silica, left at 100°C for three days, and sonicated on a daily basis to aid dissolution. The solutions were acidified with 0.2 M HCl (in house Teflon distilled) to a pH > 2.
The Si concentrations of the dissolved samples and standards were determined using a heteropoly blue photospectrometric method (Ultra Low Range solutions, Hach). Quantitative separation of Si from major ions was achieved using a cation exchange resin (BioRad AG50W-X12; Georg et al. Reference Georg, Reynolds, Frank and Halliday2006). The standard and samples (< 0.4 ml) were introduced to the column, which contained a volume of wet resin at neutral pH suitable for the amount of Na added (0.8 to 1.8 ml). Si(OH)4 is in equilibrium with the anionic silicate species H3SiO4- for the pH range 2–8 (Georg et al. Reference Georg, Reynolds, Frank and Halliday2006), and can simply be eluted with Milli-Q water. Recent studies have shown pH does not affect Si yield or fractionation on the column (Savage et al. Reference Savage, Georg, Armytage, Williams and Halliday2010). Our previous tests have shown this method results in 100% yields for both commercially available Si solutions and dissolved biogenic opal samples (Hendry et al. Reference Hendry, Georg, Rickaby, Robinson and Halliday2010, Hendry unpublished data). There are traces of organic matter bound within biogenic opal, including sponge spicules, which may form small silico-organic complexes that cannot be removed from the Si and may cause instabilities with plasma source mass spectrometry. However, our measurements of the organic content of sponge spicules show the organic content is ∼ 0.1% or lower, and any problems arising from this material will be minimal.
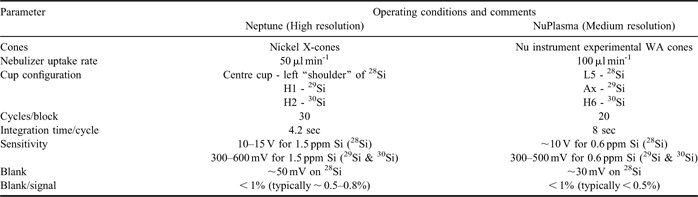
The Si isotope measurements of the Si isotopes (28Si, 29Si and 30Si) use the NuPlasma MC-ICP-MS (University of Oxford), again allowing simultaneous measurement of the different isotopes. The mass spectrometer was operated in medium resolution mode to resolve interferences on masses 28 (e.g. 14N14N+, 12C16O+), 29 (14N15N+, 13C16O+, 12C17O+) and 30 (15N15N+, 13C17O+, 12C18O+). Samples were introduced via a self-aspirating PFA micro concentric nebuliser (ESI) plugged into a Cetac ARIDUS-2 desolvator unit, supplied only with Ar and not N2. Uptake rates varied slightly, but were typically around 100 μl min-1 (Table I). The samples were bracketed with a concentration-matched NBS28 standard (∼600 ppb Si) to correct for mass bias and drift (Georg et al. Reference Georg, Reynolds, Frank and Halliday2006, Reynolds et al. Reference Reynolds, Aggarwal, Andre, Baxter, Beucher, Brzezinksi, Engstrom, Georg, Land, Leng, Opfergelt, Rodushkin, Sloane, van der Boorn, Vroon and Cardinal2007), and isotope ratios calculated according to Eq. (2). Standards were analysed before every batch run to ensure accuracy. Repeat dissolutions and repeat aliquots of the same dissolution indicate a good level of reproducibility around 0.1‰ (2 SD) for δ30Si and 0.2‰ (2 SD) for δ30Si (Hendry et al. Reference Hendry, Georg, Rickaby, Robinson and Halliday2010). Full details of experimental set-up and quality control criteria are published elsewhere (Georg et al. Reference Georg, Halliday, Schauble and Reynolds2007, Savage et al. Reference Savage, Georg, Armytage, Williams and Halliday2010).
Operating conditions of the Neptune MC-ICP-MS at WHOI. Note that the senstitivies reported are for high resolution settings on the Neptune, and medium resolution settings on the NuPlasma.

Wet alkaline extraction/Neptune MC-ICP-MS (WHOI)
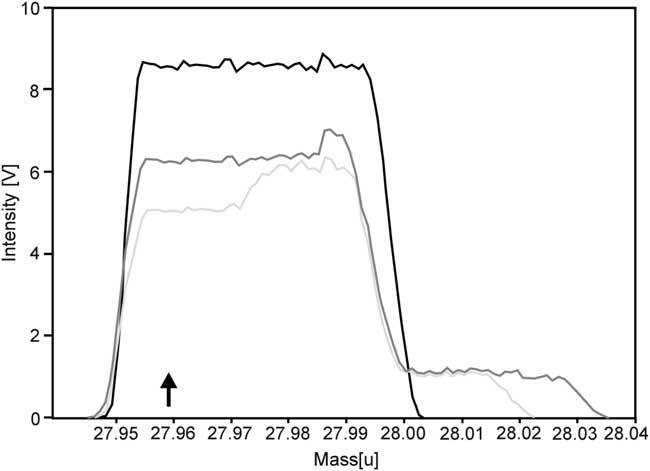
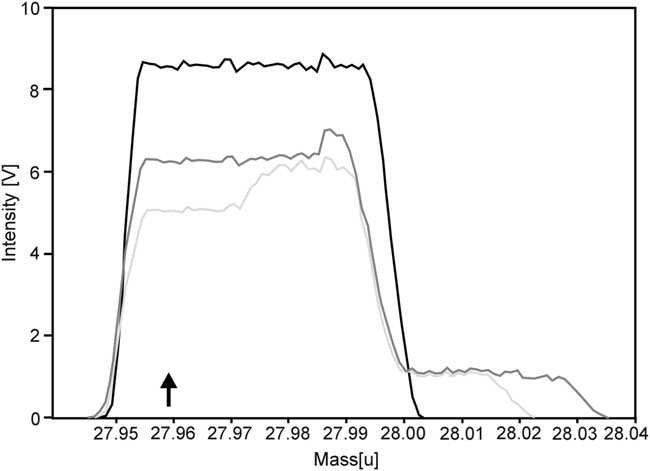
Aliquots of a solution prepared from a sponge collected from Anvers Island off the West Antarctic Peninsula (LMG08), prepared by wet alkaline extraction and column separation as outlined above, were introduced into the Thermo Neptune MC-ICP-MS instrument. The instrument was operated in a dry plasma mode, with the sample introduced via a self-aspirating PFA micro concentric nebuliser, plugged into an ARIDUS-1 (not connected to N2) with an uptake rate of 50 μl min-1, in high-resolution mode to resolve potential interferences as outlined above. The instrument was left to stabilize after plasma ignition for approximately an hour before tuning on a daily basis, during which gas flow and ion optics are optimized for maximum sensitivity and peak shape on 28Si (Fig. 2). Peak centring was carried out on 28Si prior to measurement. Operating conditions are outlined in Table I.
Peak scans for silicon isotopes 28Si (black), 29Si (dark grey) and 30Si (pale grey) in high-resolution and dry plasma mode, obtained with a 1.5 ppm solution of Si in ∼0.05N Teflon-distilled HCl. Note the vertical exaggeration for 29Si (x 13.88) and 30Si (x 16.35). The measurements were carried out on the left side of the peak plateau to avoid the interferences, clearly visible in high-resolution mode (the black arrow shows the position of the magnet).
Mass bias and drift were accounted for by standard-sample bracketing matching samples and bracketing standards. Our initial tests showed intensity matching of bracketing standards and samples of within 20% resulted in acceptable levels of reproducibility for the known reference standards (± 0.15‰ for δ30Si). To provide a conservative limit, the bracketing standards and samples were intensity matched within 15%. The blank is monitored by analysing a 0.05N HCl solution run prior to and after each standard-sample bracket, and is < 1% of the signal (Table I). Blank corrections do not make significant differences to the calculated δ29Si or δ30Si for standards or samples.
Values of δ29Si and δ30Si were calculated offline using Eq. (2), taking an average of the two bracketing standards for each sample. Data that did not meet strict quality control criteria were rejected, meeting guidelines based on Van den Boorn et al. (Reference Van den Boorn, Vroon, van Belle, van der Wagt, Schwieters and van Bergen2006):
a) Initial tests showed that for a standard deviation of greater than 1 x 10⁻⁵ on either 29Si /28Si or 30Si /28Si ratios resulted in an error greater than ∼ 0.2‰ on the resulting δ29Si and δ30Si values, which were generally non-mass dependent. Any samples or bracketing standards run with a standard deviation above this threshold were rejected.
b) If the difference between two successive bracketing standards exceeded 0.4‰ for δ30Si (double the approximate long-term reproducibility 2 SD), the data were rejected.
The mean of all replicates that meet the criteria above (typically n = 3) for each aliquot was calculated and reported relative to NBS28.
Measurement precision was assessed using previously calibrated standards (“Diatomite” and “Big Batch”; Reynolds et al. Reference Reynolds, Aggarwal, Andre, Baxter, Beucher, Brzezinksi, Engstrom, Georg, Land, Leng, Opfergelt, Rodushkin, Sloane, van der Boorn, Vroon and Cardinal2007). Diatomite showed a good level of reproducibility, with δ29Si ∼ 0.66‰ and δ30Si ∼ 1.26‰ depending on whether all measurements are included, or mean values of each aliquot undergoing independent chemical separation (Table II). Big Batch showed greater variability (Table II), appearing to be more sensitive to drift due to larger fractionation, perhaps as a result of matrix effects from its high molybdenum content (Reynolds et al. Reference Reynolds, Aggarwal, Andre, Baxter, Beucher, Brzezinksi, Engstrom, Georg, Land, Leng, Opfergelt, Rodushkin, Sloane, van der Boorn, Vroon and Cardinal2007). Repeat measurements of sample aliquots, within and between runs, show typical variability < 0.1‰ for δ29Si and δ30Si. However, the sample size of measurements for each aliquot is small (n ∼ 3), such that calculating standard deviations is not valid, and so the long-term reproducibility for diatomite is used as a more conservative estimate of total error (Table II).
δ30Si measurements of standards, comparing a previous interlaboratory comparison (Reynolds et al. Reference Reynolds, Aggarwal, Andre, Baxter, Beucher, Brzezinksi, Engstrom, Georg, Land, Leng, Opfergelt, Rodushkin, Sloane, van der Boorn, Vroon and Cardinal2007), and measurements made at WHOI (this study). Numbers in parentheses show 1SD.

All three methods show a very similar long-term reproducibility (2 SD ∼ 0.2‰ for δ30Si), in agreement with the finding of the previous interlaboratory calibration of standards that differences between reported results should be limited to 0.2‰ for δ30Si (Reynolds et al. Reference Reynolds, Aggarwal, Andre, Baxter, Beucher, Brzezinksi, Engstrom, Georg, Land, Leng, Opfergelt, Rodushkin, Sloane, van der Boorn, Vroon and Cardinal2007).
Results
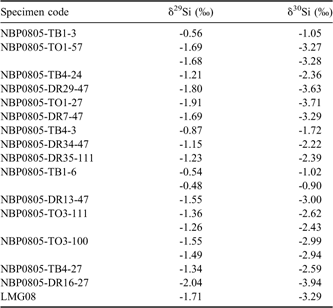
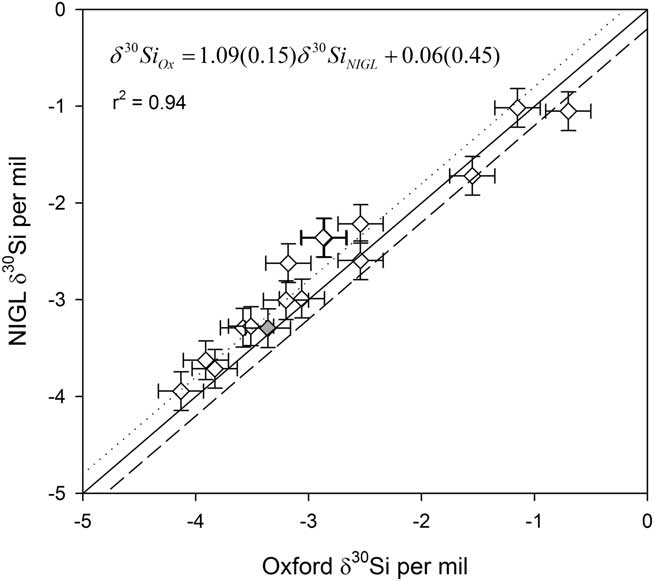
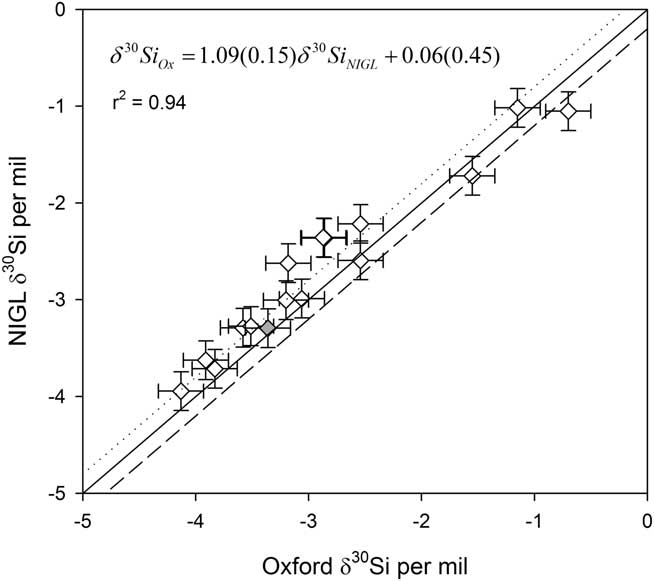
The δ30Si values of sixteen modern sponges measured at NIGL varied from approximately -0.5 to -4‰ (Table III), all in range of other published values (de la Rocha Reference De La Rocha2003, Hendry et al. Reference Hendry, Georg, Rickaby, Robinson and Halliday2010, Wille et al. Reference Wille, Sutton, Ellwood, Sambridge, Maher, Eggins and Kelly2010). Subsamples from these specimens had been previously analysed at Oxford (previously reported in Hendry et al. Reference Hendry, Georg, Rickaby, Robinson and Halliday2010). Note that although the spicules were not homogenized prior to analysis, subsample measurements of any particular specimen are in good agreement (Fig. 3; regressing Oxford data on NIGL data yields r = 0.97, slope = 1.09, intercept = 0.06‰). Over 80% of the specimens yielded δ30Si values that agreed within ± 0.2‰, (i.e. agreement within analytical error), and all agreed within ± 0.3‰ (including OT3-111 and DR-111, two specimens of the same species of demosponge). Repeat subsamples analysed at NIGL agreed within ± 0.1‰ for δ30Si (Table III).
Sponge silicon isotopes measured by IRMS at NIGL. For more information about the specimens, see Hendry et al. Reference Hendry, Georg, Rickaby, Robinson and Halliday2010.

Interlaboratory comparison of sponge silicon isotopes, measured by NuPlasma MC-ICP-MS at Oxford (Hendry et al. Reference Hendry, Georg, Rickaby, Robinson and Halliday2010) and Finnegan MAT253 at NIGL (this study). Error bars show long-term reproducibility (2 SD). Note that measurements were made on non-homogenized subsamples of sponge specimens, explaining the small variations between laboratories. The grey diamond shows sponge LMG08. Solid line shows 1:1, dashed lines show ± 0.2‰.
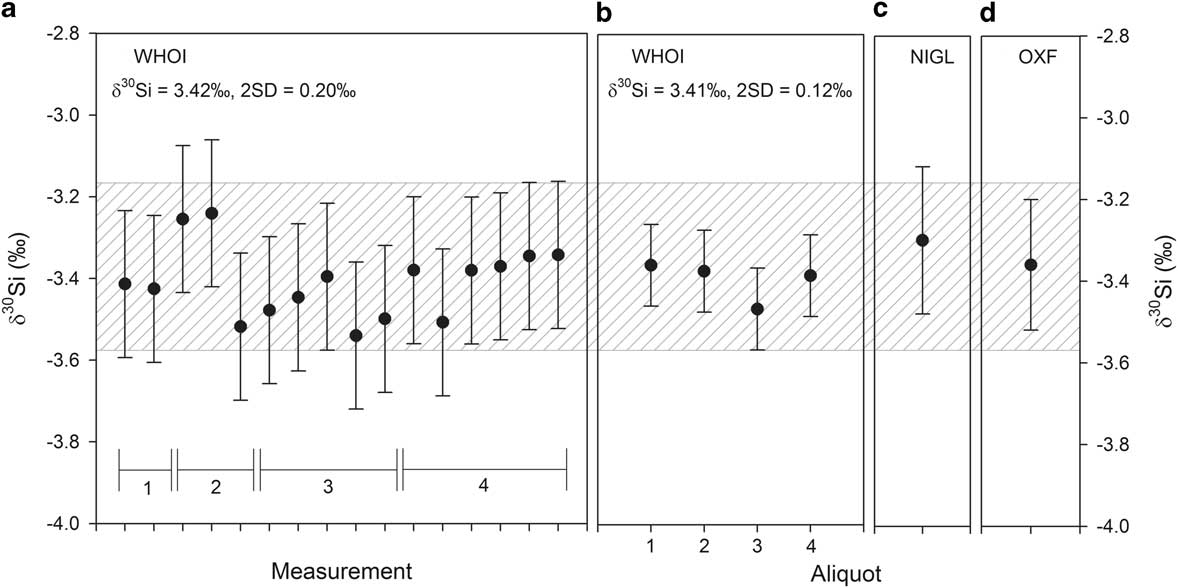
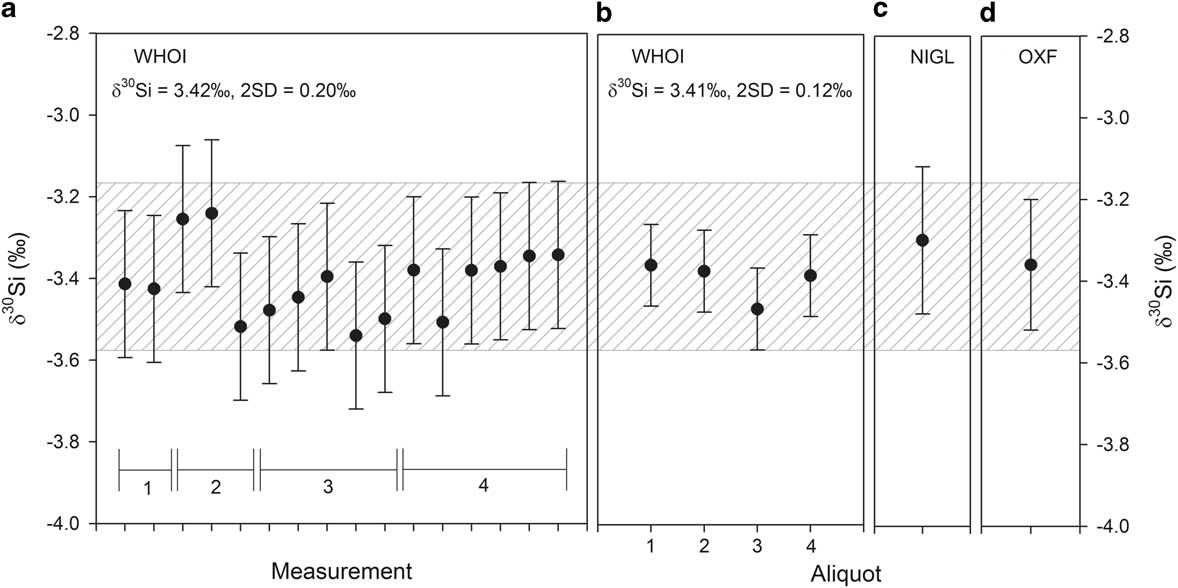
Subsamples from a sponge collected near the Antarctic Peninsula, LMG08, were measured by Oxford (Hendry et al. Reference Hendry, Georg, Rickaby, Robinson and Halliday2010), NIGL and WHOI (both this study), and also showed a high level of reproducibility (Fig. 4; Oxford δ30Si = -3.36 ± 0.16‰ (one aliquot with repeat measurements; n = 8), NIGL (one aliquot) δ30Si = -3.3‰, WHOI (all measurements, n = 16) = -3.41 ± 0.18‰; WHOI (mean values for independent aliquots, n = 4) δ30Si = -3.40 ± 0.10‰, for 2 SD).
Repeat measurements of different subsamples of sponge LMG08, collected near Anvers Island off the West Antarctic Peninsula. Different aliquots of a subsample were measured at WHOI on different occasions over four months. a. All measurements made at WHOI (error bars show 2 SD), b. the mean value for each aliquot measured at WHOI (error bars show 2 SD), c. subsample measure at NIGL (error bars show long-term reproducibility 2 SD), d. mean value for the subsample measured in Oxford (mean of eight repeat measurements, error bars show 2 SD). The grey hatched area shows the mean value for all measurements (± 0.2‰).
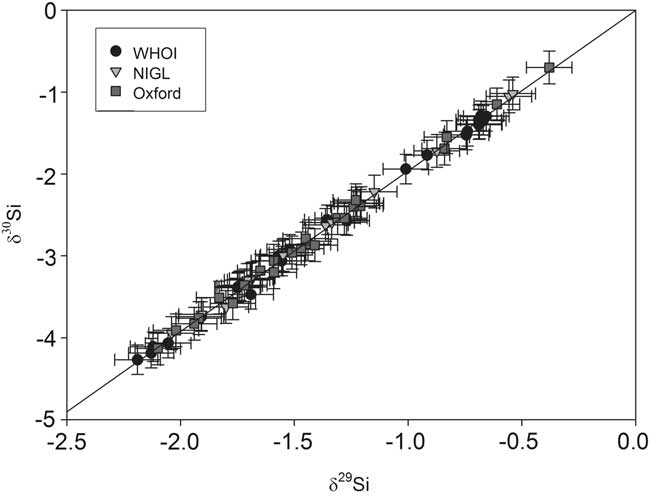
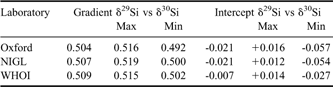
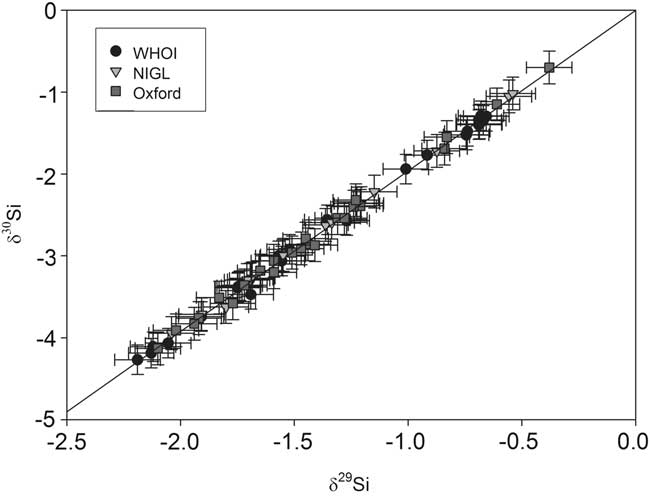
All three laboratories show mass dependent measurements for sponge samples, with the slope of the three isotope plot of δ29Si vs δ30Si ∼ 0.51 (Fig. 5, Table IV, see discussion below).
Three-isotope plot of all the silicon isotope measurements of all sponge samples analysed at the three laboratories. The slope of the plot is consistent with mass dependent fractionation, such that δ29Si ∼ 0.51δ30Si. Error bars show long-term reproducibility (2 SD). The line shows mass dependent fractionation with slope 0.51.
A comparison of the linear regressions of δ29Si on δ30Si at the three laboratories (model II linear regression, calculated using R, showing 95% confidence intervals). Note that all laboratories show results consistent with kinetic fractionation (gradient = 0.505 or 0.509); only one laboratory shows results consistent also with equilibrium fractionation (gradient = 0.518).

Discussion
Isotopic homogeneity in sponges
The agreement between the different laboratories, utilizing different preparation and measurement techniques, indicates that δ30Si measurements obtained for Southern Ocean sponges are robust and there is no method dependent fractionation of Si isotopes. Furthermore, given that the subsamples were not taken from a homogenized mass of spicules, our data also indicate there is a high level of homogeneity within Southern Ocean sponges. There are other lines of evidence for isotopic homogeneity within specimens of Southern Ocean sponge:
a) Spicules taken from external layers (dermal) and internal layers (perenchymal) from a sponge collected in the Drake Passage have, within error, the same isotopic composition (dermal δ30Si = -2.87‰ and perenchymal δ30Si = -2.96‰; Hendry et al. Reference Hendry, Georg, Rickaby, Robinson and Halliday2010).
b) Core top measurements of megaspciules picked from Scotia Sea sediments (δ30Si ∼ -3.9‰) are within error of modern sponges living near to the core site (δ30Si ∼ -4.1‰; Hendry et al. Reference Hendry, Georg, Rickaby, Robinson and Halliday2010), comprising both mega and microspicules (Fig. 1a).
Kinetic uptake of Si by sponges
The relationship between ambient Si(OH)4 and isotopic composition of sponges suggests a growth rate effect (Hendry et al. Reference Hendry, Georg, Rickaby, Robinson and Halliday2010). Kinetic uptake of Si has been observed during sponge growth (Frøhlich & Barthel 1997) and supported by the highly fractionated nature of sponge Si isotopes, and by theoretical isotopic fractionation models (Wille et al. Reference Wille, Sutton, Ellwood, Sambridge, Maher, Eggins and Kelly2010). The relationship between δ29Si and δ30Si can be used to determine whether kinetic or equilibrium fractionation has occurred: equilibrium fractionation yields a slope on a three-isotope plot (Fig. 5) of 0.518 whereas kinetic fractionation results in slopes of either 0.509 or 0.505 for Si atoms and SiO2 respectively (Reynolds et al. Reference Reynolds, Aggarwal, Andre, Baxter, Beucher, Brzezinksi, Engstrom, Georg, Land, Leng, Opfergelt, Rodushkin, Sloane, van der Boorn, Vroon and Cardinal2007). Data from all three laboratories are consistent with kinetic fractionation (either Si or SiO2, Reynolds et al. Reference Reynolds, Aggarwal, Andre, Baxter, Beucher, Brzezinksi, Engstrom, Georg, Land, Leng, Opfergelt, Rodushkin, Sloane, van der Boorn, Vroon and Cardinal2007) within 95% confidence intervals calculated by model II linear regressions (Table IV), whereas only data from one laboratory is within range of equilibrium fractionation. This supports the notion of kinetic uptake of Si by deep sea sponges in the Southern Ocean.
Use of sponge spicules as geochemical archives
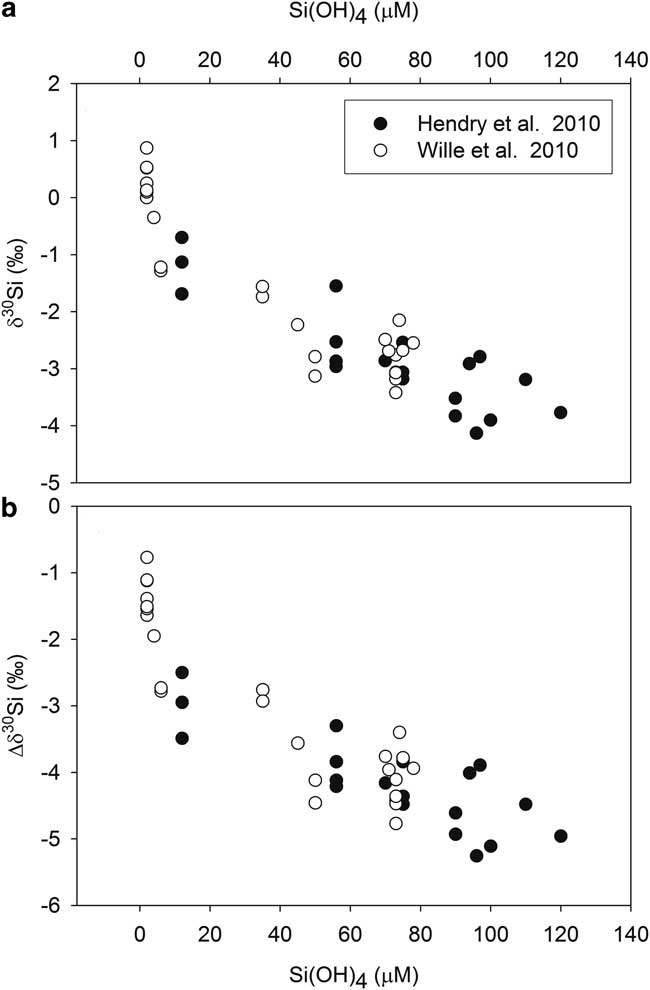
Understanding the impact of surface biological production on carbon export in the past relies on the reconstruction of the nutrient supply from upwelling deep waters, both within the Southern Ocean and further afield. Sponges are an ideal marine geochemical archive of deepwater nutrients, given their ubiquitous distribution on the oceans. We confirm that Antarctic sponge Si isotopic composition show a robust relationship with ambient Si(OH)4, are internally homogeneous, and measurements are reproducible irrespective of preparation and analytical method. Two independent calibrations, produced by different laboratories, show ambient Si(OH)4 is the dominant control over both the Si isotopic composition of, and fractionation by, sponges collected in different sectors of the Southern Ocean (Hendry et al. Reference Hendry, Georg, Rickaby, Robinson and Halliday2010, Wille et al. Reference Wille, Sutton, Ellwood, Sambridge, Maher, Eggins and Kelly2010; Figs 1c & 6). There is no consistent species specific offset in isotopic composition or fractionation: different species from the same site show similar isotopic composition and two specimens of the same species from different Si(OH)4 environments show different isotopic compositions (Hendry et al. Reference Hendry, Georg, Rickaby, Robinson and Halliday2010). There is no evidence for a significant influence of temperature, pH, or salinity on isotopic fractionation (Hendry et al. Reference Hendry, Georg, Rickaby, Robinson and Halliday2010, Wille et al. Reference Wille, Sutton, Ellwood, Sambridge, Maher, Eggins and Kelly2010). The scatter in the Si(OH)4–δ30Si calibration, which may reflect secondary vital effects, results in an uncertainty of any reconstructing Si(OH)4 concentration of approximately ± 20 μM (Hendry et al. Reference Hendry, Georg, Rickaby, Robinson and Halliday2010).
Two independent studies of Southern Ocean sponge silicon isotopes from the Drake Passage/Scotia Sea (Fig. 1c; Hendry et al. Reference Hendry, Georg, Rickaby, Robinson and Halliday2010) and the Pacific Sector (Wille et al. Reference Wille, Sutton, Ellwood, Sambridge, Maher, Eggins and Kelly2010). a. The relationship between the sponge silicon isotope composition and ambient silicic acid, b. the relationship between the fractionation factor, Δδ30Si, defined as the difference between the isotopic composition of the sponge and ambient seawater: 
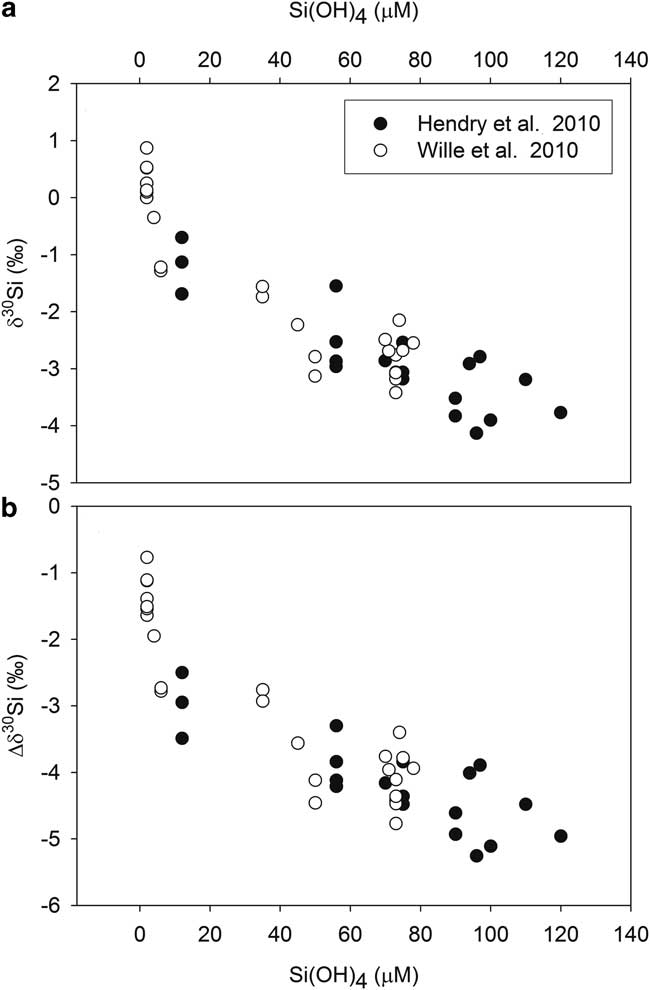
The relationship between Si(OH)4 and δ30Si from the two calibrations agree well between Si(OH)4 concentrations of ∼ 5 and 80 μM. However, at concentrations ∼ 2 μM, only sampled by one calibration, sponge δ30Si become isotopically heavier than expected, suggesting either an exponential relationship with Si(OH)4 concentration (Wille et al. Reference Wille, Sutton, Ellwood, Sambridge, Maher, Eggins and Kelly2010) or a non-linearity arising from physiological stress under low Si. Given the scatter in the calibration, a simple linear fit between δ30Si and Si(OH)4 is likely adequate for most applications; for shallow water environments experiencing low Si(OH)4, an exponential fit may be appropriate. Further work is required to validate this calibration in other ocean basins, experiencing different nutrient regimes and physical environmental parameters. Culturing studies growing sponges under extreme concentrations of Si(OH)4 (less than 5 μM and greater than 120 μM) may also elucidate the linear vs exponential nature of the relationship between Si(OH)4 and δ30Si, and resolve the cause of scatter in the calibrations.
Sponge δ 29Si and δ 30Si standard
The isotopic homogeneity in sponges makes them an ideal target for a reference standard, which would be particularly valuable should sponge spicules become a more commonly used geochemical archive. The sponge LMG08 has now been analysed by three laboratories, using two different preparation methods and three different instruments, and yielded (within error) the same value (mean δ29Si value from the three laboratories = -1.72 ± 0.01‰, mean δ29Si value of all measurements = -1.72‰, 2 SD = 0.08‰; mean δ30Si value from the three independent laboratories = -3.35 ± 0.06‰, mean δ30Si value of all measurements = -3.37‰, 2 SD = 0.17‰; Fig. 4). Additional subsamples are available from the authors for future interlaboratory tests.
Conclusion
The Southern Ocean is an important location for studying deepwater Si cycling because of the regional importance of global biological productivity and its sensitivity to well documented proximal climatic changes. Sponge spicule δ29Si and δ30Si are promising new proxies for past deepwater silicic acid concentrations, and Southern Ocean downcore records of spicules could be applied to a wide range of climatic and palaeoceanographic questions. We show here that Si isotopic measurements of Antarctic sponge spicules are robust and reproducible, confirming that the overriding control over silicon isotopes is the ambient Si(OH)4 concentrations in which the sponges grow. The relationship between δ29Si and δ30Si is consistent with kinetic fractionation during sponge growth. Lastly, we suggest Southern Ocean sponges would act as an ideal new standard for future spicule analyses.
Acknowledgements
The authors would like to thank the captain and crew of the RV Nathaniel B. Palmer (cruise NBP0805; Program Manager Thomas Wagner). Thanks also to Rhian Waller (University of Hawaii), Laura Schejter (INIDEP, Argentina), Jade Berman (University of Victoria, Wellington) and Andy Clarke (British Antarctic Survey) for sponge samples and help with identification. Thanks to Maureen Auro and Scot Birdwhistell (WHOI) for assistance in the laboratory, and Tim Eglinton, Daniel Montlucon and Carl Johnson for analysis of spicule organic matter content. Thanks to David Walton, Michael Ellwood, Martin Wille and an anonymous reviewer for constructive comments on the manuscript. Cruise NBP0805 was funded by NSF Office of Polar Programs (OPP) Antarctic Sciences (grant number ANT-0636787). KH is funded by a Doherty Postdoctoral Scholarship at WHOI, and the work has also been funded by the Natural Environment Research Council (NERC) grant NE/F005296/1 and an Antarctic Science Bursary. The authors declare no competing financial interests.