INTRODUCTION
The Stroop Test was introduced in a seminal paper published by J. Ridley Stroop in 1935 and has since become a mainstay in neuropsychological assessment. The paper was the first to feature the now familiar Stroop stimuli consisting of words printed in incongruent colors (e.g., the word “RED” printed with blue letters). Stroop (Reference Stroop1935) was interested in the interference posed by having to suppress the more automatic process (reading the words) in favor of naming the color of the letters. His paper also included the two “control” trials commonly used in the present Stroop Test, that is, reading the same color words written with black letters and naming the colors of rectangles or other symbols. Although these preliminary trials were used in separate experiments in the paper, the common practice today is to include both word reading (W) and color naming (C) as preliminary trials before having the subject name the color of the letters in a set of Stroop stimuli (CW).
The neuropsychological properties of the Stroop Test were examined in a 1965 paper by Jensen (Reference Jensen1965) who identified three factors underlying subjects’ performance. One factor involved general speed of processing that Jensen claimed was best evaluated by the word reading score alone (i.e., W). Another factor, characterized as “color difficulty,” involved the decrease in the rate at which subjects could name colors after accounting for their overall speed at reading words. Jensen suggested that this factor was best reflected by the ratio between the color naming score and the sum of the color naming and word reading scores [i.e., C/(C + W)]. The third factor was the classic “interference” component of the Stroop Test, the added difficulty in naming the color of the printed letters for incongruent Stroop stimuli beyond that of simply naming the colors on nonword stimuli. According to Jensen, this factor was best evaluated by the simple difference between subjects’ performance on the Stroop stimuli and their performance on the color naming trial (i.e., CW − C). Jensen concluded that the processing speed, color difficulty, and interference factors captured by the three recommended scores “contained all the essential information that can be derived from the Stroop Test” (Jensen, Reference Jensen1965, p. 407).
Golden’s (Reference Golden1978) subsequent publication of the Stroop Color and Word Test as a standardized neuropsychological instrument formalized some procedural variations that had already begun to appear in the literature. The most important of these involved the recording of the number of stimuli completed during a fixed time interval, instead of the length of time required to complete a predetermined number of stimuli. One must be careful to note whether performance in any given study has been recorded as the time to completion or the number of items completed; scoring formulas must be converted accordingly. For example, with item completion scores, the formulas for Jensen’s color difficulty and interference factors must be converted to (C + W)/C and C − CW, respectively.
Golden also proposed an alternative formula for scoring interference by contrasting the actual score on the CW trial with a predicted score based on the subject’s performance on both the preliminary trials. The predicted score is given by (C × W)/(C + W) and encompasses the assumption that a subject’s performance on each Stroop item is an additive function of the time to read a word and the time to name a color.
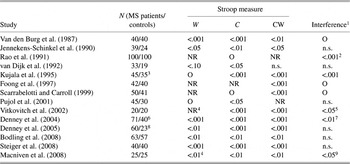
As summarized in Table 1, numerous studies have reported differences in multiple sclerosis (MS) patients’ performance on the Stroop compared to controls, but many of these studies have failed to include all three trials of the Stroop, and the use of abbreviated versions of the test has led to different interpretations of the results obtained. Investigators who have focused exclusively on performance on the Stroop items themselves (Scarrabelotti & Carroll, Reference Scarrabelotti and Carroll1999) or on interference scores (Rao et al., Reference Rao, Leo, Bernardin and Unverzagt1991) have concluded that MS patients exhibit deficits in selective attention or executive function (Kujala et al., Reference Kujala, Portin, Revonsuo and Ruutiainen1995; Rao et al., Reference Rao, Leo, Bernardin and Unverzagt1991; Vitkovitch et al., Reference Vitkovitch, Bishop, Dancey and Richards2002). But numerous studies (Bodling et al., Reference Bodling, Denney and Lynch2008; Denney et al., Reference Denney, Lynch, Parmenter and Horne2004, Reference Denney, Sworowski and Lynch2005; van Dijk et al., Reference van Dijk, Jennekens-Schindel, Caekebeke and Zwinderman1992; Jennekens-Schinkel et al., Reference Jennekens-Schinkel, Lanser, van der Velde and Sanders1990; Kujala et al., Reference Kujala, Portin, Revonsuo and Ruutiainen1995; Macniven et al., Reference Macniven, Davis, Ho, Bradshaw, Szabadi and Constantinescu2008; Pujol et al., Reference Pujol, Vendrell, Deus, Junque, Bello, Marti-Vilalta and Capdevila2001; Steiger et al., Reference Steiger, Denney and Lynch2008; Van den Burg et al., Reference Van den Burg, van Zomeren, Minderhoud, Prange and Meijer1987; Vitkovitch et al., Reference Vitkovitch, Bishop, Dancey and Richards2002) have shown differences between MS patients and controls on preliminary trials of the Stroop and not just on the Stroop stimuli alone. In these latter studies, differences on interference measures are often nonsignificant (Bodling et al., Reference Bodling, Denney and Lynch2008; Denney et al., Reference Denney, Sworowski and Lynch2005; van Dijk et al., Reference van Dijk, Jennekens-Schindel, Caekebeke and Zwinderman1992; Jennekens-Schinkel et al., Reference Jennekens-Schinkel, Lanser, van der Velde and Sanders1990; Pujol et al., Reference Pujol, Vendrell, Deus, Junque, Bello, Marti-Vilalta and Capdevila2001; Steiger et al., Reference Steiger, Denney and Lynch2008) or have notably smaller effect sizes than the difference on any single trial composing the Stroop (Denney et al., Reference Denney, Lynch, Parmenter and Horne2004; Macniven et al., Reference Macniven, Davis, Ho, Bradshaw, Szabadi and Constantinescu2008; Vitkovitch et al., Reference Vitkovitch, Bishop, Dancey and Richards2002). In these studies, MS patients’ poorer performance is often attributed to a general slowing in processing speed. The problem of interpretation is compounded by the fact that interference scores arrived at through the formulas recommended by Jensen and Golden can be seriously distorted by differences in processing speed, as the present paper will show. Three alternative approaches are presented that do a far better job of correcting for differences in processing speed and thus help clarify the true source of the differences between MS patients and controls on this classic neuropsychological test.
Studies examining MS patients’ performance on the Stroop Test

Note
NR, not reported; the measure was included in the study, but no results pertaining to it were reported. O, omitted; the measure was not included in the study. n.s., no significant difference found between patients and controls.
1 Interference measured as the difference between CW and C, unless otherwise specified.
2 Interference measured as the difference between CW and W.
3 Differences between patients and controls limited only to a subset of patients with evidence of cognitive impairment.
4 Stimuli were color words printed in congruent colors.
5 Relative interference measured by (CW − C)/C.
6 Data reanalyzed by collapsing across subtypes of MS patients.
7 Interference measured by Golden’s (Reference Golden1978) formula: [(W × C) / (W + C)] − CW.
8 Data reanalyzed by collapsing across subtypes of MS patients and eliminating the sample of patients with rheumatoid arthritis.
9 Relative interference measured by (CW − C)/C; interference difference (CW − C) was also significant at p < .01.
METHODS
The samples featured in the present investigation were compiled from five previous studies (Bodling et al., Reference Bodling, Denney and Lynch2008; Denney et al., Reference Denney, Lynch, Parmenter and Horne2004; Lynch et al., Reference Lynch, Dickerson and Denney2007; Parmenter et al., Reference Parmenter, Denney and Lynch2003; Steiger et al., Reference Steiger, Denney and Lynch2008) pertaining to the impact of MS on cognitive performance. All five studies were approved by the Human Subjects Committee of the University of Kansas Medical Center and employed the same computerized version of the Stroop Test as part of a larger battery of neuropsychological tests. The other tests in the battery varied between studies, as did the position of the Stroop Test in the overall sequence of tests. Subjects evaluated their experience with fatigue and depression during the preceding week by completing the Fatigue Severity Scale (Krupp et al., Reference Krupp, LaRocca, Muir-Nash and Steinberg1989) and the Center for Epidemiologic Studies-Depression Scale (Radloff, Reference Radloff1977). Most of the subjects were tested in the clinic, but about 30% of both the patients and the controls were tested in their homes.
Research Participants
The subjects consisted of 248 patients with clinically definite MS and 178 healthy controls. All the patients had been under the care of the same neurologist (S.G.L.) for at least 1 year. They were apprised of the study during the course of their regular clinic appointment, and if they consented to participate, disability assessment was completed with the Expanded Disability Status Scale (EDSS: Kurtzke, Reference Kurtzke1983) during the course of this appointment. Patients with a history of drug or alcohol abuse, psychiatric disorders or mental retardation, traumatic head injury, or neurological disorders other than MS were excluded. Likewise, patients judged too intellectually impaired to fully comprehend the instructions for the cognitive tests or the questionnaires were excluded. This judgment was made on the basis of the neurologist’s clinical experience with her patient; formal mental status testing was not performed as part of this study. The patients ranged in age from 18 to 74 years (M = 45.1, SD = 9.7) and had from 12 to 20 years of education (M = 15.5, SD = 2.3). Length of illness ranged from 1 to 37 years (M = 9.3, SD = 7.0), and disability ratings on the EDSS ranged from 0 to 8 (median = 3.0). The subtypes of MS represented in this sample were 182 (73.4%) with relapsing–remitting, 32 (12.9%) with primary progressive, and 34 (13.7%) with secondary progressive MS.
Control subjects were recruited through newspaper ads, posters, and contacts with personnel at the medical center. Individuals who had a history of drug or alcohol abuse, traumatic head injury, psychiatric disorders or mental retardation; had any current medical condition; or were taking any continuous medications other than vitamin and mineral supplements, birth control, and low-dose aspirin were excluded. Controls subjects ranged from 23 to 70 years of age (M = 44.0, SD = 10.3) and had from 12 to 24 years of education (M = 16.6, SD = 2.5).
Measures
The Stroop Test
The same computerized version of the Stroop Test was used in all five studies from which the present data were compiled. The test was administered using a laptop computer with a 14-inch screen and consisted of three 60-s trials during which the subject first read color words (RED, GREEN, BLUE, and YELLOW) written in black letters (word reading), then named the color of a row of four Xs (color naming), and finally, named the color of the letters of color words printed in different colors (color–word naming). In the color–word naming trial, all the stimuli were incongruent (e.g., the word “GREEN” printed in blue letters). The stimulus appeared in the center of the computer screen. The subject gave a verbal response to the stimulus (i.e., read the word or named the color), and the experimenter pressed the space bar to display the next stimulus. A brief, eight-stimulus practice set was presented before the start of each trial.
Prior to each trial, the subject was given the following instruction: “Work quickly but try not to make any mistakes. If you do make an error, try not to correct it. Just go on to the next item.” Consistent with these instructions, the examiner was trained to act like a voice-activated relay, pressing the space bar regardless of the subject’s response. The computer timed the trial and recorded the total number of stimuli completed during the trial. Errors occur rarely in this task and were not recorded in any of the compiled studies.
Many of the scores on the Stroop examined here derived from Jensen’s (Reference Jensen1965) work, although formulas were transposed for scores involving the number of items completed instead of time to completion. Jensen suggested the word reading score (W) was the best measure of processing speed, but the other individual trial scores were also considered as measures of this attribute, as was the sum of the two preliminary Stroop trials (W + C). Jensen’s recommended scores for measuring color difficulty [C/(C + W)] and interference (C − CW) were also used. Golden’s (Reference Golden1978) interference score was examined, along with a relative interference score [(C − CW)/C] featured in studies by Macniven et al. (Reference Macniven, Davis, Ho, Bradshaw, Szabadi and Constantinescu2008) and Vitkovitch et al. (Reference Vitkovitch, Bishop, Dancey and Richards2002) and a ratio interference score (CW/C) recommended by Lansbergen et al. (Reference Lansbergen, Kenemans and van Engeland2007). Finally, Capitani et al. (Reference Capitani, Laiacona, Barbarotto and Cossa1999) recommended using the color naming score (C) as a covariate when examining group differences on the color–word naming score (CW). Based on this suggestion, we included a residualized interference score, computed by regressing CW on C, obtaining the unstandardized residual score for each subject, and subtracting this score from the overall sample mean on CW.
RESULTS
Preliminary Comparisons and Statistical Considerations
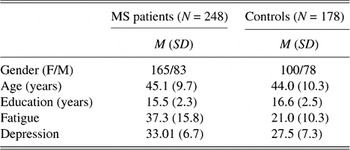
Table 2 compares the patient and control groups on the demographic and questionnaire variables. The groups did not differ significantly in age (t = 1.1, df = 421, p = .26). However, there was a larger proportion of females in the patient group (Fisher’s Exact Test: p = .03), and patients had fewer years of education than the controls (t = 4.6, df = 424, p < .001). All comparisons between patients and controls on the Stroop were adjusted for these differences by including gender, age, and education along with the dichotomous variable representing group (i.e., 0 = control and 1 = MS patient) as predictor variables in regression analyses applied to each score (Model 1).
Demographic and self-report characteristics of the patient and control groups

Patients also had higher scores on both fatigue (t = 12.1, df = 420, p < .001) and depression (t = 6.4, df = 418, p < .001). These differences also required consideration when comparing the groups’ performance on the Stroop. However, because elevated scores on fatigue and depression are inherent features of MS and not merely sampling differences that occurred when patients and controls were recruited to the study, we chose to consider the contributions of these factors to the differences in cognitive performance with separate analyses following those conforming to Model 1. The second regression analysis (Model 2) included fatigue and depression along with the predictors used in Model 1.
Comparisons Between MS Patients and Controls on the Stroop Test
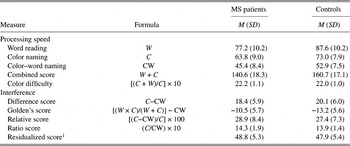
Means and SD for patients and controls on each score derived from the Stroop are shown in Table 3. The results when these scores were analyzed using both Model 1 and Model 2 are presented in Table 4. Age effects as well as group effects are presented in Table 4; the other predictors included in the models were of secondary interest and are therefore omitted. Gender (males > females; β = .094, p = .051) and education (β = .144, p < .004) were the only predictors related to color difficulty. Given the focus of the study on cognitive differences between patients and controls, color difficulty scores are not considered further.
Comparison between patients and controls on various Stroop scores

1 Residualized interference score found by regressing CW on C and subtracting the unstandardized residual for each subject from the overall sample mean for CW (M = 48.41).
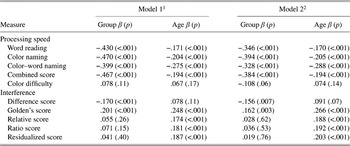
Group and age effects for Stroop scores regressed with Model 1 and Model 2

1 Predictors in Model 1 were group (0 = control and 1 = MS patient), age, education, and gender.
2 Model 2 included fatigue and depression scores as well as the predictors used in Model 1.
For each of the four measures of processing speed, the pattern of results was the same: Both group and age were significant predictors (all ps < .001) of these scores. The color naming score (C) and the combined score (W + C) had the strongest associations with the grouping variable. The color–word naming score (CW) had the weakest association with this variable, indicating that a factor other than processing speed affected performance on Trial 3, diluting its effectiveness in distinguishing MS patients from controls. Obviously, the additional factor was interference stemming from the incongruity between the words and the colors in these stimuli.
In contrast to the findings for processing speed, the various interference scores yielded highly inconsistent results. The commonly used difference score (CW − C) and the score resulting from Golden’s formula revealed highly significant differences between patients and controls (both ps < .001). However, these results were in opposite directions, as indicated by the standardized regression weights. The difference score mean was significantly lower for the patients than for the controls, whereas the Golden score mean was significantly higher. The means for the other three interference measures were in the same direction as the Golden scores, though the differences between patients and controls on these measures were not significant. Age and education (data not shown) were the only significant predictors for relative, ratio, and residualized interference scores, with age having the stronger association.
None of the above results changed substantially when fatigue and depression scores were added to the regression model. Patients and controls continued to differ significantly on each of the measures of processing speed (all ps ≤ .001). Although fatigue and depression usually emerged as significant predictors of processing speed (data not shown), the introduction of these scores in Model 2 had little impact on the strength of the association between the grouping variable and the processing speed, and the standardized regression weight for this variable declined only .07 or .08 for the various measures. The difference between patients and controls on the difference score and the Golden score measures of interference continued to be significant (both ps < .01) but contradictory. And finally, the relative, ratio, and residualized interference scores continued to show no significant differences between patients and controls.
DISCUSSION
The differences between patients and controls on each of the individual trials of the Stroop indicate substantial reductions in the speed of processing for patients with MS. Although Jensen (Reference Jensen1965) concluded that the word reading score (W) was the best measure of processing speed, in the present study, more robust differences were found on the color naming score alone (C) or in combination with word reading (W + C). When the unadjusted means for patients and controls are compared, the effect sizes (Cohen’s d) are 1.09 for the color naming score and 1.12 for the combined score, and when the means are adjusted for all the covariates considered in Model 2 (i.e., gender, age, education, fatigue, and depression), these effect sizes only decline to 0.90 and 0.89, respectively. By comparison, the effect size for the adjusted means on the word reading trial is 0.79. The color–word naming score had the lowest effect size (0.73), its effectiveness as a measure of processing speed diluted by the added feature of interference stemming from the incongruity between words and colors.
With respect to the measures of interference, considerable inconsistency occurred. Most notably, the simple difference score (C − CW) that Jensen claimed to be the best index of interference and the Golden interference score yielded significant but opposing results, the former indicating greater interference in the controls and the latter, greater interference in the patients. The substantial differences in processing speed between patients and controls have a distorting effect on both these interference measures, but the distortion runs in opposite directions. This is evident by examining the correlations between these two interference measures and the three “undiluted” measures of processing speed—word reading, color naming, or the combined score. These correlations were determined separately for patients and controls and then combined using Fisher’s method of transforming the correlation coefficients into z values. In all instances, processing speed was positively correlated with the difference score measure of interference (combined Rs ranging from .30 to .43; all ps < .001) but negatively correlated with the Golden measure of interference (combined Rs ranging from −.25 to −.30; all ps < .001). Patients’ substantially lower scores on processing speed were therefore conducive to lower scores on the difference score measure of interference, but higher scores on Golden’s measure of interference, relative to controls. The fact that all these correlations were significant indicates that neither interference measure adequately controlled for differences in processing speed. By comparison, the relative, ratio, or residualized interference measures were not significantly correlated with processing speed (combined Rs ranging from −.03 to .05). These measures provide an effective assessment of interference independent of processing speed, and in each instance, no interference differences were found between patients and controls.
Similarly, opposing results are evident in our previous studies. We used Golden’s score in our initial study comparing MS patients and controls on the Stroop Test (Denney et al., Reference Denney, Lynch, Parmenter and Horne2004) and reported a significant advantage for controls in terms of their ability to resist interference. The effect size for this difference was considerably smaller than for processing speed, and the difference no longer remained significant when results were covaried for depression and fatigue, but nevertheless, Golden’s measure of interference yielded a significant initial difference favoring the controls in this study. When the simple difference score measure of interference was used in our next study (Denney et al., Reference Denney, Sworowski and Lynch2005), no significant difference was found between patients and controls. However, a curious finding in this second study prompted the current exploration of different methods for scoring interference: The patients in this study now appeared to have lower interference scores than the controls. The difference was not significant (perhaps because fatigue and depression scores were covaried from the outset in this study), but the direction was clearly opposite to what we had found in the initial study. For example, the unadjusted difference score was 10.5 ± 5.2 for the sample of relapsing–remitting patients and 14.2 ± 5.8 for the healthy controls.
As the most commonly used measure of interference, the problematic performance of difference scores warrants further comment. Difference scores suffer from a number of statistical weaknesses (Cronbach & Furby, Reference Cronbach and Furby1970), but in the context of the Stroop Test, the main problem arises because subjects’ scores can be affected to an equal degree by their performance on either of the two components involved in the difference. Thus, for example, the patients in the present study appear to have less interference than the controls because they performed so much more poorly than the controls on the color naming trial (C) than they did on the color–word naming trial (CW). The simple difference between C and CW therefore yielded a smaller value for the patients than for the controls, even though this outcome was affected more by the patients’ especially weak performance on color naming rather than by any particularly strong performance on the Stroop items themselves. The difference needs to be adjusted for processing speed, and the most obvious ways of accomplishing this are by enlisting any one of the methods that might be termed the “three rs of interference”: By expressing the difference as a proportion of the color naming score (relative interference); by examining the ratio of CW and C, rather than the simple difference between the two scores (ratio interference); or by using regression to adjust the CW scores for the variance attributable to color naming (residualized interference). Which of the three methods should actually be used is probably unimportant. The resulting scores were highly correlated (combined Rs ranging from .98 to .99), and each showed only modestly higher interference for patients than for controls. In other words, regardless of which measure is used, when differences in processing speed are adequately controlled, differences in interference between MS patients and controls disappear.
Macniven et al. (Reference Macniven, Davis, Ho, Bradshaw, Szabadi and Constantinescu2008) recently arrived at a similar conclusion. They compared MS patients’ and control participants’ in terms of reaction times to individual items consisting of incongruent color words, congruent color words, and neutral (i.e., colored Xs) stimuli. Although they found significant differences between groups on both differences scores and relative interference scores, the effect size was smaller in the case of the relative interference measure. Furthermore, by correcting the interference scores using an independent measure of processing speed derived from a graded-difficulty choice reaction time test, they showed that the differences between patients and controls on either type of interference score were no longer significant. They concluded that apparent difficulties MS patients may have with interference on the Stroop Test can be accounted for by decreases in processing speed and need not be attributed to impairment in executive function or selective attention.
There are numerous variations in the format of the Stroop Test, and only a few investigators (Potter et al., Reference Potter, Jory, Bassett, Barrett and Mychalkiw2002; Salo et al., Reference Salo, Henik and Robinson2001; Seignourel et al., Reference Seignourel, Robins, Larson, Demery, Cole and Perlstein2005) have examined the impact of these formatting differences on resulting scores. These studies have primarily compared card-based and computerized versions of the Stroop Test, although Salo et al. (Reference Salo, Henik and Robinson2001) also included a comparison between blocked and randomized trials within a computerized format. None of these comparisons have been performed using MS patients, and it is difficult to say whether the findings of the present study would be replicated across the full array of test formats. However, Macniven et al.’s (Reference Macniven, Davis, Ho, Bradshaw, Szabadi and Constantinescu2008) study indicates one formatting feature that should be investigated further. In contrast to our results, these investigators found a significant difference between MS patients and controls on a measure of relative interference. Whereas, in our computerized test, the three conditions were introduced in separate trials, the individual items in Macniven et al.’s test varied randomly by condition thereby imposing the added requirement that subjects shift rapidly from one type of stimulus to another during the course of the administration. This added burden upon cognitive flexibility is also featured in a fourth trial of a newer published version of the Stroop Test (Delis et al., Reference Delis, Kaplan and Kramer2001) that requires subjects to alternate between reading the color word and naming the color of its print. It is possible that this additional requirement elicits greater interference in MS patients relative to controls.
Whereas the differences between MS patients and controls in terms of interference were modest in the present study, the differences in processing speed were substantial. Investigators (Foong et al., Reference Foong, Rozewicz, Quaghebeur, Davie, Kartsounis, Thompson, Miller and Ron1997) have been known to despair over the possibility of finding relationships between specific cognitive deficits and brain lesions in the case of neurological disorders as widely distributed as MS. On the other hand, a generalized slowing in the speed of processing as reflected by the reductions in performance across all trials of the Stroop has long been interpreted as indicative of the kind of diffuse, subcortical pathology characteristic of this disease (Caltagirone et al., Reference Caltagirone, Carlesimo, Fadda and Roncacci1991; Cummings & Benson, Reference Cummings and Benson1984; Golden, Reference Golden1978; Kujala et al., Reference Kujala, Portin, Revonsuo and Ruutiainen1994; McCarthy et al., Reference McCarthy, Beaumont, Thompson and Peacock2005; Ryan et al., Reference Ryan, Clark, Klonoff, Li and Paty1996). Felmingham et al. (Reference Felmingham, Baguley and Green2004) have shown similar reductions in patients whose traumatic brain injuries included diffuse axonal damage. A useful direction for future investigations would be to use more recently developed methods such as diffusion tensor imaging to explicitly demonstrate the association between white matter pathology and speed of processing measures in patients with MS.
The multiple regression analyses revealed that age was also significantly related to each measure of processing speed. A general decline in the speed of processing is, of course, a well-established finding in the area of cognitive aging. Researchers (DeLuca et al., Reference DeLuca, Chelune, Tulsky, Lengenfelder and Chiaravalloti2004; Denney et al., Reference Denney, Lynch, Parmenter and Horne2004; Kail, Reference Kail1998; Kalmar et al., Reference Kalmar, Bryant, Tulsky and DeLuca2004; Reicker et al., Reference Reicker, Tombaugh, Walker and Freedman2007) have frequently commented on the similarity between the deficits in processing speed seen in MS and those occurring in conjunction with healthy aging. Kail (Reference Kail1998) has illustrated this similarity using Brinley plots to show that the regression between MS patients and controls in terms of performance across a number of tasks involving speeded information processing is similar to the regression of older subjects’ performance on that of younger subjects. The association is also supported on a neurological front by demonstrations of correlations between white matter changes in healthy elderly adults and declines in their speed of processing (Rabbitt et al., Reference Rabbitt, Scott, Lunn, Thacker, Lowe, Pendleton, Horan and Jackson2007; Ylikoski et al., Reference Ylikoski, Ylikoski, Erkinjuntti, Sulkava, Raininko and Tilvis1993).
In conclusion, of the three cognitive operations Jensen identified as underlying subjects’ performance on the Stroop Test (processing speed, color difficulty, and interference), the most important in terms of distinguishing between MS patients and controls is processing speed. Differences in this domain distort common measures of interference (the simple difference score and Golden’s score) that inadequately control for processing speed. Relative, ratio, or residualized scores that assess interference beyond the differences in processing speed constitute better measures, and when these measures are used, only small, usually insignificant differences in interference are found between MS patients and controls.
ACKNOWLEDGMENTS
This research was unfunded, and the authors have no financial or other conflicts of interests to report. The data used for the present manuscript were compiled from five previous published studies, but the focus on comparative approaches for scoring the Stroop to evaluate interference independent of processing speed is a novel feature of this work, and the manuscript itself has not been published elsewhere electronically or in print.