


In the tales of underdevelopment, Latin America is a frequent character. Scores of articles and books are devoted to the problem of the Latin American economic lag. Given the rich endowments, why did the region fail to converge to the standards of living of the developed world? Comparisons to a variety of developed and developing countries abound, with the obligatory conclusion of the region's squandered opportunities to jump on the growth wagon. Explaining the economic gap between Latin America and the developed world has motivated a large share of the recent scholarship on the economic history of the region (see Coatsworth and Summerhill Reference Coatsworth, Summerhill and Moya2010).
Historical work on Latin America has often looked at the “path dependence” where the origin of the development path is traced back to the colonial period (Engerman and Sokoloff Reference Engerman, Sokoloff and Haber1997; Acemoglu, Johnson, and Robinson Reference Acemoglu, Johnson and Robinson2001). As José Martí noted once: North America was born with a plough in its hand, Latin America with a hunting dog (Centro de Estudios Martinianos 2001, p. 135). This literature focuses on political, economic, and social institutions, their persistence over time, and their influence on contemporary economic outcomes. Already in the 1960s and 1970s dependency theory developed a framework to analyze patterns of persistence. More recently, a number of studies link the colonial institutions to economic outcomes today. The message from this literature is clear, colonial institutions established in the sixteenth century are to blame for Latin America's relative poor economic performance (Acemoglu, Johnson, and Robinson Reference Acemoglu, Johnson and Robinson2001; Engerman and Sokoloff Reference Engerman, Sokoloff and Haber1997; Dell Reference Dell2010). Daron Acemoglu and James Robinson (Reference Acemoglu and Robinson2012, pp. 18–19) summarize this view as follows: “After an initial phase of looting, and gold and silver lust, the Spanish created a web of institutions designed to exploit the indigenous people. The full gamut of encomienda, mita, repartimiento, and trajin was designed to force indigenous people's living standards down to a subsistence level and thus extract all income in excess of this for Spaniards. This was achieved by expropriating their land, forcing them to work, offering low wages for labor services, imposing high taxes, and charging high prices for goods that were even voluntarily bought. Though these institutions generated a lot of wealth for the Spanish crown and made the conquistadores and their descendants very rich, they also turned Latin America into the most unequal continent in the world and sapped much of its economic potential.”
In this article we question this interpretation of the economic and institutional history of Spanish America between 1500 and 1800. This is the first systematic attempt to reconstruct the growth trajectory of this region during colonial times (1550s–1810s) using the indirect approach as a methodology. The results are surprising: there was much more economic growth between 1550 and 1780 than previously assumed. Major indices of economic development such as the urbanization rates, real wages of unskilled laborers, literacy, and numeracy confirm this picture.
This article fills the gap of the lack of colonial macroeconomic indicators in the Spanish empire. Historical national accounting in Latin America has particularly prospered in the last two decades with estimations going back to the nineteenth century for many countries and, covering selected colonial periods in a couple of cases (see the Global Prices and Income History Group website). Angus Maddison (Reference Maddison2001) pioneered the calculation of GDP per capita for the colonial period, but his estimates are rather crude. Leandro Prados de la Escosura (Reference Prados de la Escosura2009, p. 771) illustrates this point eloquently: “[…] levels of GDP per head in pre-1820 Latin America are just an unknown. Alas, John Coatsworth and Angus Maddison's figures, cited profusely […], are simply wild guesses.” However, much scholarship on the Latin American growth performance used these indices despite their weaknesses.
In this article we improve the existing colonial GDP per head estimations for Mexico and Peru.Footnote 1 We define the Mexican economy as central Mexico, the Yucatán area, and Northern Mexico—roughly the same area as contemporary Mexico. In the case of Peru, we include Peru and Bolivia due to the importance of the Potosí mines for both regions. Mexico and Peru were the two pillars of the Spanish empire as key producers of precious metals and with nearly 60 percent of the population of Spanish Latin America by 1788 (Bulmer-Thomas Reference Bulmer-Thomas1994). From a temporal perspective, we look at colonial times ending our estimations in 1810. By restricting our analysis to colonial times, we examine the degree and extent of economic divergence between the colonies and the motherland: Spain.
Having more accurate figures on GDP per capita for the colonial period is key to answer when, how, and why Latin America fell behind. Our estimations suggest that while the region experienced economic growth, it was not sustainable. To trace the sources of colonial economic growth we explore the evolution of the urban systems and of human capital. The evidence suggests that the initial extractive institutions were not fixed but evolved and adapted to prevailing economic and political conditions. Our findings contribute to explaining the growth path of these economies despite the limitations to economic development in this period.
We apply the method developed by Paolo Malanima (Reference Malanima2003), Carlos Álvarez-Nogal and Leandro Prados de la Escosura (Reference Álvarez-Nogal and Prados de la Escosura2013), and Ulrich Pfister (Reference Pfister2011) to estimate the long-term evolution of GDP for Italy, Spain, and Germany, respectively, to these two Latin American cases. This method is based on earlier work on colonial wages and prices in these economies (Arroyo Abad et al. Reference Arroyo Abad and Ludlow2012) in combination with new estimates of the urbanization rates and mining production. We also take advantage of the recent work by Bruno Seminario de Marzi (Reference Seminario de Marzi2013) on Peruvian GDP from 1700 to the present.
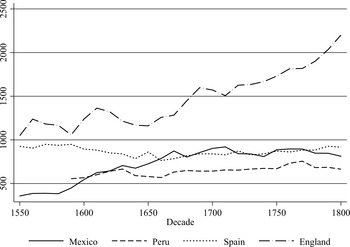
Applying this indirect method, we find that these colonial economies went through significant cycles of expansion and contractions. Moreover, the actual levels of GDP per capita were much higher than previously estimated. For the case of Mexico from 1650s onwards, the GDP per capita was, on average, as high as the Spanish level. While Peru's level was consistently lower than Spain's throughout the period, at its height, in the late eighteenth century, it reached up to 85 percent. We explore the drivers of economic growth during colonial times including the development of mining and the expansion of the urban system. These new estimations challenge the view of a lethargic economic performance of the region during colonial times, thus placing these economies much closer to European development levels.
METHODOLOGY
To estimate the development of GDP per capita between 1500 and 1820 we used the indirect “state of the art” approach developed for and applied to European countries for the same period. In its simplest form, this method produces indirect estimates of agricultural and non-agricultural outputs. Agricultural output is defined as the demand for foodstuffs because inter-oceanic trade in these commodities was marginal (Borah Reference Borah1954; Gallo and Newland Reference Gallo and Newland2004). Trade in foodstuffs from New Mexico to Peru ended by 1560 as Peru's economy became more self-sufficient. Trade from Spain consisted mostly of manufactures (textiles, yarns, shoes, hats, furniture), luxury goods (rose water, scissors, necklaces, looking glasses), tools (knives, saddles, needles), religious objects, and books (Borah Reference Borah1954). The most important non-food agricultural export from Mexico to Spain was indigo which represented 3.4 percent by the end of the colonial period (Ortiz de la Tabla Ducasse 1978). Per capita demand for foodstuffs is a function of real income, the relative price of foodstuffs to manufactured goods, and the relative price of foodstuffs, assuming certain demand elasticities. The most important assumption is that real income is proxied by the real wage of an unskilled laborer, based on previous work for these two economies (Arroyo Abad et al. Reference Arroyo Abad and Ludlow2012). Our work showed that the trends of the real wages in Mexico and Peru reflected the changes in population growth, in labor institutions, and production bottlenecks.
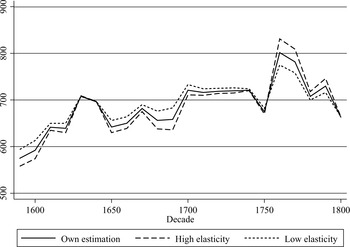
The literature suggests three sets of income and price elasticities to link wages to demand for agricultural commodities. Robert Allen (Reference Allen2000) used an income elasticity of demand of 0.5, an own price elasticity of –0.6, and a cross-price elasticity of 0.1. Malanima (Reference Malanima2003) selected values of 0.4, –0.5, and 0.1, respectively, whereas Álvarez-Nogal and Prados de la Escosura (Reference Álvarez-Nogal and Prados de la Escosura2013) opted for even lower values (0.3, –0.4, and 0.1, respectively). Their choice is due to the use of daily wages (instead of annual wages) that could result in changes in the demand for foodstuffs. Our estimates take the middle ground: we assume an income elasticity of demand of 0.4, a cross-price elasticity of 0.1, and an own-price elasticity of –0.5. Consistent with Álvarez-Nogal and Prados de la Escosura (Reference Álvarez-Nogal and Prados de la Escosura2013), the impact of changes in these parameters on the growth pattern is limited (see Appendix A, Appendix Figure 1 for these results).
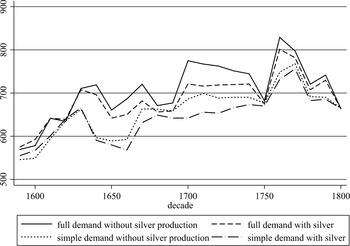
A limitation in our case is that we lack the variety of price data of manufactured goods necessary to use the full demand function for Mexico. Instead, we assume that the demand for agricultural goods is a function of real income.Footnote 2 To test the sensitivity of this assumption, we estimate per capita GDP series for Peru based on the simplified demand equation and on the full model (see Appendix A, Appendix Figure 2). The differences between the two approaches are small, and both series show very similar trends over time.
A potential additional source for quantifying agricultural output is tithes collection. Various authors claim that tithes are unsuitable for reconstructing agricultural output as the series are dominated by changes in bureaucratic procedures, monetary factors with no coverage of crops grown by the indigenous populations (Morin Reference Morin, Goy and Le Roy Ladurie1982; Ouweneel and Bijleveld Reference Ouweneel and Bijleveld1989; Silva Riquer Reference Silva Riquer1998). When estimating colonial agricultural output, Carlos Newland and John Coatsworth (Reference Newland and Coatsworth2000) noted that tithes are not a trustworthy indicator of agricultural production but an estimation by the tithe collectors net of their profits and costs. Despite these reservations, we compared our own estimated agricultural production to the one obtained using Newland and Coatsworth (Reference Newland and Coatsworth2000)'s tithes for Peru (see Appendix A, Appendix Figure 3).Footnote 3 Following the same methodology, we also found a high correlation between the two series.
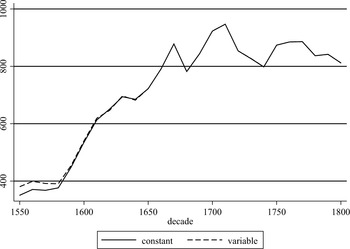
A related issue is the weighting of the three sectors. We base our weights on the sector composition in 1800 as we link to the absolute level of GDP per capita by the Maddison Project (Bolt and van Zanden Reference Bolt and Luiten van Zanden2014). Without doubt, agriculture was the main economic activity. For Mexico, various estimates suggest that the agricultural sector contributed between 50 percent and 65 percent of GDP (Garavaglia 1991; Rosenzweig Reference Rosenzweig1963; Salvucci and Salvucci Reference Salvucci and Salvucci1987). For Peru, we have continuous GDP composition since 1700 by Seminario de Marzi (Reference Seminario de Marzi2013, pp. 709–18) with a decline of the agriculture GDP share from 61 percent in 1700 to 49 percent in 1800.Footnote 4 Given the estimates available, a 55 percent share of agriculture seems sensible. We conjecture that this share might have been larger before 1650 as the urbanization level was generally lower. It follows that switching to a higher GDP share for agriculture would temper growth, as the non-agricultural sector was relatively more dynamic. Unfortunately, there are no estimates of sector composition for early colonial times, but we tested for the sensitivity of changing to other weights before 1650 (see Appendix A, Appendix Figure 4).
To estimate non-agricultural output, we used the sector distribution of GDP discussed earlier and proxied the structure of the labor force over time using urbanization rates. We expanded E. Buringh (Reference Buringh and Hub2013)'s urban population dataset, using a wide variety of sources ranging from regional studies to geographical dictionaries (see Appendix B for details).
To obtain urbanization rates, the second component needed is total population. Colonial population figures are a highly contested area in the Latin American historiography. Scholars agree on a severe depopulation due to disease, violence, and social disruption; however, the degree of such decline is still unsettled (see Denevan Reference Denevan1976; Sánchez-Albornoz Reference Sánchez-Albornoz and Bethell1984). For the case of Mexico, the “High counters” or maximalist camp led by Sherburne Cook and Lesley Simpson (Reference Cook and Byrd Simpson1948) and Woodrow Borah and Cook (Reference Borah and Cook1960, Reference Borah and Cook1963), propose a high population level before the European encounter with a subsequent steep rate of depopulation in the order of 65–95 percent range. The “Low counters,” or the minimalist camp, dispute this view arguing for depopulation rates as low as 22 percent (Rosenblat Reference Rosenblat1954). The source of such remarkable difference is the role of the smallpox epidemics before 1540 (McCaa Reference McCaa, Haines and Steckel2000). While there is no unanimity on the extent of the decline, it appears that the consensus borders on a depopulation rate of at least 50 percent. The trend reversal took place by mid-seventeenth century in Mexico (Sánchez-Albornoz Reference Sánchez-Albornoz and Bethell1984).
The choice of population levels can have a sizable effect on urbanization rates; however, it is important to note that the accuracy of the population estimates increased throughout the period. Demographers noted the quality of the type of sources available and used for their population estimates. For Mexico, Cook and Borah (Reference Cook and Borah1974) state that throughout colonial times the sources included Spanish reports and fiscal, civil, and ecclesiastical records. At the time of initial contact, the estimates mostly come from Spanish reports in terms of military numbers, males in city-states, and initial impressions. Once the administrative structure was established, the main sources for population were from Indian tribute counts, regional counts, town assessments, assessments of non-Indians for tribute and tax purposes starting a few decades after the conquest. Given the special close relation between the church and the state in Spain, other demographic sources include church records such as conversion counts, parish registers, and tithe records. We provide lower- and upper-urbanization rates estimates based on the total population estimates available (see Appendix A, Appendix Table 1). With less dramatic impact of epidemics, the population growth ensued in Mexico while the ethnic and racial composition changed. The indigenous population experienced lower growth rates while the mestizo segment was the most dynamic group.
For Mexico, we have followed an average of the population figures available for the sixteenth and seventeenth centuries and Robert McCaa (Reference McCaa, Haines and Steckel2000)'s and Instituto Nacional de Estadística y Geografía (INEGI) (1990)'s figures for the rest of the period (see Table 1). In addition to the dispute of the depopulation rates, another challenge was finding total population figures after the initial demographic collapse. To arrive to our estimates, we have consulted a number of works including Aguirre-Beltran (Reference Aguirre-Beltrán1972), William Denevan (Reference Denevan1976), and Thomas Whitmore (Reference Whitmore1992). The core of the population estimates referred only to Central Mexico. Cook and Borah (Reference Cook and Borah1974) provide estimates from early sixteenth century through late eighteenth century for the Yucatan region. From Peter Gerhard (Reference Gerhard1982), we included estimates for the population of North Mexico (Sinaloa y Sonora, Nueva Vizcaya, Baja California, Coahuila, Nuevo León, and Nuevo Santander), but we excluded areas that were transferred to U.S. dominion after colonial times (i.e., Alta California, Nuevo Mexico, and Texas).
TOTAL POPULATION AND URBANIZATION RATES IN MEXICO, PERU, AND SPAIN

* Adjusted urbanization rate (excludes “agro” towns). It includes urban centers of at least 5,000 inhabitants.
aIncludes Peru and Bolivia.
Sources:
Urban population: see appendix B; Total population: Mexico: Acuña-Soto et al. (Reference Acuña-Soto, Stahle and Cleaveland2002), Aguirre-Beltrán (Reference Aguirre-Beltrán1972), Cook and Borah (Reference Cook and Borah1971), Cook and Simpson (Reference Cook and Byrd Simpson1948), Denevan (Reference Denevan1976), INEGI (1990), McCaa (Reference McCaa, Haines and Steckel2000); Peru: Cook (Reference Cook1981) and Seminario de Marzi (Reference Seminario de Marzi2013); Spain: interpolation from Álvarez-Nogal and Prados de la Escosura (Reference Álvarez-Nogal and Prados de la Escosura2007).
For Peru, Noble David Cook (Reference Cook1981) estimates a pre-Columbian population of 9 million, falling to a million by 1570. The impact of lack of immunity to European diseases took a toll on the local population even before the Spaniards had set foot in Peru (Dobynns Reference Dobynns1963). The demographic recovery took longer in Peru than in Mexico with an inflection point at the beginning of the eighteenth century following the epidemic of 1719 (Sánchez-Albornoz Reference Sánchez-Albornoz and Bethell1984). The mixing of the different groups led to a continuous decrease of the share of the indigenous population: in 1650, 87.5 percent of total population was of indigenous origin while the share was only 46.2 percent by 1825 (Cook Reference Cook1965).
For total population in Peru, we used Cook (Reference Cook1981) before 1700 and Seminario de Marzi (Reference Seminario de Marzi2013)'s estimates from 1700 onwards (see Table 1). For Bolivia, the estimates are generally incomplete in terms of the geographical and temporal scope. Throughout the colonial period, we only found figures for indigenous population in a few provinces including La Paz and La Plata (Kubler Reference Kubler and Stewart1946; Sánchez-Albornoz Reference Sánchez-Albornoz1978; Watchel Reference Watchel1971). To arrive to the total population, we used the overall evolution of the Peruvian relative composition of the population by type, that is, castes, indigenous, and white (Gil de Taboada y Lemos 1846; Cook Reference Cook1965). In addition, we assumed that the population share of the provinces for which we had data remained constant over time based on the first Bolivian census.
For an important part of the non-agricultural sector, the mining industry, we have detailed and relatively reliable output time series for both economies. Mining was a key sector in the colonial economy affecting fiscal revenue, trade, and economic activity (Brading Reference Brading1971; Bakewell Reference Bakewell1971; Fisher Reference Fisher1977; Stein and Stein Reference Stein and Stein2000; Brown Reference Brown2012). For the 1800 benchmarks we can estimate the relative participation of this sector in GDP: 8 percent in the case of Mexico, and 7 percent for Peru. Given the mining industry influence on the economy and consistent with the existing literature, we increased its share to 16 percent and 14 percent, respectively.
Following the existing methodology, the output estimates of the industrial and services sectors are based on the development of the urban population (Malanima Reference Malanima2003; Pfister Reference Pfister2011). Álvarez-Nogal and Prados de la Escosura (Reference Álvarez-Nogal and Prados de la Escosura2013) exclude agricultural laborers living in “agro-towns”; however, the estimated share of agricultural workers in the urban labor force suggests that this adjustment is not necessary for Latin America. In the big cities this share was small—0.8 percent in Lima and 0.01 percent in Mexico City in 1790 (Brading Reference Brading, Hardoy, Morse and Schaedel1978). In smaller towns the share was a bit larger but not significant enough to justify adjustments. John Chance and William Taylor (Reference Chance and Taylor1977) assert that agricultural workers lived in small rural towns. For example, by 1790, 5.4 percent of the population in Querétaro, Mexico and 3.7 percent in Antequera (Oaxaca) engaged in agricultural activities (Chance and Taylor Reference Chance and Taylor1977; Wu Reference Wu1984).
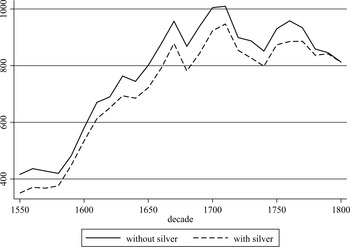
As we include estimates on the mining sector, there is a danger of double counting its contribution to GDP through the evolution of urbanization and through the performance of the labor market. We therefore performed another sensitivity analysis, by estimating GDP per capita excluding mining production. These estimations are more comparable to the series produced for European countries. For Peru, the resulting two series (with and without the inclusion of mining) are almost identical. For Mexico, we find that including the mining industry results in somewhat more growth in the long run, but with very similar patterns (see Appendix A, Appendix Figure 5).
Summing up, our estimates of the evolution of GDP per capita are based on agricultural output derived from the real wage estimates (about 55 percent of GDP), manufacturing and service sector through the evolution of the urban sector (about 30 percent), and the direct performance of the mining sector (15 percent).Footnote 5
Finally, the two series were linked to the benchmarks in 1800 in 1990 Geary-Khamis dollars using the Maddison Project and Seminario de Marzi (Reference Seminario de Marzi2013)'s benchmarks for Mexico and Peru respectively. Using this benchmark can be arguably problematic as it assumes equal changes in relative prices for all countries. Compared to the existing literature, our estimates perform relatively well. Richard Salvucci (Reference Salvucci, Neal and Williamson2014) estimates a gap of roughly 36 percent between these two countries around the 1800s while our estimations place Mexico's GDP per capita at 813 Geary-Khamis dollars and Peru's level at 665. Moreover, recent research shows that the biases of the backward projections within the Maddison framework are not large. The Maddison Project's approach estimates are consistent with independent benchmarks for the nineteenth century (Bolt et al. Reference Bolt, Enklaar and de Jong2016).
COLONIAL ECONOMIC GROWTH: CYCLES AND TRENDS
Figure 1 presents three series of GDP per capita: our series for Peru (1590–1800) and Mexico (1525–1800), and the Seminario de Marzi (Reference Seminario de Marzi2013)'s series for Peru (1700–1800). Compared to Seminario de Marzi (Reference Seminario de Marzi2013)'s figures, our estimations display similar trajectories: considerable growth in the eighteenth century, culminating in the 1770s followed by a deep decline between the 1780s and 1810s.Footnote 6
GDP PER CAPITA, MEXICO AND PERU, IN 1990 GEARY-KHAMIS DOLLARS, 10-YEAR AVERAGE
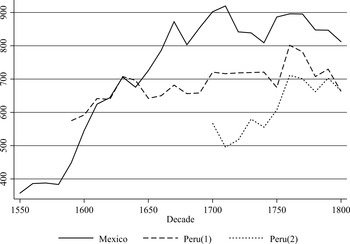
Three developments drive the remarkable growth “spurt” between 1550 and 1750. First, the urbanization ratio increased significantly: from 2 percent to 12 percent in Mexico and from 3 percent to 16 percent in Peru. Second, real wages rose as well. In Mexico, the level rose from below subsistence in 1550s to 2.5 to 3 times subsistence level in the 1750s. In Peru, real wages doubled from barely subsistence between 1600s and 1770s. Both urbanization and real wages increased almost continuously between 1550 and 1750. Third, with wider fluctuations, the output of silver mining rose in both regions during the sixteenth century, followed by a decline between the 1620s and 1690s. With a remarkable recovery in both regions during the eighteenth century, output resulted in higher levels than in previous centuries.
Overall economic growth failed to keep up with population growth towards the end of the eighteenth century (TePaske Reference TePaske, Nils and Jacobsen1986). Peru did not experience much growth until after 1770s. This turning point coincides with the increase in silver mining in non-Potosí mines, a change that may have reinvigorated the rest of the economy. This recovery was short-lived: mining, trade, and tribute revenue declined from 1790s onwards (TePaske Reference TePaske, Nils and Jacobsen1986). These cycles of expansion and decline are consistent with the broad brushstrokes in the few comparative studies available (see Jacobsen and Puhle Reference Jacobsen and Puhle1986).
The three long-term trends driving the long cycle in GDP per capita, real wages, urbanization, and silver mining were interconnected. High real wages and increased silver output, for example, must have stimulated urban growth. That these three factors show the same or very similar long-term trends reinforces our results that per capita GDP underwent long cycles of growth and decline.
Another noteworthy result is the “Little Divergence” of Mexico in the seventeenth century. In the late sixteenth century Mexico and Peru were at a roughly similar level of real GDP per capita, but after 1650 Mexico's performance left Peru behind. Real wages were higher in Mexico (Arroyo Abad et al. Reference Arroyo Abad and Ludlow2012), but rates of urbanization were similar. The Mexican divergence is consistent with the qualitative literature: in the eighteenth century Mexico was considered to be the richest colony in the Spanish empire contributing 50 percent of Spain's revenue (Klein Reference Klein1998). Before the mid-seventeenth century, this position was claimed by Peru, which contributed most to the colonial treasury, but after 1660s Mexico took over this role. The Mexican economy also became more advanced than the Peruvian one: markets and free labor were more developed in Mexico than in the south (Salvucci Reference Salvucci, Neal and Williamson2014).Footnote 7
Overall, this method may over- or underestimate the actual total output. There were costs associated to being a colony. One of the costs was the transfers to the Spanish government, taking those into account, the impact was, on average, between 0.9 percent and 0.13 percent of GDP.Footnote 8 However, recent research has unveiled the importance of inter-colonial transfers. Acting in a decentralized manner, the local governments had power over the allocation and distribution of expenditures. Inter-colonial transfers between different fiscal units, known as cajas, were a widespread practice throughout colonial rule. For some districts, it was the most important source of revenue (Grafe and Irigoin Reference Grafe and Irigoin2006, Reference Grafe and Irigoin2012). Thus, to arrive to a more accurate estimation of GDP, it is imperative to take into account these transfers in addition to the remittances to the Spanish government. Estimates on the size of these transfers are only available for the late eighteenth century from Regina Grafe and Alejandra Irigoin (Reference Grafe and Irigoin2012). In particular, Mexico, given its size and position in the empire, was the main source of cross-colony subsidies (Grafe and Irigoin Reference Grafe and Irigoin2012). In addition, to represent the actual output that remained in Mexico and Peru we would need to adjust GDP by the transfers to the Spanish government (see Figure 2). For this period, the ratio between the GDP per capita net of transfers to the Spanish government and the one presented earlier is on average 95.8 percent and 99.7 percent in Mexico and Peru, respectively.Footnote 9 Compared to other imperial endeavours, the burden of the empire was not as onerous, for example, Java's net transfer to the Netherlands was 4 percent to 8 percent throughout the nineteenth century (van Zanden and Marks Reference van Zanden and Marks2012).
PUBLIC REVENUES REMITTED TO SPAIN AS PERCENTAGE OF GDP, 10-YEAR AVERAGE

MINING AS A COLONIAL GROWTH DRIVER
Colonial growth followed the swings of the principal economic activity: mining. The private exploitation of silver and gold in the New World quickly became an important source of fiscal revenue for the empire. Silver production in colonial Latin America experienced cycles that reflected the mining challenges faced due to the particular topography and the inputs and the technology available. These cycles do not coincide in the two main silver production regions: Mexico and Peru. The silver mines in Upper Peru led the first American silver boom from the 1570s to the 1630s; however, Mexico became the main supplier of silver in the eighteenth century (Brading and Cross Reference Brading and Cross1972).
In Mexico, the four main silver production locations were Durango, Guanajuato, San Luis Potosí, and Zacatecas. Peter Bakewell (Reference Bakewell1981) notes three periods in silver production in New Spain. The first one, during the seventeenth century is characterized by stagnation. Output fell by 25 percent in 1670s compared to 1610s and ended the century with approximately the same levels as it started. The lackluster performance of the sector was due to scarcity of mercury—needed for amalgamation—and more strict royal credit policies. In the first half of the eighteenth century, production doubled due to improvement in mercury provision and the refining process. In the last period (1750s–1800s), production doubled again partly driven by the Bourbon reforms (see Figure 2) (Bakewell Reference Bakewell1971, Reference Bakewell1981).
In the viceroyalty of Peru, Huancavelica and Potosí became the pillars of mining under the guidance of viceroy Toledo in the sixteenth century. He established the infamous mita—compulsory draft labor to the mines—founded a mint in Potosí, and opened Huancavelica for mercury production. Within a few decades the production of silver in Potosí skyrocketed reaching 50 percent of all silver shipped to Spain by 1570. This impressive performance was not everlasting: by mid-seventeenth century production fell as the result of insufficient mercury supplied, exhaustion of the high-grade ore, and shortage of coerced labor (Brading Reference Brading1970; Brading and Cross Reference Brading and Cross1972).
The slump in the mining sector in the first quarter of the eighteenth century had repercussions on the rest of the economy. Silver remittances to Spain allowed for influx of European goods to Peru resulting in a decline in transatlantic trade. Moreover, the impact on the fiscal accounts was clear, low silver production meant low revenue. In real terms, total revenue in the early 1740s was, on average, 55 percent of the previous decade.Footnote 10 Production recovered in the 1730s as the Crown reduced the tax on silver mining from 1/5 to 1/10, equalizing it to the tax incidence on agriculture (see Figure 3). Population growth alleviated the labor supply problem in the form of a larger share of free labor and new techniques—including the use of gunpowder—decreased the operating costs. New mining centers such as Cerro de Pasco, Hualgayoc, and Huarochirí, also contributed to production (Fisher Reference Fisher1977). This bonanza was interrupted by the wars of independence (1800s–1820s). Shortage of labor once again resurfaced due to the mobilization of men for battle. The war also crowded out the mining sector in terms of inputs: gunpowder and mules.
SILVER PRODUCTION BY DECADE, IN MILLIONS OF KILOGRAMS

The impact of mining trickled down to the colonial and the world economies. While mining guided the exploration of Latin America, it also created an urban system. Voluntary and involuntary migration made the mining centers the most populated urban settlements in colonial Latin America. As an example, Potosí became the largest city in the Western Hemisphere by the early 1600s. These settlements became magnets for commercial activity and were key in the formation of a complex circuit of trade within the colonies (Klein Reference Klein1985; Ponzio Reference Ponzio2005; Contreras Carranza Reference Contreras Carranza2010; Dobado and Marrero Reference Dobado González and Marrero2011).
The demand of these centers promoted the agricultural and commercial development of nearby areas. Cochabamba became the granary of Potosí while Zacatecas and Guanajuato stimulated the territories north of New Spain. This trade circuit expanded to farther away regions from mules from Argentina to wine in Peru and Chile, the core and fringes of the Spanish empire became increasingly interconnected (Assadourian Reference Assadourian1989; Johnson and Tandeter Reference Johnson and Tandeter1990; Assadourian Reference Assadourian1992).
URBANIZATION AS A SOURCE OF ECONOMIC GROWTH
Urbanization and economic growth are inextricably linked: urban centers generated demand for agricultural goods and promoted the expansion of non-agricultural activities. The development of manufacturing and urban crafts also became one of the main avenues for upward social mobility (Borah Reference Borah, Borah, Hardoy and Stelter1980; Brading Reference Brading, Hardoy, Morse and Schaedel1978). Urbanization in Latin America was an integral part of the imperial ambitions of the Spanish Crown. According to Morse “the city was the starting point for the occupation of the territory” (Hardoy Reference Hardoy1972, p. 78). The first conquistadors, encomenderos, traders, and merchants founded and settled in urban centers. These settlements obeyed different reasons and needs ranging from economic to military (see Appendix B for details).
The foundation of cities accelerated during the first decades after the conquest. Susan Soccolow and Lyman Johnson (Reference Soccolow and Johnson1981, p. 28) note that the Spaniards were “the most urban-minded of all colonizing peoples.” With increased trade flows within the colonies and with Spain, these settlements expanded in the seventeenth century placing Mexico City and Lima as the domestic metropolises based on their economic pre-eminence (Vives Azancot Reference Vives Azancot1987). While the Spaniards founded many cities, the urban population concentrated in handful of centers, as shown in Figure 4, turning them into large cities even by international standards. The epitome was Potosí, a city that reached 120,000 inhabitants at the height of silver production.
URBANIZATION, MAIN CITIES

The development of these urban centers varied depending on conflict, epidemics, colonial policies, and regional economic development. As epidemics periodically hit urban centers, the migration from the countryside fueled urban population growth. In the eighteenth century, population growth gained steam as the last major epidemic arrived in 1718 in Buenos Aires and reached Cuzco in 1720 (Pearce Reference Pearce2005). In cities near mining centers, the recessionary cycles in mining translated into decline of trade, agricultural production, and public services (Esteva Fabregat Reference Esteva Fabregat and Solano1975; Soccolow and Johnson Reference Soccolow and Johnson1981). Colonial ordinances and regulations shaped migration flows from the countryside and within the viceroyalties. The compulsory draft to the mines in Peru and Bolivia, the mita, triggered sizable migration towards urban centers as the Indians looked to evade this service by moving from their original place of settlement (Robinson Reference Robinson1990).
WHEN DID LATIN AMERICA FALL BEHIND?
Our estimates indicate that the prevailing view of Latin America's sluggish growth during colonial times may need revision. However, economic growth faced obstacles. The interaction between the nature of the economic activities in Spanish Latin America and the institutional framework delineated the growth experience during colonial times.
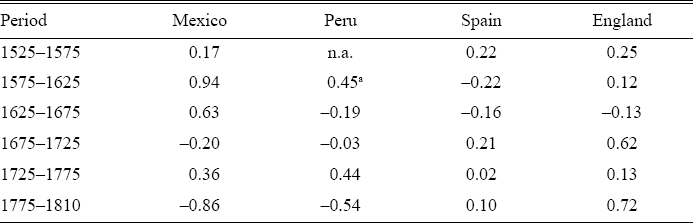
The colonial economies did not escape cycles of expansion and contraction. Colonial Mexican GDP per capita was on average on par with Spanish GDP per capita in good times while Peru's top performance reached 90 percent of Spanish per head output (see Figure 5).Footnote 11 Both economies achieved, in selected periods, higher per capita growth rates as well (see Table 2).
GDP PER CAPITA, MEXICO, PERU, SPAIN, AND ENGLAND, IN 1990 GEARY-KHAMIS DOLLARS, 10-YEAR AVERAGE
ANNUALIZED GROWTH RATES BY PERIOD, IN PERCENT
Notes:
n.a.: not available.
a 1595–1625.
Sources:
Mexico and Peru: see text; Spain: based on Álvarez-Nogal and Prados de la Escosura (Reference Álvarez-Nogal and Prados de la Escosura2013); England: based on Broadberry et al. (Reference Broadberry, Campbell and Klein2011).
The new estimations place these economies at a much higher level of economic development than previously assumed. Compared to Maddison (Reference Maddison2001)'s figures, our own estimation of Mexican GDP per capita is 70 percent higher for 1700. Coatsworth (2003), in turn, shows no GDP per capita growth between 1605 and 1800 with a level of 755 Geary-Khamis dollars, roughly a 20 percent gap with respect to our 1700 estimate. Other indicators also indicate that these colonial economies experienced prosperity during colonial times.
The degree of urbanization, for example, surpassed the one enjoyed by Spain by the eighteenth century even though the colonial economies started at lower rates of urbanization. Around 1700s, the urbanization rate was 11.1 percent for Spain while in Mexico and Peru the figures reached 12 percent and 20 percent, respectively (see Table 1). This gap is reversed by 1800 as Spain becomes more urban with a rate of 18.6 percent. Despite the Mexican urban gains, the urban concentration only reached 14.6 percent. In the case of Peru, urbanization lost ground bottoming out at 12.6 percent as Potosí's population decreased from a high of 120,000 in 1700s to 22,000 in 1800s.
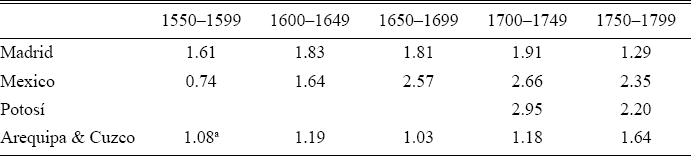
Another telling aspect of the level of development is real wages. From the numerous historical studies we know that certain cities in Latin America had relatively high real wages by mid-seventeenth century (see Table 3). Starting at or below subsistence level in early colonial times (ca. 1550s), real wages in Mexico City and Potosí climbed to higher levels than in Madrid. The Peruvian living standards had a more moderate trend even though they exceeded Madrid's levels by 1750s.
REAL WAGES OR WELFARE RATIOS FOR SPAIN, MEXICO, BOLIVIA, AND PERU, IN NUMBER OF BARE-BONES BASKETS
aOnly 1590 to 1599.
Sources:
Latin America: Arroyo Abad et al. (Reference Arroyo Abad and Ludlow2012), Spain: Allen (Reference Allen2001).
Our estimates suggest that the colonial economies were very dynamic at times while facing growth challenges by 1750s. To a large extent growth was based on the exploitation of the region's mineral resources. The waves of growth coincided with the waves of the mining industry with links to the agricultural, manufacturing, and service sectors. There is widespread consensus that the independence wars shrank per capita output; however, our estimates reveal that the inflection point takes place a few decades earlier (Prados de la Escosura and Amaral Reference Prados de la Escosura and Amaral1993). This finding is consistent with existing literature on the appearance of bottlenecks and decline of productivity by mid-eighteenth century (Jacobsen and Puhle Reference Jacobsen and Puhle1986).
While these economies were more dynamic than previously assumed, economic growth faced obstacles. New growth theory stresses human capital as a main driver of endogenous growth processes. We look into the capacity for these economies to achieve “sustained” economic growth with an array of indicators such as enrollment, numeracy, book production, and skill premium.
During colonial times, private and religious schools, mainly in cities, provided education. The demand for schooling rose during the eighteenth century as evidenced by an increase in enrollment rates and new schools. For example, the enrollment rates in San Juan de Puerto Rico and Buenos Aires were 50 percent and 37 percent of the children in school age, respectively (Newland Reference Newland1991).
Numeracy estimates show an increase of human capital accumulation in Latin America during colonial times (Juif and Baten Reference Juif and Baten2013). By late eighteenth century, the region was converging to Western European levels: the gap between Argentina, Mexico, and Peru fell from 50 percent to 30 percent by 1780. Consistent with our findings in terms of GDP per capita performance, numeracy stagnated from 1780 until the end of the wars of independence (Manzel, Baten, and Stolz Reference Manzel, Baten and Stolz2012).
Book production and consumption can offer an alternative index of human capital (Buringh and van Zanden Reference Buringh and Luiten van Zanden2009). Subject to colonial regulation, printing was constrained to four cities: Mexico City (since 1539), Lima (1584), Puebla (1640), and Guatemala City (1660). Despite small market size, the industry gradually expanded from 3,400 titles before 1700 to 5,500 during the eighteenth century. In per capita terms, book production in the eighteenth century was 6 titles per million inhabitants in Peru and 8.5 in Mexico, compared with 29 in Spain, 142 in the United States, nearly 200 in the United Kingdom, and 538 in the Netherlands. Joerg Baten and Jan Luiten van Zanden (Reference Baten and Luiten van Zanden2008) found a very strong positive correlation between book production per capita and per capita GDP growth during the nineteenth-century “Great Divergence.” Based on their work, we added two observations for Mexico and Peru (see Figure 6). Both colonies fall in the mid-range of the distribution, with values similar to those of Russia and Japan.
BOOK PRODUCTION AND ECONOMIC GROWTH

Another approach to measuring human capital is through the skill premium. Reflecting relative skills scarcity, it is measured as the ratio between the wages of a skilled craftsman (carpenter, blacksmith, mason) and an unskilled laborer. In Western Europe, the most dynamic economies such as England and Holland had relatively low skill premiums (around 50–60 percent) (van Zanden Reference van Zanden2009). In Mexico, the skill premium between masons and laborers averaged 64 percent between 1730 and 1820 points (Challu and Galvarriato 2015; Arroyo Abad et al. Reference Arroyo Abad and Ludlow2012). Comparable to premiums found in Southern Europe in this period, the premium was quite low by international standards, suggesting that the supply of these specific skills did not constrain economic development.
CONCLUSIONS
When discussing on the sustainable character of economic growth in Latin America between 1550 and 1800, we face the choice between “glass half full” and “glass half empty” perspectives. The region was probably much more dynamic than previously assumed—the main point of this article. Yet, this growth was intimately connected to booms and busts in the mining industry with limited links to greater investment in human capital.
Our article contributes to the literature of GDP per capita in historical perspective. By using GDP per capita, it is possible to compare the long-run trajectory of the pillars of the Spanish empire to other economies. Our new estimates of GDP per capita in colonial Mexico and Peru showed substantial increase in real incomes between 1550s and 1780s. The main causes were increased scarcity of labor resulting in relatively high real wages, high levels of urbanization, and the rapid expansion of the mining sector. Around 1780s decline set in, as the same three factors decreased. The phase of secular growth between 1550 and 1780, interrupted by periods of decline and stagnation, resulted in real incomes that matched, and at times surpassed, those of Spain.
After 1780 these economies started a contractionary phase. Bottlenecks in production and the wars of independence increasingly widened the gap with respect to Spain and the rest of Western Europe. Human capital formation displayed a similar trajectory with an upward trend but was interrupted in the late eighteenth century resulting in a growing divergence. The growth trajectory places the two pillars of the Spanish empire much closer, in economic terms, to the motherland. As a result our findings challenge the notion that colonialism in Latin America impoverished the region.
As for the fringes of the empire, we still need studies to assess their long-term economic trajectory during colonial times. With limited economic value for the Crown, these colonies frequently contested the institutions imposed.Footnote 12 Moreover, it is plausible that these colonies could have developed sizable manufacturing sectors given their relatively isolation and existing trade restrictions as supported by the prevailing high urbanization rates.Footnote 13 At the eve of the independence per capita GDP shows that both the Argentinean and the Uruguayan economies had grown to surpass Mexican per capita GDP by 11 percent and 30 percent, respectively. Other regions did not share such fate. For example, Colombia and Chile reached GDP per head close to 75 percent to the Mexican level in 1800.Footnote 14
This article shows that under colonial institutions, the core of the Spanish empire exhibited dynamic economic growth. We argue that economic growth is then possible under “extractive institutions.” These findings, we argue, challenge the standard view on institutions and economic growth in colonial Latin America, which maintains that persisting institutions introduced by the Spanish conquistadors and settlers produced economic stagnation. Growth under colonial institutions, however, also faced serious limitations. Hence, it is difficult at this stage to arrive at a final verdict on colonial economic development. Our main point is that there was much more economic growth than previously suggested. Future research will need to evaluate the question of persistence of colonial institutions in order to assess the nature of colonial economic growth in Spanish Latin America.
Appendix A: Sensitivity Analysis andOther Robustness Checks
As explained in the text, we used a preferred set of estimates of income and price elasticities within mid-range in the literature as in Malanima (Reference Malanima2003). We simulated the model also with the other sets of estimates. The Allen estimates of elasticities yield a total growth of GDP per capita in Peru between 1595 and 1800 of 25.8 percent, the Malanima (Reference Malanima2003) elasticities result in 21.4 percent growth, and the Álvarez-Nogal and Prados de la Escosura (Reference Álvarez-Nogal and Prados de la Escosura2013) elasticities imply 16.6 percent growth. Consistent with Álvarez-Nogal and Prados de la Escosura (Reference Álvarez-Nogal and Prados de la Escosura2013)'s findings, these results confirm the limited net effect of particular set of parameters. We finally tested the sensitivity of our results using other weights for the sectors in the period before 1650; we assumed in this alternative scenario that the share of agriculture was 65 percent (instead of 55 percent), of mining 10 percent and of the other industries 25 percent. For Peru the differences were tiny (less than 1 percent on average); for Mexico they were somewhat larger, but still rather small (at most 9 percent)(see Appendix Figure 5).
Given that we have reliable estimates of silver mining, we chose to estimate GDP with a defined mining sector. For robustness checks, we present here an estimate of GDP per capita using the traditional approach, that is, without mining. As shown in Appendix Figures 2 and 5, our preferred estimate is the most conservative of the scenarios presented. The correlation of these series range from 0.75 to 0.96.
PERUVIAN PER CAPITA GDP ESTIMATES WITH DIFFERENT ELASTICITIES, IN 1990 GEARY-KHAMIS DOLLARS
PERU'S GDP PER CAPITA INCLUDING AND EXCLUDING SILVER OUTPUT IN THE ESTIMATION AND USING DIFFERENT DEMAND SPECIFICATIONS, IN 1990 GEARY-KHAMIS DOLLARS
PERUVIAN AGRICULTURAL OUTPUT AND TITHES, 1791–1800=100

MEXICAN GDP PER CAPITA USING DIFFERENT SECTOR WEIGHTS, IN 1990 GEARY-KHAMIS DOLLARS
MEXICO'S GDP PER CAPITA INCLUDING AND EXCLUDING SILVER OUTPUT IN THE ESTIMATION, IN 1990 GEARY-KHAMIS DOLLARS
URBANIZATION RATES FOR MEXICO, 1550–1650, IN PERCENT

For Peru (Appendix Figure 2), we show that the use of the full demand approach would yield higher estimates than our own. We also used Allen et al. (Reference Allen, Bassino and Debin2011)'s real wages. The results still follow the same pattern and display similar GDP per capita levels.
Appendix B: Notes on Latin American Urbanization Data
Reliable figures on urban population in colonial Latin America are hard to find. To our knowledge, there are no consistent and comprehensive estimates of urbanization rates for colonial Latin America. While the Spanish crown conducted population surveys every century or so, the interest gravitated towards assessing the size of the Indian population, especially the working age male segment, for tribute and service purposes. To be accurate, especially in the early colonial period, that is, before 1700s, the statistics available for urban centers provide a good picture of the Spanish population. In particular, these accounts cite the number of “vecinos,” the Spanish male head of households, with sporadic mention of the rest of the population in the area (generally classified as Indians, mestizos, mulattoes, and black).
Some central settlements were established near agricultural and mining locations such as Zacatecas in Mexico and Potosí in Bolivia. In the fringes of the empire such as Montevideo in Uruguay and Buenos Aires in Argentina, settlements were initially fortresses to protect and to defend the colonial territory from competing empires. Other centers such as Lima in Peru and Veracruz in Mexico had multiple functions such as trade, defense, and administration. For further discussion, see Centro de Estudios y Experimentaciòn de Obras Pùblicas (1987) and Jorge Hardoy and Carmen Aranovic (Reference Hardoy and Aranovic1969).
To quantify the size of cities during colonial times, a few different sources are available. Comprehensive studies on urban centers in the world such as Tertius Chandler and Gerald Fox (Reference Chandler and Fox1974), Chandler (Reference Chandler1987), Paul Bairoch (Reference Bairoch1988), and Gilbert Eggiman (Reference Eggimann1995) provide figures for selected cities in the region in 50-year intervals. According to their methodology, these works look at geographical dictionaries and historical accounts. However, Chandler and Fox (Reference Chandler and Fox1974, p. 2) note that calculating population size is a puzzle and this exercise implies estimation methods to infer total population from imperfect data. In the absence of general population censuses, the data available only encompass a particular segment of the population (such as “vecinos” in Latin America) and multipliers are needed to estimate the total population. The results are rough figures of the main cities in the world. More recently, at the Center for Global History, E. Buringh has compiled a global dataset of urban settlement sizes from 1500 to 2000.
Using this dataset as a starting point, we consulted regional and national sources to supplement and corroborate the existing estimations. Our aim was to be as comprehensive as possible; however, we should point out that for the early colonial times (ca. 1550s–1650s), the figures are less reliable. While very accurate for total Spaniards they are quite vague for Indians, mestizos, and other castes. Overall, we have found that the figures from the late nineteenth century were quite accurate. This finding is not surprising, as most Latin American countries had, by then, carried out a national population census. For the earlier period, there are a few discrepancies. Our rule of thumb was to use the national or regional estimates whenever possible as we believe they provide more reliable information. In general, the sources consulted included geographical dictionaries, urbanization and population studies, traveller's accounts, colonial censuses, and regional economic studies. To be transparent with our methodology, we looked at the earliest national census available (1790 for Mexico and 1876 for Peru) to check for estimated urbanization rates and main urban centers. Following Álvarez-Nogal and Prados de la Escosura (2007), we define an urban center as having at least 5,000 inhabitants.
Fragmentary information for the late colonial period shows high urbanization. In 1791, the largest four cities in Peru (Lima, Ayacucho, Arequipa, and Cuzco) concentrated 13 percent of the total population—not taking into account Bolivia. Using the same methodology for Mexico, the urbanization rate (Mexico City, Guanajuato, Puebla, and Zacatecas), was 5 percent (Morse Reference Morse1974). Our estimations ca. 1790s, we include 12 and 37 urban centers with population more than 5,000 for Peru and Mexico, respectively.
Identifying the main urban centers from a postcolonial source may overlook the importance of certain cities during colonial times. To prevent this issue, we used A. de. Alcedo (Reference Alcedo1788)'s dictionary that listed and classified locations according to perceived size: city, town, and village. In the case of Mexico, the existing database was quite thorough in terms of the number of cities included; however, the extrapolation exercise was, at times, overestimating the degree of urbanization. For Peru, the opposite is true, the number of cities listed is fairly low giving as a result a low urbanization rate.
Bolivia
Estimating the urbanization level of Bolivia was plagued by lack of data. Compared to Peru, Bolivia has less frequent censuses and has received much less scholarly attention. To obtain additional estimates, we used regional sources such as Cook (Reference Cook1981), Olen Leonard (Reference Leonard1948), and Jose Macedonio Urquidi (Reference Urquidi1971). In addition, we identified the main urban centers using the 1900 census that listed them by department and province. By 1900 only nine urban centers had a population of more than 5,000 people.
Mexico
Of the more than 70 cities identified in Buringh (Reference Buringh and Hub2013)'s dataset, we were able to locate complementary sources for nearly 30 of them. The sources range from national censuses to regional and city studies. In particular, we were able to obtain official statistics for the late eighteenth century for the main Mexican cities as published by the INEGI in Estadísticas Históricas de México (EHM). In addition, this publication includes data for the main 25 cities in Mexico starting in 1790. We confirmed the relative importance of these cities using Secretaría de Gobernación (1993)'s work on population processes in Mexico.
For earlier periods, we used regional sources. In particular, we are indebted to the work by Bakewell (Reference Bakewell1971), D. A. Brading (Reference Brading1971), Eric Van Young (Reference Van Young1981), Taylor (Reference Taylor, Altman and Lockhart1984), and Rabell Romero (Reference Rabell Romero2008) for urban population estimations for Zacatecas, Guanajuato, Guadalajara, Oaxaca, and Puebla. As we present estimations in 50-year intervals, most figures are interpolated.
Peru
Using the Clio database as a starting point, we used the 1876 census to identify the main urban centers in Peru. According to this source, Peru had many urban settlements; however, most of them were fairly small as almost 85 percent had fewer than 1,000 inhabitants. The cities with population of more than 5,000 people were a handful, amounting to 19. To the original dataset, we added as many cities as possible provided we could find early population data to estimate the trajectory. As a result, we added Lambayeque, Moyobamba, and Chachapoyas.
For all cities, we tracked down different sources to obtain more accurate estimations on city size. For the early sixteenth century, we used Cook (Reference Cook1981)'s estimations for Cuzco, Chachapoyas, and Cajamarca. For the mid-late eighteenth century, Cosme Bueno (Reference Bueno1951) provided information for various locations such as Chachapoyas. For a few locations, we were able to identify a key source, for example in the case of Trujillo, Katharine Coleman (Reference Coleman and Robinson1979) offers useful data on urban population. Not surprisingly, Lima's population estimations are more frequent, we used the compilation presented in Tantaleán Arbulu (Reference Tantaleán Arbulú2011) and complemented them with figures from Frederick Bowser (Reference Bowser1977). As we present estimations in 50-year intervals, most figures are interpolated. For all cases, the 1850 population estimates were calculated using the 1876 census information.



