INTRODUCTION
Soft sediment ecosystems have a fundamental role in the functioning of marine systems both for the remineralization of organic matter and nutrients and as food producers for larger macrofauna and fish (Norling et al., Reference Norling, Rosenberg, Hulth, Gremare and Bonsdorff2007; Olsgard et al., Reference Olsgard, Schaanning, Widdicombe, Kendall and Austen2008). It has been estimated that continental shelf environments receive approximately half the nutrients required for primary production from remineralization within sediments (Pilskaln et al., Reference Pilskaln, Churchill and Mayer1998), whilst in some coastal seas it can be as high as 80% (Dale & Prego, Reference Dale and Prego2002).
Although organic matter remineralization in sediments is undertaken mainly by microorganisms, benthic macro- and megafauna inhabiting the sediments can significantly influence these processes through bioturbation, i.e. the turnover and movement of sediment (Papaspyrou et al., Reference Papaspyrou, Gregersen, Cox, Thessalou-Legaki and Kristensen2005; Koller et al., Reference Koller, Dworschak and Abed-Navandi2006; Waldbusser & Mainelli, Reference Waldbusser and Marinelli2006; Fanjul et al., Reference Fanjul, Grela and Iribarne2007; Kinoshita et al., Reference Kinoshita, Wada, Kogure and Furota2008). Variation in the availability of organic matter supply to the benthic environment also has an influence on the bioturbatory activities of the benthic organisms, thereby having a subsequent effect on carbon cycling and other biogeochemical processes (Nickell et al., Reference Nickell, Hughes, Atkinson, Eleftheriou, Ansell and Smith1995; Blair et al., Reference Blair, Levin, De Master and Plaia1996; Atkinson & Taylor, Reference Atkinson and Taylor2005).
In recent years, thalassinidean mud-shrimps (Crustacea: Decapoda: Thalassinidea) have been recognized as one of the most important bioturbating groups of organisms in the marine megabenthic community. Through their burrowing, burrow irrigation and feeding activities, these megafauna have been shown to have profound effects on biogeochemical cycling and on the structure of benthic communities (Atkinson & Taylor, Reference Atkinson and Taylor2005; Papaspyrou et al., Reference Papaspyrou, Gregersen, Cox, Thessalou-Legaki and Kristensen2005; Koller et al., Reference Koller, Dworschak and Abed-Navandi2006; Waldbusser & Marinelli, Reference Waldbusser and Marinelli2006; Berkenbusch et al., Reference Berkenbusch, Rowden and Myers2007; Norling et al., Reference Norling, Rosenberg, Hulth, Gremare and Bonsdorff2007; Pillay et al., Reference Pillay, Branch and Forbes2007; Kinoshita et al., Reference Kinoshita, Wada, Kogure and Furota2008; Vonk et al., Reference Vonk, Kneer, Stapel and Asmus2008).
Calocaris macandreae Bell (Calocarididae) is abundant in muddy sediments around British east and west coasts, extending from Scandinavia to West Africa and the Mediterranean, occurring from 15–1400 m (Ingle & Christiansen, Reference Ingle, Christiansen, Crothers and Hayward2004). This species constructs a characteristic burrow, whose tripartite junctions often result in surface openings occurring in groups of three (the total number of openings per burrow may be as many as seventeen, but is usually approximately half this number). The burrow consists of two horizons, one at approximately 10 cm depth in the sediment and another at around 20 cm depth where semicircular galleries of unestablished function are developed (Nash et al., Reference Nash, Chapman, Atkinson and Morgan1984).
Generally considered to be a deposit feeder, it has been speculated that the burow structure may be indicative of microbial gardening (Nash et al., Reference Nash, Chapman, Atkinson and Morgan1984; Pinn, Reference Pinn1995). A diversity of feeding strategies has, however, been attributed to this species. Pinn et al. (Reference Pinn, Atkinson and Rogerson1998) suggested that, although predominantly a deposit feeder, C. macandreae may supplement its diet with material of animal origin, which appeared to be confirmed by the mandible and gastric mill morphology (Pinn et al., Reference Pinn, Nickell, Rogerson and Atkinson1999; Coelho & Rodrigues, Reference Coehlo and Rodrigues2001). In addition, there has been some debate about the role of caching behaviour and the potential for bacterial gardening activity by C. macandreae (Nash et al., Reference Nash, Chapman, Atkinson and Morgan1984; Pinn, Reference Pinn1995).
It was therefore decided to investigate burrow dynamics since it might be expected that the geometry of the burrow of a deposit feeder will regularly change as it mines new sedimentary horizons. Secondly, a preliminary examination of nutrient exchange associated with burrow maintenance was undertaken. Finally, the suggestion that this species might be an opportunistic carnivore, an unusual strategy amongst thalassinideans, was revisited.
MATERIALS AND METHODS
Calocaris macandreae were collected from the Main Channel of the Clyde Sea Area (50°46′N 04°58′W) using a 2 m Aggasiz trawl. Fifteen individual acrylic aquaria (internal dimensions 25 × 10 × 35 cm—length × width × depth) were set up with native mud (to a minimum depth of 20 cm) and the sediment allowed to settle and compact for 8–16 weeks before individual C. macandreae were introduced. In addition, a large circular community mesocosm tank (120 cm diameter, mud depth 25 cm) was also set up and eight individuals were introduced. This density was chosen to represent a density within the range reported for the natural environment (e.g. Buchanan, Reference Buchanan1963; Calderon Perez, Reference Caldereon-Perez1981; Nash et al., Reference Nash, Chapman, Atkinson and Morgan1984; Pinn & Robertson, Reference Pinn and Robertson1998). The aquaria were kept in subdued lighting with a 12:12 light:dark regime in phase with their natural environment. Fresh filtered seawater was provided on a constant basis for the aquaria using a gravity fed system.
Medium-term burrow development and sediment movement
In the individual aquaria, bioturbatory activities were observed by eye during initial burrow construction and then assessed at intervals over the following seven months. The method of initial burrow construction will not be considered further here, having been described elsewhere (Nash et al., Reference Nash, Chapman, Atkinson and Morgan1984; Pinn, Reference Pinn1995). Instead, this work concentrated on the medium-term development of the burrow and associated sediment movement. Surface sediment profiles were used to assess changes in the surface topography over seven months from initial construction. The profiles were drawn on acetate which was placed against the aquarium wall, positioned using permanent markers so that the acetate could be repositioned and changes in surface topography assessed. Changes in the surface topography were analysed using fractal geometry. Fractals have regularly been used as a means of descriptive parameterization of patterns of tortuosity and topographical complexity (Baas, Reference Baas2002). The fractal dimension characterizes the extent to which the fractal fills up the embedding space (Baas, Reference Baas2002). In the current study, this could vary between one for a completely straight line and two for a line that completely fills the plane on which it occurs.
The sediment profiles were digitized using TechDig 2.0 (R.B. Jones©) and the fractal dimension (D) of each digitized profile was evaluated using the Fractal program (Nams, Reference Nams1996). Mean fractal values were calculated, which estimated the fractal D using a resampling version of the divider method. These fractal D values, over time, were compared using a mixed model between and within subjects ANOVA, also known as a split-plot design (SPANOVA). Time was defined as the between subjects factor and side of aquarium as the within subjects factor, and aquarium as the subject. Prior to analysis, data were tested for homogeneity of variances using Levene's test and homogeneity of intercorrelations using Box's M-statistic. Mauchly's test was used to determine sphericity. A Student–Newman–Keuls post-hoc test was conducted where significant SPANOVA results were obtained to determine where variations occurred.
Nutrient analysis
Concentrations of nitrite, nitrate, ammonia, phosphate and sulphate were measured in burrow and surface water collected from aquaria inhabited by Calocaris macandreae and a control aquarium that contained no C. macandreae. A cannula was permanently inserted into five of the individual aquaria so that water samples for nutrient testing could be removed without significant disturbance. Despite this precaution, several of the animals closed tunnels where the cannula had been inserted, thus preventing further sample collection, whilst another individual opened up a tunnel directly to the surface following the route of the cannula. These activities severely limited nutrient sample collection and it was only possible to take water samples over the period of 5 days. Consequently, these samples were treated as replicates resulting in N = 15 for the burrow water and overlying water samples and N = 5 for the control tank. Nutrient analysis was conducted using a standard Palin test kit with a Photometer 5000 and results analysed statistically using a Kruskal–Wallis test comparing results from within the burrow, surface water and the control tank.
Carnivory and caching behaviour
To test caching behaviour and carnivory in C. macandreae, Nephtys spp. (probably both N. caeca and N. cirrosa) and Angulus (=Tellina) tennuis were collected intertidally. The A. tennuis flesh was removed from the shell and the polychaetes killed using heat. In five aquaria containing individual C. macandreae, either Nephtys or A. tennuis flesh was deliberately introduced close to a burrow opening and observations made over a fifteen minute period. Similarly, in the large community aquaria, polychaetes and the bivalve flesh were introduced close to burrow openings along with pellets of commercially available salmon food. Time-lapse video recording was undertaken over a three day period to document the fate of the food, after which any remaining flesh or pellets were removed from the aquaria.
RESULTS
Burrow development and sediment movement
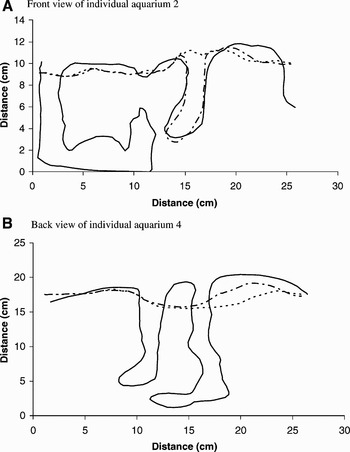
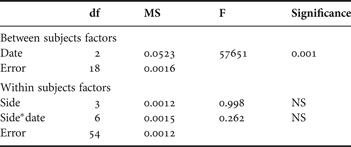
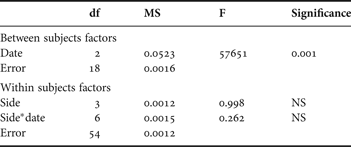
Within the first month, once initial burrow construction was completed, there was very little evidence of opening and tunnel development. Surface topography within the small aqauria varied relatively little in the first month of observations indicating that relatively little sediment expulsion occurred (Figure 1). Over the subsequent six months, however, considerable differences were observed, which were related to the development of shafts, tunnels and burrow openings (Figure 1). Despite this extensive burrow development, a considerable proportion of the sediment movement was of a subsurface nature and relatively little sediment was expelled from the burrow. SPANOVA found the changes in surface topography to be significant for date (F = 57651, df = 2, P < 0.001) but not ‘side of aquarium’ or the interaction between ‘side of aquarium’ and date (Table 1). The Student–Newman–Keuls test revealed two groupings, no significant difference was found for the fractal results over the first month. These were, however, significantly different from those obtained six months later.
Variation in surface topography including burrow openings when visible. Start of measurements represented by dotted line, after one month by dashed line and after seven months by solid line.

Fractal geometry SPANOVA results comparing changes in burrow morphology over time. NS, non-significant results.
The development of burrows in the large community aquarium over seven months also demonstrated little evidence of surface expulsion of sediment. Over time, the density of burrow openings increased from 11.26±11.36 m−2 after the initial period of burrow construction to 137.91±49.00 m−2 seven months later. This equates to 1.4 openings per Calocaris macandreae after the initial burrow construction period which rose to 17.2 openings per individual seven months later, i.e. similar to the maximum observed in the field. It should be noted, however, that during this period, burrow shafts were opened and closed at various intervals.
During the present study, it was noted that within the individual aquaria, areas of sulphide developed within the sediment. Where burrow tunnels were constructed, no sulphide patches were observed within approximately 15 mm of the burrow wall. In addition, C. macandreae was observed backfilling sections of the burrow, usually vertically descending shafts. These backfilled areas would eventually become anoxic with clear evidence of the presence of sulphide. Weeks or months later, some of the backfilled sections were opened up and the sediment moved elsewhere within the burrow complex during a period of intense activity lasting 15–30 minutes.
Nutrient analysis
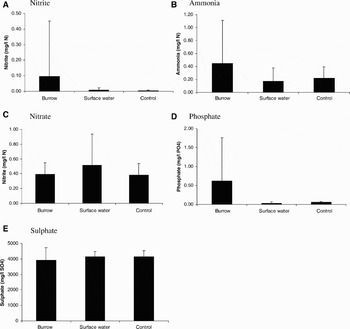
In general, levels of nitrite, ammonia and phosphate tended to be higher within the burrow than observed in the surface water or the control tank without Calocaris macandreae whilst no obvious pattern was observed for nitrate and sulphate (Figure 2). However, only the phosphate results were found to be statistically significant (Kruskal–Wallis, K = 12.85, df = 2 P < 0.01).
Variation in nutrient concentrations from burrows, surface water and the control tank. Error bars represent standard deviation.

Carnivory and caching behaviour
The Calocaris macandreae individuals in the large community mesocosm reacted much less strongly to the presence of animal material compared with individuals in the smaller individual aquaria. Approximately one-third of the material placed in the community tank was taken into the burrows, usually within 12 hours of it being placed on the sediment surface. In contrast, C. macandreae reacted almost immediately to the presence of Nephtys and A. tennuis flesh in all of the individual aquaria and the material was taken into the burrows. At the first tripartite junction below the opening used to access the flesh, or at the next junction, the individuals were observed macerating and consuming small quantities of the animal material for approximately five minutes. During this time, the large chelae were used to support the material and hold it before the mouthparts. Where the material was completely consumed, C. macandreae immediately began a period of grooming.
Where material remained after approximately five minutes of feeding activity, it was buried in the floor of the burrow away from the tripartite junction. Once a bolus of sediment had been placed over the remaining flesh, C. macandreae moved to the surface of the bolus and began to irrigate the burrow for approximately one minute. Sediment was then collected and moved from the nearest descending shaft to the burial site and, over a period of two minutes, the burrow walls/floor smoothed and flattened at the burial site. After this, the burrow was again irrigated, with the mud-shrimp positioned on top of the burial site. After approximately one minute of irrigation activity, C. macandreae moved to the nearest tripartite junction and began to groom.
DISCUSSION
Medium-term burrow development and sediment movement
The degree of sediment turnover by thalassinideans has been linked to feeding mode and organic content of the sediment (Stamhuis et al., Reference Stamhuis, Schreurs and Videler1997), with deposit feeders having higher levels of sediment bioturbation than suspension feeders or scavengers/gardeners. Calocaris macandreae is considered to be predominantly a deposit feeder (Buchanan, Reference Buchanan1963; Nash et al., Reference Nash, Chapman, Atkinson and Morgan1984; Pinn et al., Reference Pinn, Atkinson and Rogerson1998), so the lack of sediment expulsion after initial burrow construction seen in the present studies is in contrast to other thalassinidean deposit feeders. For example, Callianassa subterranea has been reported to expel up to 45.6 g dry wt ind−1 d−1 (Nickell et al., Reference Nickell, Hughes, Atkinson, Eleftheriou, Ansell and Smith1995) and C. filholi up to 61.6 g dry wt ind−1 d−1 (Berkenbusch & Rowden, Reference Berkenbusch and Rowden1999).
This lack of sediment expulsion is also evident when observing Calocaris-dominated sea bed using underwater television because there is little surface topography. The mesocosm tank imitated the lack of surface topography seen naturally. The average number of openings created by the individuals in the mesocosm tank was equivalent to the highest numbers recorded from the field, approximately 17 (Nash et al., Reference Nash, Chapman, Atkinson and Morgan1984). Perhaps the settled conditions within the tank and the lack of other burrowing megafauna enabled burrows to develop to greater complexity than is usually the case in the sea.
In addition to deposit feeding, C. macandreae is thought to supplement its diet with material of animal origin or possibly to garden bacteria (Nash et al., Reference Nash, Chapman, Atkinson and Morgan1984; Pinn et al., Reference Pinn, Nickell, Rogerson and Atkinson1999; Coelho & Rodrigues, Reference Coehlo and Rodrigues2001). If the organic content of the diet is being increased by the presence of animal material, it could be a possible explanation for the relative lack of sediment expulsion from the burrow. Also, C. macandreae may be creating conditions within its burrow that favour the development of microbial, protozoan or meiofaunal communities of dietary benefit.
The apparent deliberate creation of anoxic, sulphide-bearing sediment, which is then redistributed throughout the oxic areas of the burrow complex, is difficult to explain. Calocaris macandreae has a very high sulphide tolerance, similar to that of the hydrothermal vent crab Bythograea thermydron (Atkinson & Taylor, Reference Atkinson and Taylor2005) and is able to detoxify sulphide through the formation of thiosulphate (Johns et al., Reference Johns, Taylor, Atkinson and Grieshaber1997). It is capable of withstanding prolonged hypoxia and even anoxic conditions by switching to anaerobic respiration (Atkinson & Taylor, Reference Atkinson and Taylor2005). The creation of anoxic, sulphide-bearing sediment that is subsequently redistributed could be related to the utilization of the products of bacterial degradation as a potential food source, either directly or indirectly by promoting the growth of microorganisms within the burrow wall sediment (see discussion later). These activities would indirectly affect nutrient fluxes within the burrow and between the burrow water and the water overlying the sediment.
Nutrient analyses
Burrow irrigation by thalassinidean shrimps results in an influx of oxygen rich water into the burrow and creates an efflux of water containing dissolved nutrients from microbial decomposition processes (Webb & Eyre, Reference Webb and Eyre2004; Atkinson & Taylor, Reference Atkinson and Taylor2005). Although differences in the nutrient content were observed between the overlying water and that of the burrows, these differences were generally not significant. The only exception to this was phosphate, where there was a significantly greater concentration in the burrow waters than in the overlying water or control aquaria which did not contain Calocaris macandreae.
The nutrient results indicate that the presence of the C. macandreae does influence the rates of remineralization. For phosphate, in particular, a similar pattern of higher phosphate concentrations in burrow water than for the overlying water has been observed for two other thalassinideans, Callichirus major (D'Andrea et al., Reference D'Andrea, Aller and Lopez2002) and Neaxius acanthus (Vonk et al., Reference Vonk, Kneer, Stapel and Asmus2008).
In the current study, although not statistically significant, the concentrations of nitrite and ammonia tended to be greater within the burrows and nitrate greater in the overlying water, suggesting enhanced rates of denitrification within the burrow system. Similar results have been observed for the thalassinideans C. major (D'Andrea et al., Reference D'Andrea, Aller and Lopez2002), Pestarella (=Callianassa) tyrrhena (Papaspyrou et al., Reference Papaspyrou, Thessalou-Legaki and Kristensen2004), Trypaea australiensis (Webb & Eyre, Reference Webb and Eyre2004) and Upogebia deltaura, but not Callianassa subterranea (Howe et al., Reference Howe, Rees and Widdicombe2004) or Neaxius acanthus (Vonk et al., Reference Vonk, Kneer, Stapel and Asmus2008). Most recently, Olsgard et al. (Reference Olsgard, Schaanning, Widdicombe, Kendall and Austen2008) reported that the presence of Calocaris macandreae in sediment cores resulted in an increased uptake of dissolved inorganic nitrogen in the sediment.
Associated with the increased sediment–water interface area of burrows, an increased supply of nitrate to anaerobic sediments will promote denitrification (Howe et al., Reference Howe, Rees and Widdicombe2004). However, if this was the sole mechanism through which denitrification rates were influenced by thalassinideans, then similar results would be expected for all species that create burrows increasing the area of the sediment–water interface. Consequently, Howe et al. (Reference Howe, Rees and Widdicombe2004) proposed that the increased rates of denitrifcation observed for some species but not others were fuelled by nitrate generation from within the sediment. Similarly, Webb & Eyre (Reference Webb and Eyre2004) found that T. australiensis stimulated denitrification through the tight coupling of nitrification and denitrification processes. It is likely that a similar mechanism operates in relation to C. macandreae burrows.
Feeding, carnivory and caching behaviour
In the present work, Calocaris macandreae readily fed on animal tissue. This appears to be the first direct observation of carnivory in this species. It is likely that this is opportunistic behaviour. Thalassinideans, including C. macandreae, rarely leave their burrows once constructed, but this species was observed to sequester material adjacent to the burrow opening in the present study and it is likely that some animal material will be encountered sub-surface during burrowing activities. Although predominantly a deposit feeder, there is some evidence that C. macandreae supplements its diet with material of animal origin.
Blegvad (Reference Blegvad1914) found ‘bottom detritus’ and remains of a goniadid polychaete in the stomachs of C. macandreae and concluded it was ‘a carnivorous detritus eater’. Interestingly, Elmhirst (Reference Elmhirst1935) reported ‘the shrimps feed on mud, refusing vegetable material and burying any animal material offered to them. Whether such buried food stuff is used later is not yet clear.’ Runnstrøm (Reference Runnstrøm1925) had earlier observed similar caching behaviour of pieces of mussel flesh, but did not observe any feeding on this material. He did not consider this material to be a food reservoir but did think that the nutritional quality of the mud would be improved when the material decomposed.
Buchanan (Reference Buchanan1963), though finding polychaete setae and shell fragments in the gut, concluded that the proportion of these was no different than in the surrounding sediment and that C. macandreae was a non-selective deposit feeder. Calderon-Perez (Reference Caldereon-Perez1981) reported that most of the 200 C. macandreae stomachs examined in his study contained mud, but some contained polychaete setae and pieces of flesh (probably polychaete), Calocaris eggs, crustacean remains, and in one case the remains of a small conspecific, indicating cannibalism. He found that C. macandreae would bury pieces of bivalve muscle whereas live polychaetes were offered but ignored. Calderon-Perez (Reference Caldereon-Perez1981) concluded that ‘the feeding habits of C. macandreae are far from clear’ and speculated that filtering re-suspended sediment may also be a possibility.
Pinn et al. (Reference Pinn, Atkinson and Rogerson1998) found unidentifiable well-macerated animal material in the guts of C. macandreae throughout the year, dominating the diet in one set of monthly samples. Gut contents analysis suggested that the species showed varied feeding strategies including scavenging, carnivory, suspension feeding and deposit feeding, with the ability to selectively feed to enhance its diet. Further, Pinn et al. (Reference Pinn, Nickell, Rogerson and Atkinson1999) noted that the structure of the gastric mill of C. macandreae was suggestive of a cutting and tearing function as well as grinding sedimentary material. Coelho & Rodrigues (Reference Coehlo and Rodrigues2001), in a discussion of thalassinidean feeding, drew attention to the unusual mandibles of C. macandreae and suggested that their structure would merit further investigation given the varied diet attributed to C. macandreae. Most recently, Hill (Reference Hill2008) used stable isotope analysis to demonstrate that C. macandreae collected from a site in the western Irish Sea had a signature consistent with deposit feeding. Carnivory is rare amongst thalassinideans (Coelho & Rodrigues, Reference Coehlo and Rodrigues2001). Most species are deposit feeders, suspension feeders or cache plant material (Atkinson & Taylor, Reference Atkinson and Taylor2005). The abundance and wide depth distribution of C. macandreae, which is much greater than most thalassinideans, may be facilitated by its ability to opportunistically utilize a range of different food sources.
The deliberate burial of material within the burrow complex was observed in the present study, reinforcing past observations (Runnstrøm, Reference Runnstrøm1925; Elmhirst, Reference Elmhirst1935; Calderon-Perez, Reference Caldereon-Perez1981). In other thalassinidean species, accumulation of plant material within burrows has been observed directly or inferred from some burrow morphologies. For example, Pestarella (as Callianassa) tyrrhena and Corallianassa longiventris have been observed accumulating seagrass debris in burrow chambers, possibly for microbially-mediated fermentation and future nutrition (Abed-Navandi et al., Reference Abed-Navandi, Koller and Dworschak2005; Dworschak et al., Reference Dworschak, Koller and Abed-Navandi2006). Neaxius acanthus collects and shreads significant quantities of seagrass material which float past the burrow opening and incorporates it into the burrow lining, which was considered to be indicative of microbial gardening (Kneer et al., Reference Kneer, Asmus and Vonk2008; Vonk et al., Reference Vonk, Kneer, Stapel and Asmus2008). However, there have been no reports of material of animal origin being treated in a similar manner by species other than Calocaris macandreae.
In the present observations, the careful flattening of the burial area and subsequent irrigation, suggests that flesh was buried permanently, possibly to simulate bacterial degradation. In contrast, sulphidic patches that reflect anaerobic metabolic procesess within the sediment, did not appear to be fed upon directly by C. macandreae, but were redistributed within the burrow; both these activities are indicative of microbial gardening. Clearly, much is still to be elucidated about the feeding ecology of this mud shrimp.
ACKNOWLEDGEMENTS
Thanks are due to the crew of RV ‘Aora’ for sample collection. This research was funded by a Nuffield Foundation Grant (NAL/00612/G) to E.H.P.