INTRODUCTION
Rice (Oryza sativa L.) production is a fundamental component of Cambodian economy, cultivated by over 80% farmers (Bingxin and Xinshen, Reference Bingxin and Xinshen2011) and accounting for 2.96 million ha (Ministry of Agriculture Forestry and Fisheries, Cambodia (MAFF), 2011) of Cambodia's 4.01 million ha (2011) arable land. Rice exports in 2009/2010 were estimated at around 800,000 tonnes with the Cambodian government actively pursuing an increase to 15.0 million tonnes of rough rice (9.45 million tonnes milled) by 2015 (United States Department of Agriculture (USDA), 2010). In targeting the government's milled rice export policy, the Cambodian Agricultural Research and Development Institute (CARDI) has devoted considerable effort to the development and promotion of 10 high yielding rice varieties suitable for the export market, in addition to 22 improved varieties aimed at local consumption (Sarom et al., Reference Sarom, Chaudhary, Javier, Makara, Sophany, Yadana, Hel, LeangHak, Sidhu, Sovith, Puthea, Sopheap and Visarto2001). However, achieving export growth from small-scale farmers in marginal and variable rainfed lowland rice ecosystems is at risk if depending on conventional breeding or genetic development alone, and must include participatory crop improvement strategies (Almekinders and Elings, Reference Almekinders and Elings2001) for developing adaptation capacity through improved farming practice to manage the challenges of seasonal climate variability and future climate change. Crop growth simulation models can be used to extrapolate from experimental research to wider environments (Bouman and Vanlaar, Reference Bouman and Vanlaar2006; Probert et al., Reference Probert, Keating, Thompson and Parton1995) and have been employed in understanding influence of climatic variables on crop productivity and long-term trends in both potential and on-farm rice and wheat yields (Pathak et al., Reference Pathak, Ladha, Aggarwal, Peng, Das, Singh, Singh, Kamra, Mishra, Sastri, Aggarwal, Das and Gupta2003). Cropping system models are widely acknowledged as useful tools in yield gap analysis (Bhatia et al., Reference Bhatia, Singh, Wani, Chauhan, Kesava Rao, Mishra and Srinivas2008; Bindraban et al., Reference Bindraban, Stoorvogel, Jansen, Vlaming and Groot2000; Lobell et al., Reference Lobell, Cassman and Field2009; van Ittersum et al., Reference Van Ittersum, Cassman, Grassini, Wolf, Tittonell and Hochman2013) but require thorough testing and validation to establish credibility (Boote et al., Reference Boote, Jones and Pickering1996). The Agricultural Production Systems Simulator (APSIM) model (Keating et al., Reference Keating, Carberry, Hammer, Probert, Robertson, Holzworth, Huth and Hargreaves2003) has been demonstrated as a useful tool for rice system research (Gaydon et al., Reference Gaydon, Probert, Buresh, Meinke, Suriadi, Dobermann and Bouman2012); however, all crop models should be evaluated in the environment of interest if the simulated results are to be credible (Timsina and Humphreys, Reference Timsina and Humphreys2006), as model calibration relies on capturing differences between rice varieties.
This paper describes an iterative process for calibrating the ORYZA 2000 model (Bouman and Vanlaar, Reference Bouman and Vanlaar2006) in APSIM version 7.3 and the methodology employed in developing varietal-specific coefficients for 15 Cambodian rice varieties from a typical agronomic field experiment. The calibrated APSIM-Oryza model (Gaydon et al., Reference Gaydon, Probert, Buresh, Meinke, Suriadi, Dobermann and Bouman2012) is then used to simulate ‘real-world’ crops using on-farm yield data for six rice varieties planted in 54 farmer fields on 32 farms in two villages in Southeastern Cambodia. Once calibrated and validated on-farm, local credibility of the model can be established. The model can then be used as an analysis tool to identify and evaluate production constraints and to stimulate discussion around options for improving farmer practice (FP) in closing the current gap between potential rice yield and those obtained from current on-farm practice.
MATERIALS AND METHODS
Field experiments
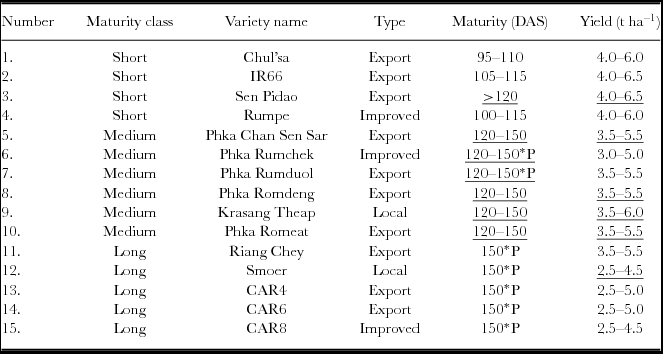
A field experiment at the CARDI campus outside Phnom Penh (11.476° N, 104.809° E) measured physiological traits of 15 important rice varieties during the wet season of 2011 in order to parameterise the Oryza model in APSIM. Temporal measurements of climate, phenology, crop growth and yield data were collected for model calibration. The soil at the CARDI site, described by White et al. (Reference White, Oberthur and Sovuthy1997), is classified as Prateah Lang with a pH of 5.7 and organic carbon of 0.47% (0–15 cm). The site was irrigated and puddled prior to transplanting. The experiment evaluated 15 varieties, 10 of which were promoted by the government as being suitable for export, three were recommended for domestic sale and two were traditional lines from villages in Svay Rieng province (11.075° N, 105.803° E). The selected varieties (Table 1) represent three maturity classes: short duration (80–100 days to maturity), medium duration (100–120 days) and long duration (>120 days to maturity). The CARDI-expected yield range is a guide for farmers and should be considered attainable yields achievable with best management practice and optimal seasonal conditions (Table 1). A replicated (three) randomised block design was used. Seeds from all varieties were sown on 23rd June 2011 with seedlings transplanted after 21 days on 14th July 2011 at a rate of three plants per hill by 25 hills m−2. Basal fertiliser (45 kg ha−1 of urea, 50 kg ha−1 of diammonium phosphate and 50 kg ha−1 of potassium chloride) was applied to all treatments on 13th July 2011 after puddling and prior to transplanting. Additional urea fertiliser was applied to the short duration varieties on 16th August 2011 (27.3 kg ha−1), 33 days after transplant (DAT). Medium and long duration varieties received three top dressings of urea (27.3, 13.7 and 27.3 kg ha−1) on 16th August (33 DAT), 17th September (65 DAT) and 21st September 2011 (69 DAT) respectively. A supplementary application of urea, 13.7 kg ha−1, was applied to all treatments on 19th August 2011 (36 DAT) to compensate for potential nitrogen loss from rainfall-induced overflow of bunds on 16th August 2011. The depth of water in bunded plots was measured at regular intervals throughout the growing season and irrigation was applied regularly to maintain continuous flooding of all plots of >50 mm.
CARDI-estimated days to maturity and expected yield range for 15 selected varieties for three maturity classes (short, medium and long duration).

Underscored values are estimates of expected maturity and yield potential based on maturity class type.
*P denotes photoperiod sensitive variety, generally flowering between early- and mid-November.
Observations of times when 50% of plants within each treatment reached the phenological stages of panicle initiation (PI), crop flowering (Fl) and physiological maturity (PM) (>90% of filled grains yellow and hard) were recorded. Biomass samples were collected at each phenological stage from three quadrats of 0.24 m2 (six hills) in each of the three replicates and oven-dried at 60 °C. Plant counts were documented on 22nd August 2011 (short) and 20th September 2011 (medium and long) in all treatments. A final oven-dried grain yield was recorded after physiological maturity and 1000 grain weights were measured. Plant counts (6 samples × 3 reps) at PI stage on 22nd August 2011 (short duration) and 20th September 2011 (medium and long duration) were undertaken and stem numbers per plot were counted. Appropriate chemical control for weeds, insect pests and diseases was applied during the growing season as required. Bird exclusion netting was erected over the experimental plots to avoid bird damage and grain loss during the growing season. Data from an automatic weather station located at the CARDI field site were used to calculate daily values for maximum and minimum air temperature (°C), total solar radiation (MJ day−1) and rainfall (mm). Soils were sampled (Dalgliesh and Foale, Reference Dalgliesh and Foale1998) at the depths of 0–15, 15–30, 30–60, 60–90 and 90–120 cm for gravimetric moisture content and soil nitrogen prior to crop establishment and following final maturity harvest. Characteristics related to soil's plant available water capacity (PAWC) were measured using the field-based technique described by Dalgliesh and Foale (Reference Dalgliesh and Foale1998). This included the measurement of Drained Upper Limit (DUL), Crop Lower Limit (CLL) and Bulk Density (BD) and the calculation of Plant Available Water Capacity (PAWC). Hydraulic conductivity (KSAT) is defined as a saturated percolation rate (mm) between soil layers in the model and was developed for the local soil type from the relationship between downward water movement and clay content as described by Tsubo et al. (Reference Tsubo, Fukai, Tuong and Ouk2007) for rice soils in the Mekong region.
On-farm trials were also conducted in two villages in Svay Rieng province during the 2011 wet season, offering farmers their first opportunity to evaluate the drum seeding technology (Bautista, Reference Bautista1999) and compare recent CARDI releases of short and medium duration rice varieties. Traditional farmer practice is based on transplanting 25–45-day seedlings of local medium (<130 days to maturity) and long duration (120–150 days to maturity) varieties in late June to early July. Crops are rainfed and grown using low inputs of nitrogen fertilisers (<20 kg N ha−1) or organic sources of animal manures (<600 kg ha−1) and hand-harvested in November–December. Yields of 1.5–2.5 t ha−1 are typical. In comparison, rapid crop establishment through the introduction of direct seeding (DS) and the introduction of short duration, modern varieties (90–110 days to maturity) in particular seasons provide the option of planting a second crop in mid-August to early September. DS crops follow initial land preparation at the start of monsoon rains in early to mid-May and combined with high yielding short duration varieties, the use of higher application of nitrogen fertiliser (50–100 kg ha−1), improved agronomic management and access to supplementary irrigation have potential for achieving CARDI-attainable yields of 5.0–7.0 t ha−1. On-farm yields were used to validate the model in a ‘real world’ situation comparing the predicted and observed yields for a number of treatments related to planting method, variety, fertiliser application and time of planting. Fifty-four farmer fields in 32 farms in the villages of Koul (11.183° N, 105.666° E) and Kbal Damrey (11.233° N, 105.666° E) sown to the varieties of Chul’sa, IR66, Sen Pidao, Smoer, CAR4 and Krasang Theap were selected for model validation. Simulated results for direct seeding and conventional transplant (CT) of newer CARDI varieties are compared with the farmer practice of a transplanted medium duration variety, Krasang Theap, in adjacent fields.
Model calibration
Bouman and Vanlaar (Reference Bouman and Vanlaar2006) provided a comprehensive description of the Oryza 2000 model. However, a brief description of the processes and inputs used in model calibration is provided to explain the varietal calibration process. The APSIM-Oryza input file for rice, Oryza.xml was modified iteratively as proposed by Timsina and Humphreys (Reference Timsina and Humphreys2006) for each variety, comparing simulated values with observed data for phenology, biomass accumulation and grain filling. Key input parameters describing local weather, soil water, soil nitrogen and agronomic management were specified in APSIM-Oryza using data obtained from an on-site automatic weather station, local soil characterisation and detailed records on crop management. Soil parameter values were measured for hydraulic conductivity (KSAT) values, specified to capture the effect of puddling in reducing infiltration rates. Pond depth was measured at critical times of panicle initiation and flowering as a check of modelled depth of pond.
Determination of phenological coefficients is essential for model calibration as phenology is one of the most important characteristics for determining grain yield in rainfed lowland rice (Fukai, Reference Fukai1999) and is therefore the first critical step in the development of varietal characteristics. Phenological phases of a developing rice crop are described as four distinct periods between emergence and physiological maturity and are reported in the model as the variable, DVS (developmental stage). Rate of phenological development (°C d−1) for each phase, emergence to start of photoperiod sensitivity (DVS 0.0–0.4); photoperiod sensitivity to panicle initiation (DVS 0.4–0.65); panicle initiation to start flowering (DVS 0.65–1.0) and flowering to physiological maturity (DVS 1.0–2.0) are variety-specific. Varietal photoperiod sensitivity (PPSE) is described in the model by the parameters photoperiod sensitivity (h−1) and optimum photoperiod (MOPP; h) and is set at 0.0 and 11.5 respectively for all evaluated varieties. An iterative approach was applied in deriving variety-specific parameters for each of the four phases from observed data for panicle initiation, flowering and physiological maturity. Variety-specific parameters for development rates during the juvenile phase (DVRJ), photoperiod sensitive phase (DVRI), panicle development (DVRP) and reproductive phase (DVRR) were modified for each of the 15 varieties to simulate the observed rate of development between each stage. Phenological developmental rates were specified and tested against field observations.
Once phenological developmental rates have been specified and correlated with field observations, then maturity class-specific coefficients describing biomass development are modified. These values describe the maximum relative growth rate of leaf area development (RGRLMX) and partitioning rate of carbon, as a dry matter fraction, to plant components of shoot (FSH), leaf (FLV), stem (FST) and storage organ (FSO) for a specified phenological stage described in DVS units. One thousand gain weights measured at harvest for each variety were entered directly into the model input file as maximum individual grain weight (WGRMX) in mg grain−1. The process for deriving these parameters is described by Kropff et al. (Reference Kropff, van Laar and Mathews1994) and applied by Swain et al. (Reference Swain, Herath, Bhaskar, Krishnan, Rao, Nayak and Dash2007) in developing coefficients describing 12 rice varieties in India for use in the Oryza 1N model. Correlation of simulated with measured total biomass data collected at three growth stages (panicle initiation, flowering, physiological maturity), and grain yield at physiological maturity was applied in absence of more detailed crop growth data on partitioning of carbohydrate to leaf, stem and panicle. Grain yield developed under optimal growing conditions in the absence of biotic and abiotic stress for all short duration varieties was used in deriving model coefficients describing grain filling. For medium and long duration varieties, subject to lodging at maturity, an iterative process based on measured biomass at anthesis and optimal harvest index (HI) for maturation type was applied to deriving suitable model coefficients.
Model validation
The performance of a calibrated APSIM-Oryza model was evaluated using an independent dataset from on-farm trials in 2011. Direct seeding and conventional transplant of five improved CARDI varieties were compared with local farmer practice for one transplanted medium duration variety, Krasang Theap. The model was specified for two local soils described in detail by White et al. (Reference White, Oberthur and Sovuthy1997) as Prey Khmer (Dystric Fluvisols) and Koktrap (Plinthic Acrisols, Gleyic Acrisols) and using soil characterised for use in APSIM from field-based techniques described by Dalgliesh and Foale (Reference Dalgliesh and Foale1998). Local meteorological input files for maximum and minimum temperature, rainfall and total solar radiation were created from automatic weather station data recorded in each village. APSIM-Oryza was configured for a standard sowing configuration of three plants per hill by 25 hills per m2 for all treatments. The model was initialized in early January when soil water and soil NO3 levels in the profile are negligible. Bund heights were set to 300 mm. DS and CT treatments received CARDI-recommended nitrogen rates of 50 kg ha−1 (Kbal Damrey) and 65 kg ha−1 (Koul) split at sowing or transplant and panicle initiation. Farmer practice comprised 28 kg ha−1 of nitrogen split between transplant and 30 days after transplant. One irrigation of 50 mm was applied in the model following germination (DS) and transplanting (CT) to remove potential water stress effects on early crop establishment in the model. Measured and simulated days to maturity, total biomass at flowering and maturity, and final grain yield were compared statistically and root mean square deviation (RMSD (Eq. 1)) was calculated for each maturity class (short, medium, long). Data from all maturity classes were combined for determining slope (a), intercept (b) and coefficient of determination r 2 of the regression between simulated (Y sim) and measured (X meas) values,
 \begin{equation*}
{\rm RMSD} = \sqrt {\frac{{\sum\nolimits_{i = 1}^n {\left( {X_{{\rm meas},j} - X_{{\rm sim},j} } \right)^2 } }}{n}.}
\end{equation*}
RESULTS
Field experiment
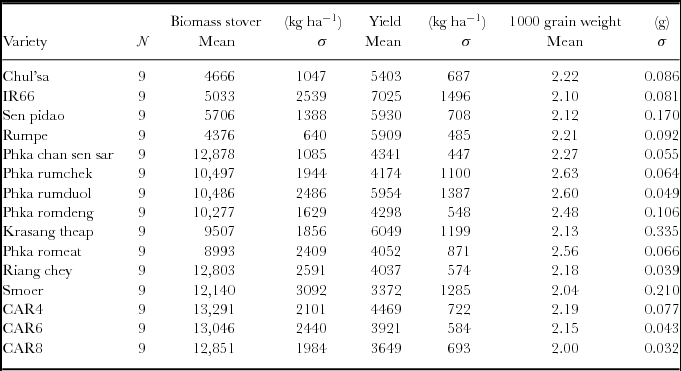
The CARDI field experiment was well managed, exhibiting no symptoms of nutrient disorder in all treatments throughout the growing season. Biomass development between planting and flowering stage for all treatments suffered no apparent abiotic stress, with all measured data included in varietal calibration. Pond water levels were maintained at >50 mm, specifically during critical periods of growth from panicle initiation to flowering (Figure 1). Significant reshooting of stubble post-harvest was observed in the high yielding short duration treatments where grain yield exceeded 5.4 t ha−1. Stem numbers were significantly higher in the short maturity class compared with the medium and long varieties but were consistent within each class type. Medium and long duration varieties are generally morphologically different to shorter maturing lines, growing taller (longer internodes) and allocating more carbon to stem for structural support, resulting in lower observed stem numbers per m2 (567 short, 282 medium, 243 long). Short duration varieties achieved close to their yield potential, particularly variety IR66 yielding 7.03 t ha−1 (standard error of the mean (s.e.) 0.498). All final grain yields have been reported, including lines subject to crop lodging as a result of high winds during grain filling (Table 2). However, data on final grain yields for the affected lines have been excluded from the model calibration process. Filled spikelets at maturity for all varieties were observed at 89.0% (s.e. 0.16). Spikelet fertility was not measured. Total biomass measured at flowering was consistent within maturity classes for short (6.1 t ha−1, s.e. 0.234), medium (10.4 t ha−1, s.e. 0.692) and long duration (14.5 t ha−1, s.e. 0.921) varieties. Stover and 1000-grain weight from the final harvest at physiological maturity for each of the 15 varieties evaluated are reported in Table 2.
Simulated and measured depth (mm) of ponded water in experimental plots during the growing season. Depth of pond water for measured dates was used as an input into the model. Phenological stages of PI and FL are indicated in the figure showing adequate water levels in the pond. Sufficient water levels reduce the potential for water and nitrogen stress in crop during these critical growth periods.
Results from the CARDI field trial for stover (total biomass grain; kg ha−1), grain yield (kg ha−1) and 1000-grain weight (g) of 15 rice varieties.
N: number of samples measured (3 quadrats × 3 reps); σ: standard deviation.
Model calibration
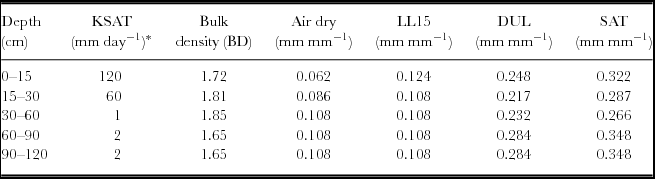
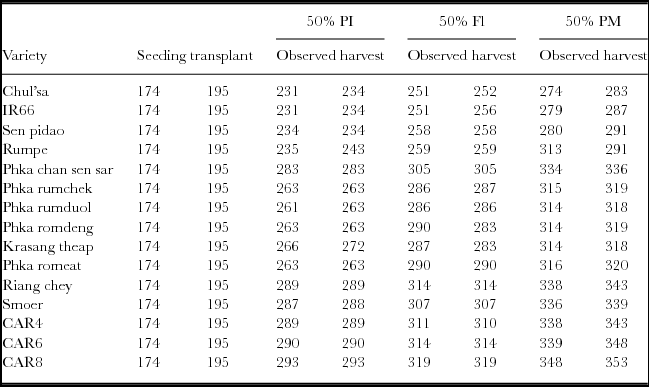
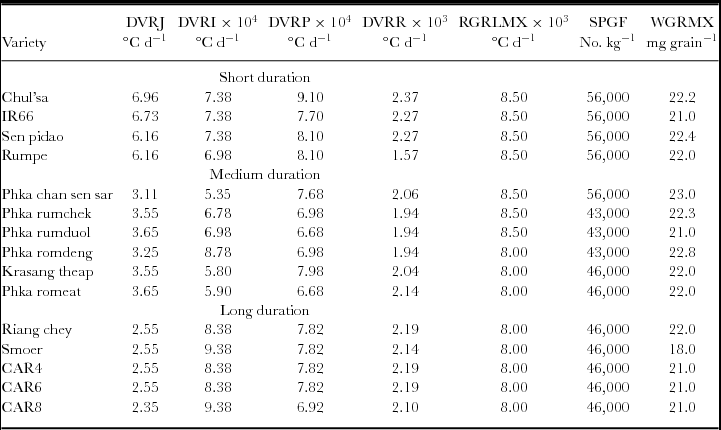
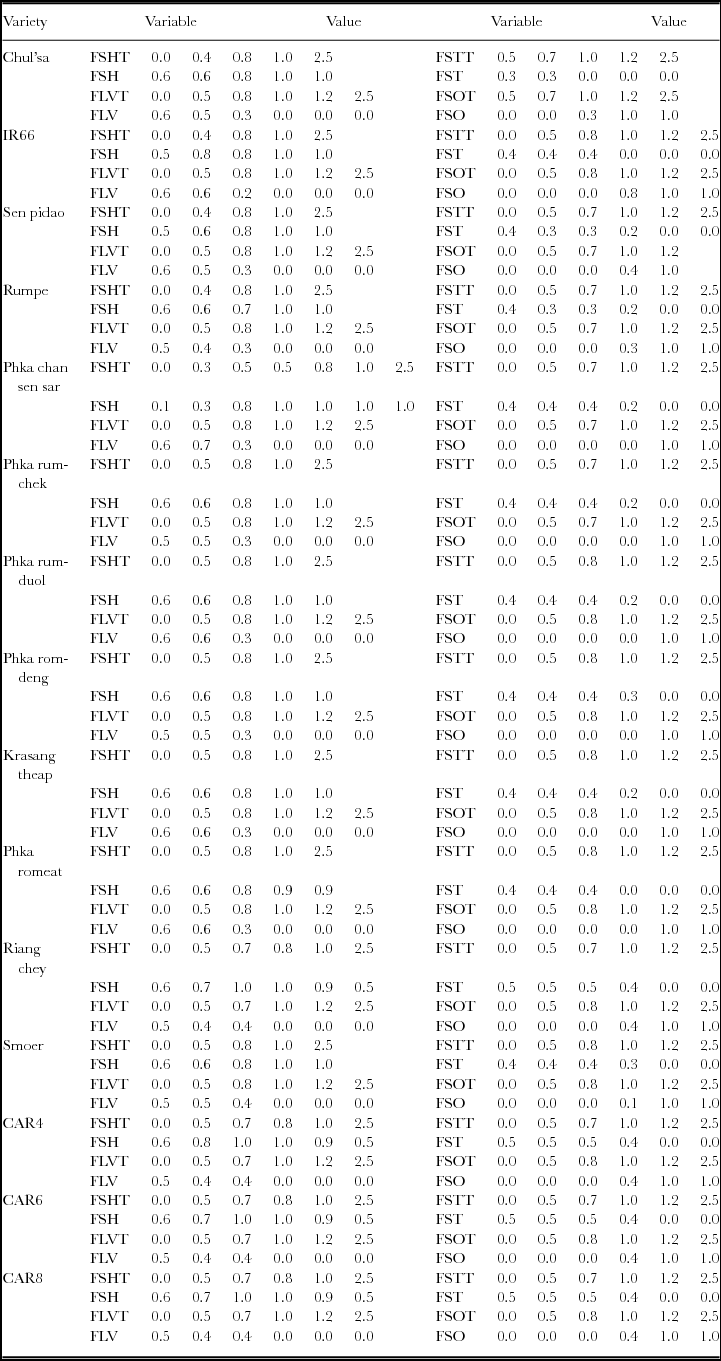
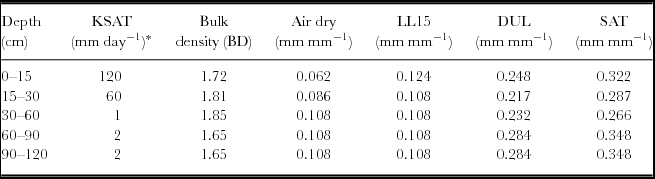
Key input parameters for agronomic management, weather and soil were specified in APSIM-Oryza using data obtained from an on-site weather station (Figure 2), local soil characterisation (Table 3) and detailed crop management records. Measured soil nitrogen of 39.3 kg ha−1 in the top 60 cm prior to crop establishment was used to initialise starting soil nitrogen in the model. Simulated depth of pond water during the growing season was cross-referenced against measured values for critical stages of panicle initiation and flowering (Figure 1). An iterative approach was applied to derive variety-specific parameters for each of the three phases from observed data (Table 4) for panicle initiation, flowering and physiological maturity. This method is applied initially to derive phenology parameters, then to biomass parameters and finally to grain number and grain size parameters. The results are demonstrated for the variety, Sen Pidao (Figures 3a and 3b). This process was applied to each of the 15 varieties and reported as variety-specific phenological coefficients (Table 5) and coefficients describing carbon partitioning in the model (Table 6). Simulated stages from emergence to panicle initiation, flowering and physiological maturity correlated well with observations (r 2 = 0.99) for all maturity classes (Figure 4). Observed and predicted total biomass for all 15 varieties at three phenological stages correlated highly (r 2 = 0.96) with experimental results (Figure 5a). Biomass attained at anthesis for both medium and long maturation varieties is considered near experimental potential as a result of controlled water and nitrogen management. Observed and predicted grain yield for short and medium varieties (Chul’sa, IR66, Sen Pidao, Rumpe, Phka Rumduol and Krasang Theap) are presented in Figure 5b.
Measured and estimated (*) soil characterisation data for Prateah Lang soil at the CARDI research farm, Phnom Penh (2010) used in specifying APSIM-Oryza. Hydraulic conductivity (KSAT) values have been specified to capture reduced saturated percolation rates as a result of puddling and a compacted sub-surface layer.
Observed growth stages and biomass sampling dates (day of year) for each of the 15 varieties.
Variety-specific growth parameters used in the calibration of APSIM-Oryza model from experimental data. Development rates are of juvenile phase (DVRJ), photoperiod sensitive phase (DVRI), panicle development (DVRP), reproductive phase (DVRR), maximum relative growth rate of leaf area development (RGRLMX), spikelet growth factor (SPGF), maximum individual grain weight (WGRMX).
Variety-specific coefficients describing partitioning rate of carbon as a dry matter fraction to plant components of shoot (FSH), leaf (FLV), stem (FST), and storage organ (FSO) as a function of development stage (FSHT, FLVT, FSTT and FSOT).
Daily maximum and minimum air temperature (°C), total solar radiation (MJ day−1) and rainfall (mm) recorded by the CARDI automatic weather station in 2011 and used in APSIM-Oryza for model calibration.
(a) Corresponding observed and predicted phenological stages in development stage units (DVS) for PI, Fl and PM for variety, Sen Pidao. (b) Example of measured and predicted biomass in kg ha−1 at PI, Fl and PM and rice yield (kg ha−1) at PM for short duration variety, Sen Pidao.
Observed and predicted development time to PI, Fl and PM for all 15 varieties. Values are days after emergence (DAE). Symbols represent the short, medium and long varieties, while shading represents stages of development.
(a) Observed and predicted total biomass (kg ha−1) collected at the stages of PI, Fl and PM. (b) Observed and predicted grain yield in kg ha−1 for short (S) and medium (M) duration varieties. Error bars on the x-axis represent mean standard error.
Although the experimental site is considered uniform (based on pre-plant soil analysis), parameterising the model for one initial soil condition and applying consistent management to all treatments can fail to capture inherent spatial variability or subtle differences in applying management operations. The initial simulated yield for variety IR66 correlated well with the observed mean values for all replicate samples but failed to capture the full range of observed plot yields. Field observations suggest that for the IR66 treatments, adequate nitrogen levels were maintained throughout the growing season. Increasing initial soil nitrogen availability in the model for the IR66 treatment only results in a simulated yield of >7.0 t ha−1, and is comparable with field observations. CARDI currently maintains a published database of expected rice yields for a number of released varieties. Experimental results from 2011 have contributed to the revision of potential yield for IR66 to 8.5 t ha−1.
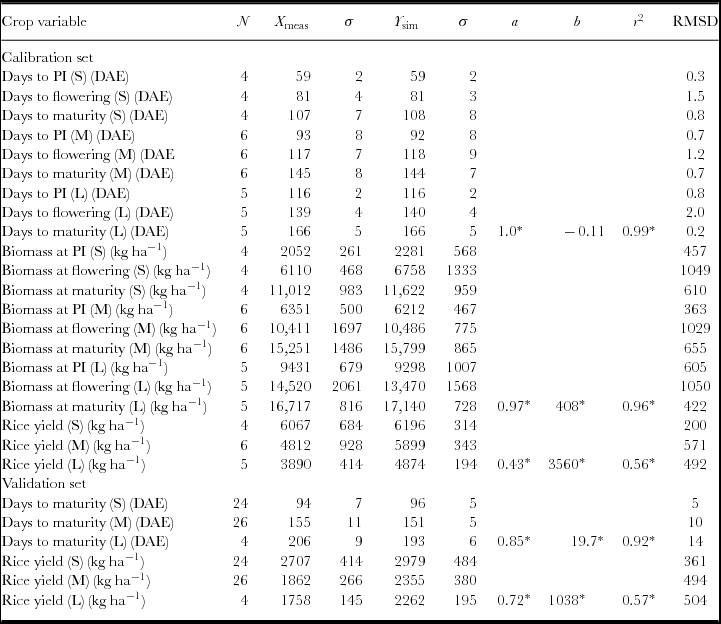
Statistical analysis of the calibration data show that simulated values are well within the magnitude of variation in the observed experimental data. Phenological development (days after emergence (DAE)) for panicle initiation, flowering and maturity (RMSD = 0.2–2.0 days) and grain yield for short and medium varieties (RMSD = 0.2–0.5 t ha−1) are presented in Table 7 (Calibration set). The capability to capture the effects of environmental constraints such as lodging that occurred in the medium and long duration treatments during grain fill is not available in the model at this time.
Statistical comparison of simulation results for crop variables of short (S), medium (M) and long (L) rice varieties for the entire growing season from the CARDI trial dataset (calibration set) and the on-farm trial data (validation set).
N: number of data pairs; X meas: mean of measured values; σ: standard deviation; Y sim: mean of simulated values; α: slope of linear relation between simulated and measured values; β: intercept of linear relation between simulated and measured values; RMSD: root mean square deviation; DAE: days after emergence; PI: panicle initiation.
*Data from all maturity classes (S, M, L) and phenological stages (PI, flowering, maturity) are combined in determining statistical results.
Model validation
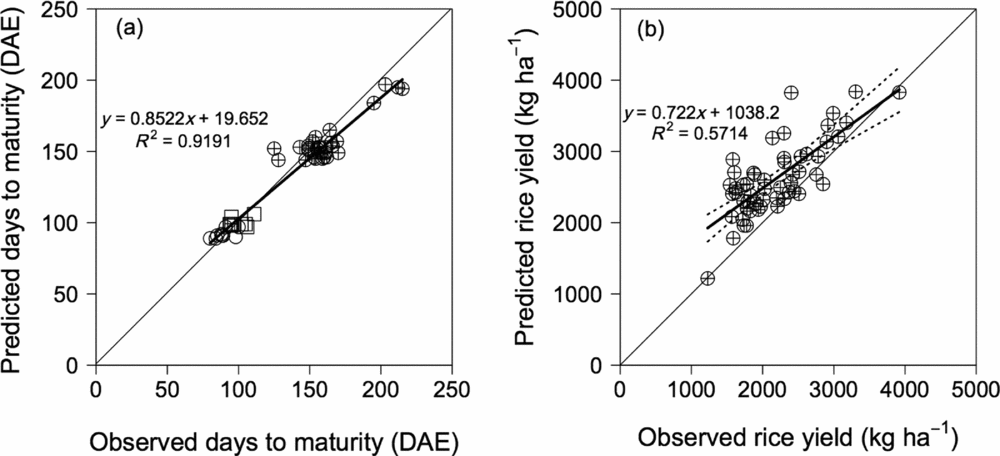
Simulated DAE to physiological maturity correlated well (r 2 = 0.92, RMSD = 0.0013) with observed harvest date (Table 7) for the drum seeding, transplant and FP treatments (Figure 6a). Observed and predicted yields (r 2 = 0.57) for early and medium varieties are presented in Figure 6b. The broken lines represent 95% confidence intervals (CI) around the (solid) line of best fit. For the higher yield range, the model captured the on-farm crop, fertiliser and irrigation management successfully, while the lower range yields tended to be significantly higher than the observed yields. Table 7 (Validation set) reports statistical values for phenological development of short and medium varieties (RMSD = 5–10 days) and short variety grain yield (RMSD = 0.36 t ha−1), all within the magnitude of variation in field observation. Variability in rice yields of actual farmer practice for drum seeding, transplant and local practice is compared with the corresponding simulated yield for each treatment (Figure 7). Bars represent 25 and 75 percentiles with whiskers at 10 and 90 percentiles. The low nitrogen input FP yields (1.84 t ha−1) reflect use of local medium or long duration varieties and are notably below the minimum CARDI yield expectation of 3.5 t ha−1 and 2.5 t ha−1 respectively. The crop management purportedly undertaken by the farmers for drum seeding, transplant and farmer practice did result in simulating the full yield range (1.0–4.0 t ha−1) measured on-farm in 2011 (Figure 6b) and captured relative differences between treatments (DS, CT, FP) when compared with actual farmer practice (Figure 7). The observed yield gap between simulated and farmer practice for both DS and CT treatments may reflect inefficiencies associated with farmer-applied fertiliser and irrigation management in ponded systems and inexperience with direct seeding when compared with traditional transplanting. Local practice of transplanting and low nitrogen input is captured in the model. The 0.49 t ha−1 difference between simulated and actual FP treatments is more likely the result of inherent spatial variability between farm fields associated with fertiliser application, water level in the paddy, nitrogen uptake by the crop or local pest and disease damage not captured in the model.
(a) Observed and predicted days to maturity (DAE). Symbols represent differences in crop establishment, drum seeded ○ and transplant □ applying CARDI-recommended fertiliser rates and tradition transplant ⊕ applying local farmer N rates of fertiliser. (b) Observed and predicted rice yield (kg ha−1) for 54 farm fields sown to short, medium and long duration varieties on 32 farms. Broken lines represent 95% confidence intervals around the mean.
Comparison of simulated and on-farm-measured rice yields for improved varieties established using drum and transplant with local transplanted practice for 54 farmer fields on 32 farms near Svay Rieng in 2011. Treatments compare newer CARDI rice varieties and recommended N rates with the current low N input system and locally planted variety. Bars represent 25 and 75 percentiles with whiskers at 10 and 90 percentiles.
DISCUSSION
Simulation models have in the past struggled for relevance in real-world agriculture and specifically at the farm management level (Carberry et al., Reference Carberry, Gladwin, Twomlow, Delve and Probert2004; Whitbread et al., Reference Whitbread, Robertson, Carberry and Dimes2010), but once calibrated and validated on-farm, local credibility of the model can be established. These models may then be used as an analysis tool to identify and evaluate production constraints and to stimulate discussion around options for improving farmer practice in closing the gap between potential rice yield and those obtained from current on-farm practice. Model accuracy is of prime concern to scientists (Carberry et al., Reference Carberry, Hochman, Hunt, Dalgliesh, McCown, Whish, Robertson, Foale, Poulton and Van Rees2009) but the utility of a cropping systems model lies in its ability to address issues of interest to farmers, particularly risk related to water, fertilizer and agronomic management at the field scale. The focus of this study is the process for calibrating varietal coefficients in APSIM-Oryza and evaluating model performance for a ‘real-world’ situation at the farm level.
A calibration process of repeated iterations, as proposed by Timsina and Humphreys (Reference Timsina and Humphreys2006), was used successfully to optimise varietal coefficients that best correlate simulated with observed values. Model coefficients defining partitioning of resources to shoot, leaf, stem and storage organ components were modified to capture genotypic differences between phenology groups of differing maturation. Derived model coefficients discriminate on observed phenological differences, enabling the model to accurately simulate biomass accumulation at all phenological stages and all maturity classes. The risk associated with an iterative approach for model calibration is that input deficiencies may prevent robust derivation of genetic coefficients (Timsina and Humphreys, Reference Timsina and Humphreys2006), resulting in models often unintentionally ‘tuned’ through a lack of detailed observations in parameterization (Penning de Vries, Reference Penning de Vries1977). The 2011, CARDI experiment was established during the optimum planting window of June to July and managed in a non-limiting water and nutrient environment. Significant re-shooting of the rice stubble observed in the early maturing treatments as a result of nitrification of residual soil NH4 post-harvest supports the premise of adequate nitrogen availability during crop development.
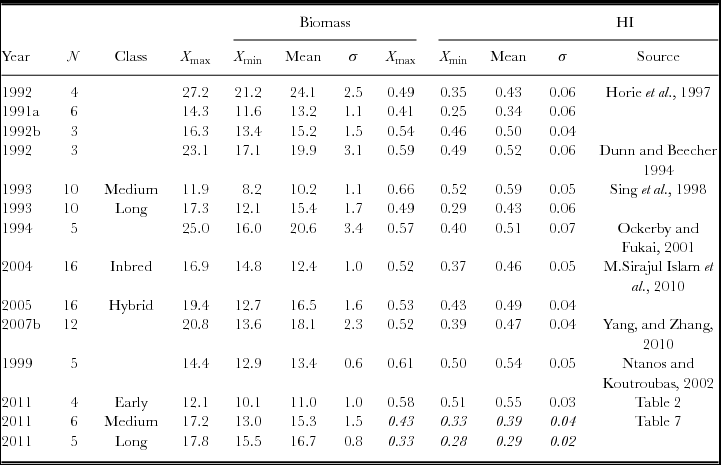
Grain yield is a key input used for cropping system or economic analysis, and therefore confidence in the accuracy of the input data used for model calibration is critical if simulation results are to be trusted. Harvest index, the ratio of grain yield to total biomass as described by Donald and Hamblin (Reference Donald and Hamblin1976), is widely acknowledged as an important feature of crop assessment (Hay, Reference Hay1995; Sinclair, Reference Sinclair1998), with a strong allometric relationship of up to 10 t ha−1 for rice (Yoshida, Reference Yoshida1972). Optimum management and favourable seasonal conditions early in crop development aided ‘experimental’ potential biomass at anthesis and grain yield at maturity, and is the basis for derived coefficients describing grain filling in the model for early and medium maturing varieties. To test the assumption that close to potential yields for the early varieties were achieved, 100 observations of harvest index (Table 8) are compared for modern high yielding varieties (0.45–0.60), medium to late maturing (0.24–0.45), local inbred lines (0.37) and high yielding hybrid lines (0.53) (Figure 8). The CARDI early varieties achieved a harvest index of 0.55, within the top 33% HI range reported for modern high yielding varieties (Hay, Reference Hay1995; Yoshida, Reference Yoshida1972) and support the premise that simulated yields are within experimental yield potential for those varieties. Results suggest that recently released early maturing varieties such as IR66, with appropriate water and nitrogen management have potential to significantly increase on-farm yields compared with older traditional varieties. However, little recent data exist outside of CARDI and localised reporting from Non-Government Organisations (NGOs) and farmer groups on achievable yields for newer varieties in Cambodia. Simulated rice yields from a calibrated APSIM-Oryza are within the CARDI published yield range for each maturity class and the potential target of on-farm yields in the future. This analysis does not consider traditional localised varieties grown primarily for household consumption. Localised varieties generally grow taller, producing greater overall biomass and consistently lower harvest index (<0.32) compared with newer higher yielding varieties of shorter maturation and would require detailed evaluation if they are to be available for use within APSIM-Oryza. Conversely, government export targets for milled rice and farmers wanting improved food security will continue to drive uptake of higher yielding hybrid and modern rice varieties over older traditional lines in the future.
Summary of published data for HI in rice. Number of crops (N), maximum (X max), minimum (X min), mean, and standard deviation (σ) for total biomass and HI are reported. HI values (in italics) are calculated from simulated yield and observed biomass at physiological maturity from the CARDI experimental data 2011.
Relationship of biomass (t ha−1) and grain yield (t ha−1) for 105 reported rice crops recorded at different locations between 1991 and 2011. Early, medium and long maturation classes measured during the 2011 CARI experiment are represented by coloured symbols. The slope of each line represents the upper limit for HI values of 0.60, 0.45 and 0.24.
Validation and evaluation of models such as APSIM-Oryza against ‘real world’ on-farm data is valuable in assessing the utility of models to capture tradeoffs in optimising irrigation, applied fertiliser and agronomic management. Farmers’ decisions are based on seasonal conditions influencing timing and development of their crop. Confidence in a model to accurately capture this timing when evaluating management options for mitigating production risk is essential. Therefore, to be applicable, models must represent actual field crops and be capable of addressing issues of interest to those farmers (Carberry et al., Reference Carberry, Hochman and McCown2002). Model validation requires datasets that test a model's performance against verified inputs to determine whether the model can accurately predict growth, yield and processes (Boote et al., Reference Boote, Jones and Pickering1996). However, models need calibration and evaluation for the conditions to be simulated and must include local validation to achieve accurate estimates from the model (Van Ittersum et al., Reference Van Ittersum, Cassman, Grassini, Wolf, Tittonell and Hochman2013). APSIM-Oryza was successfully validated using an independent on-farm dataset of locally managed varieties relevant for smallholder farmers in lowland rice ecosystems. Simulated days to maturity matched the observed crop duration for each maturity class in all 54 farmer fields with simulated yields accounting for a full range of observed on-farm yields. Models simulate best agronomic practice, which is usually achievable by a small percentage of top farmers. APSIM-Oryza was benchmarked for low nitrogen farmer practice, covering the yield range achieved by the top 25% of evaluated farmers and demonstrating capacity to simulate potential production of current farmer practice. For a lower range of observed farmer yields, differences between simulated and those observed are due to a lack of detailed input data used in initialising soil nitrogen and soil water at the start of simulation.
Early establishment of direct seeded rice was first introduced to a majority of farmers in Svay Rieng in 2011. Although comparable rice yields can be expected from both DS and CT systems, direct seeding continues to gain increasing interest from local farmers due to a significant reduction in labour costs associated with traditional transplant. For these farmers, early established direct seeded rice and improved fertiliser management in 2011 increased mean on-farm yields by >1.0 t ha−1 above traditional farmer practice. However, direct seeding requires additional investment in managing weed and pest levels compared with traditional CT systems. The observed gap between simulated and on-farm yields for each of the DS, CT and FP treatments is in the order of <0.53 t ha−1 and reflects inefficiencies associated with farmer-applied fertiliser and management of ponded systems and inexperience with direct seeding when compared with traditional transplanting. Simulation results have clearly demonstrated that scope exists within current farmer practice to improve efficiencies in crop establishment, irrigation and nitrogen fertiliser management. Availability of high yielding short duration varieties provide opportunities for earlier crop establishment using direct seeding, a second crop in some seasons, the potential to increase overall rough rice production and deliver improved food security for farm households in Cambodian lowland rice ecosystems.
Applying models to evaluate climatic or agronomic constraints challenging Cambodian farmers requires confidence in these tools to capture long-term cropping potential. Combining a participatory approach to farmer engagement for identifying production constraints at the farm scale and model application for evaluating management options for a range of climatic conditions will contribute to our understanding of the mechanisms underpinning these constraints. Varietal coefficients derived from the CARDI experiment contribute to existing rice varieties currently available in APSIM-Oryza for use within the Southeast Asia and South Asia regions by adding 15 rice varieties previously unspecified for modelling purposes and recognised as important for future rice production within Cambodia and potentially the broader region. Simulation models, calibrated and tested in the environment in which they are to be employed should be considered an assessable tool for evaluation of cropping system performance and particularly in yield gap analysis. Modelling tools, such as APSIM-Oryza, will help target future research priorities for the region in minimising de-nitrification and maximising nitrogen recovery in rice crops, irrigation practice and the risk associated with poor pest and disease management.
CONCLUSIONS
Derived varietal coefficients in APSIM-Oryza accurately simulate phenological development for a range of maturity classes within a representative wet season planting window and captures crop duration, biomass accumulation and grain yield of measured experimental field data. Simulated rice yields correlate well with all published CARDI varietal estimates with measured yields of the shorter duration varieties achieving or exceeding previous yield estimates. Use of farmer-managed on-farm trial data for model validation and evaluation is an expedient method in the absence of more rigorous trial data in developing confidence for models to simulate local rice systems. Simulated results highlight inefficiencies with current farmer practice when compared with potential crop production, even under traditional low nitrogen inputs and raises research questions around on-farm nitrogen recovery, fertiliser efficiencies and general crop management in ponded systems. Simulated on-farm yields demonstrate the opportunity for direct seeding, shorter duration varieties and improved agronomy to support farmers in increasing overall farm production and help close the existing yield gap. Future application of a system model aids evaluation of water, nitrogen and residue management dynamics on long-term crop sequencing.
The CARDI experimental data and model coefficients derived from these data contribute to current and future crop simulation models challenged with evaluating rice-based farming systems in Southeast Asia. Specification of APSIM-Oryza for key Cambodian rice varieties delivers a useful tool for addressing uncertainty around current crop management in the area of yield gap analysis and in future evaluation of adoption strategies with smallholder farmers in adapting to potential climate change.