Introduction
In recent decades, nanomaterials have been extensively studied by many scientific and engineering communities. The unique optical, electronic, and mechanical properties of these materials are very attractive for a variety of potential applications[Reference Ariyarathna, Rajakaruna and Nedra Karunaratne1–Reference Kim and Hyeon5]; thus, efficient pathways for the production and modification of nanomaterials are of great interest. Synthesis of nanomaterials, referred to below as nanosynthesis, facilitated by plasma sources has become a standard technique for nanomaterial production.[Reference Lo Porto, Palumbo, Palazzoa and Favia6–Reference Koga, Dong, Iwashita, Czarnetzki and Shiratani8] Some nanomaterials can only be synthesized with plasma, and for some nanomaterials, plasma synthesis is favored due to industrial scale yield, better selectivity, and improved material characteristics.[Reference Kortshagen, Mohan Sankaran, Pereira, Girshick, Wu and Aydil9] The plasma arc is a widely used source for producing nanoparticles,[Reference Rai, Park, Zhou and Zachariah10, Reference Park, Lee, Rai, Mukherjee and Zachariah11] and carbon arc is utilized for making a variety of carbon nanomaterials including fullerenes, carbon nanotubes, nanohorns, nanofibers, and graphene.[Reference Arora and Sharma12–Reference Ng and Raitses21] In the arc, single-walled nanotubes, nanoparticles, and nanohorns are synthesized, while in flight in the gas phase, as opposed to surface growth in chemical vapor deposition. Gas phase synthesis also occurs in laser ablation experiments[Reference Gökce, Amendola and Barcikowski22, Reference Hu, Melton and Mukherjee23]; however, arc synthesis is a less expensive method and also has a significantly higher yield. Unfortunately, the growth mechanism of nanostructures in plasma and gas phases is still poorly understood on both the microscopic and atomistic levels due to the inability to monitor key steps in the synthesis processes, including nucleation and growth. Most previous understanding in this area comes from post-growth, ex situ evaluation of the nanostructures, nanoparticles, and the attached impurities using various laser and x-ray spectroscopic techniques and high-resolution electron microscopy,[Reference Dresselhaus, Dresselhaus, Saito and Jorio24–Reference Ferrari and Robertson26] together with a trial and error experimental process: varying the catalyst,[Reference Saito, Okuda and Koyama27] feedstock,[Reference Williams, Tachibana, Allen, Grigorian, Cheng, Fang, Sumanasekera, Loper, Williams and Eklund28] background gas composition,[Reference Farhat, Lamy de La Chapelle, Loiseau, Scott, Lefrant, Journet and Bernier29, Reference Grebenyukov, Obraztsova, Pozharov, Arutyunyan, Romeikov and Kozyrev30] and other parameters.[Reference Das, Shahnavaz, Eaqub Ali, Moinul Islam and Bee Abd Hamid31]
In situ diagnostics of the plasma-synthesis processes are needed to detect and characterize the structures as they are formed. In situ diagnostics based on pulsed lasers have recently been developed, including laser-induced incandescence (LII)[Reference Yatom, Bak, Khrabryi and Raitses32] or scattering of photons from particles trapped in a laser interference pattern (coherent Raleigh–Brillouin scattering[Reference Gerakis, Yeh, Shneider, Mitrani, Stratton and Raitses33]), to measure the sizes of particles in a high-pressure carbon arc environment. Combined with the traditionally established methods for the diagnostics of plasmas and its constituent species,[Reference Vekselman, Feurer, Huang, Stratton and Raitses34, Reference Vekselman, Khrabry, Kaganovich, Stratton, Selinsky and Raitses35] we are able to establish an improved picture of how and where the nanostructures are assembled and what atomic and molecular species are important for the synthesis process.
The LII diagnostic is promising for nanoparticle characterization, as it relies on relatively common equipment and is easy to implement.[Reference Michelsen, Schulz, Smallwood and Will36] LII has been employed for a few decades in the combustion and in aerosol community for the measurements of soot in flames or in a polluted atmosphere. LII was also utilized with some success in low- to mid-pressure plasmas, expanding the approach to consider scattering particles that are larger than the nano-sized soot in flames and engines.[Reference Stoffels, Stoffels, Kroesen and de Hoog37–Reference Menser, Daun, Dreier and Schulz40] We have previously demonstrated adaptation of the LII model to a high-pressure plasma environment[Reference Shneider41, Reference Mitrani, Shneider, Stratton and Raitses42] and how to deduce particle sizes from the temporal evolution of the LII pattern.[Reference Michelsen, Schulz, Smallwood and Will36] Particle size measurement with LII is generally referred as time-resolved (TiRe) LII. This approach relies on recording the temporal evolution of the particle incandescence after heating by laser pulse. In this work, we present the results of integrated imaging of the incandescence, which allows us to detect large concentrations of nanoparticles in the region outside the arc. This approach is referred to as planar LII (PLII). The experimental findings are validated with the results of fluid dynamics simulations, which show the formation of nanoparticles by condensation of carbon molecular species in these regions.
Experimental setup
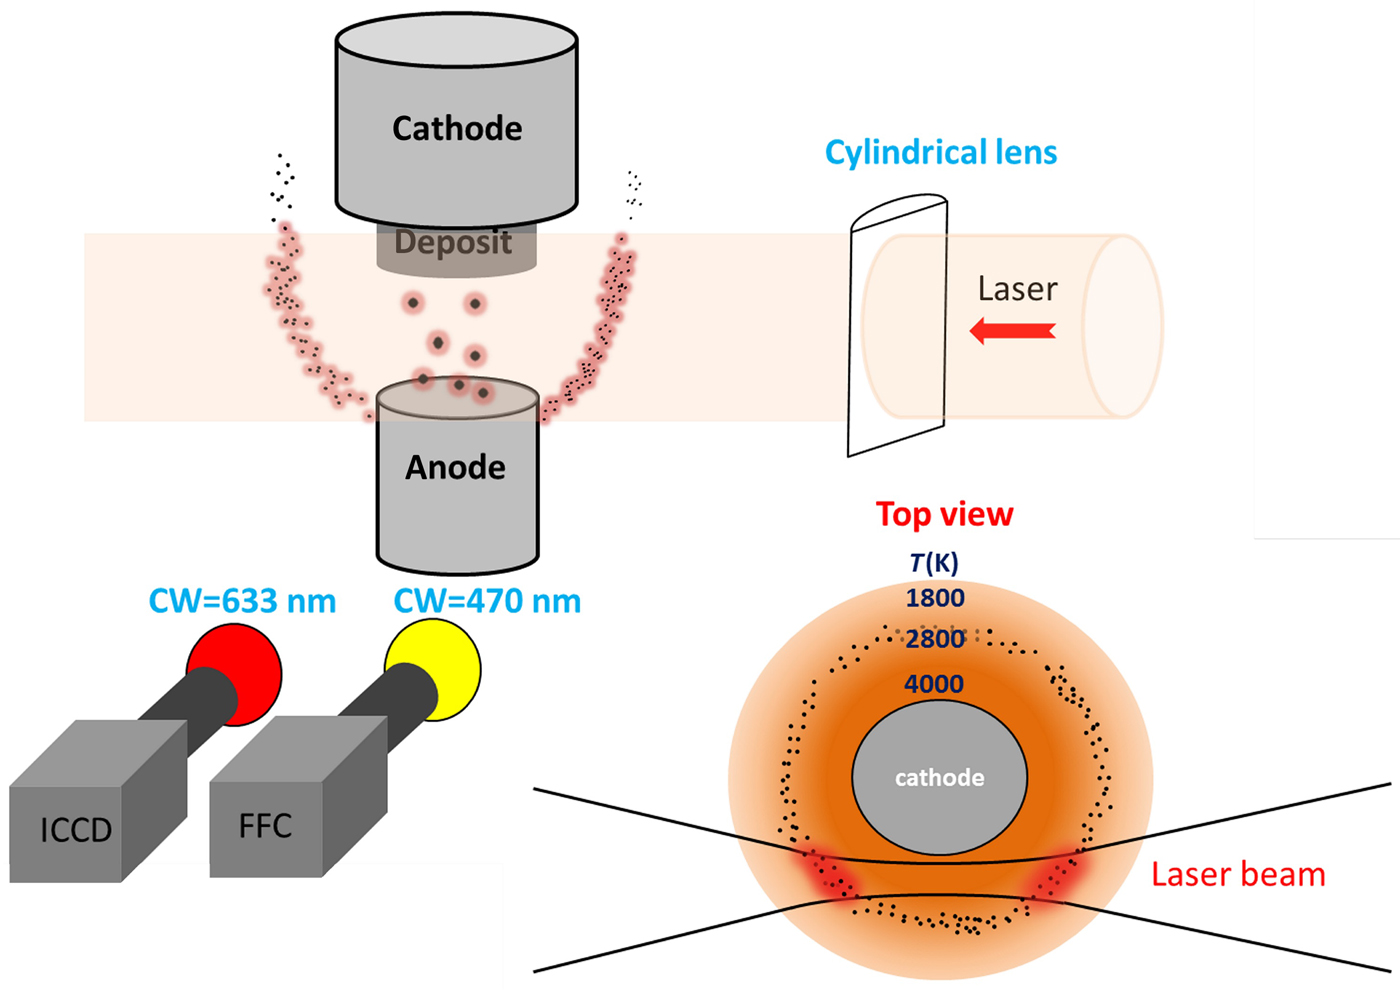
The carbon arc setup used in this work has been previously described in detail in Ref. [Reference Yatom, Bak, Khrabryi and Raitses32]. Two graphite electrodes are oriented vertically, with the cathode on the top and the anode at the bottom. The diameters of the electrodes are ~1.1 and 0.6 cm for the cathode and the anode, respectively. The experimental chamber is evacuated with a mechanical pump and subsequently filled with He gas to a pressure of about 500 Torr. The discharge was maintained with a constant current of 60 A. To ignite the discharge, the anode is biased at 100 V and gradually brought in contact with the cathode via a stepper motor. Once the electrodes are electrically shorted, the stepper motor gradually lowers the anode position, adjusting the inter-electrode gap in order to maintain a set voltage in the range of 25–30 V. The LII setup utilizes a Nd:YAG laser (Quantel) that produces a 1064 nm laser beam with full width at half maximum (FWHM) duration of 8 ns and a maximum energy of 100 mJ per pulse at a frequency of 0.5 Hz. The laser beam is shaped with a cylindrical lens to produce a laser sheath with a vertical length of ~0.35 cm and a width of ~0.05 cm. The beam path is 3 mm from the axis of the anode relative to the direction of the chamber view port so that the light from the particles is not obscured by the electrodes (see Fig. 1). The incandescence is recorded with an iCCD camera (Andor iStar), equipped with an interference filter (central wavelength = 633 nm, FWHM = 10 nm). The central wavelength is selected in order to avoid the molecular and atomic emission lines of carbon and helium. The camera operation is synchronized with the laser pulse by means of a digital delay generator (BNC 575) and the camera exposure is set to 200 ns to capture the peak of the incandescence signal, which occurs after rapid heating by the laser. The 200 ns exposure time is short enough that the background radiation from the plasma and the electrodes does not saturate the sensor. A fast-framing camera (Phantom v7.3 by Vision Research) was used to monitor the behavior of the arc.[Reference Gershman and Raitses43] An interference filter with a central wavelength of 470 nm was used to measure the Swan band C2 emission. The fast-framing camera was triggered to acquire 50 frames during a 1 ms period, for each laser shot and the corresponding ICCD exposure (PLII image). The frame exposure time was 1 µs and the delay between frames was 20 µs. The first 40 frames were acquired before the laser pulse and ten frames were acquired after it. The ICCD camera recorded the LII image, and the fast-framing camera monitored the arc behavior before and after the laser shot. Both cameras observed the discharge from the same view port; however, the images were obtained at slightly different angles, and therefore exhibited minor deviations despite being captured simultaneously.
Experimental arrangement for PLII detection, spectral imaging, and the laser beam intersection with the region of interest.

Arc model
The measurements presented in the paper are complemented by the results of two-dimensional (2D)-axisymmetric steady-state simulations of the carbon arc discharge in a helium atmosphere. The simulations were performed using computational fluid dynamics code ANSYS CFX, which was extensively customized for this purpose. The arc model consisted of a gas phase model coupled to the models of heat transfer and electric current in the electrodes.[Reference Khrabry, Kaganovich, Khodak and Nemchinsky44] The gas flow and carbon transport were modeled in the entire chamber, including the arc volume and the chamber volume. Free convection in the chamber due to gas heating by the electrodes and forced convection in the arc volume due to evaporation of the anode material were modeled. Non-uniform ablation of the graphite from the anode surface and carbon deposition at the cathode was self-consistently determined from the energy balance at the surfaces of the electrodes. Multiple surface physics phenomena, such as space-charge sheaths, recombination of plasma ions, the electron work function, and radiation, were taken into account in the surface energy balance for accurate prediction of the ablation and deposition areas and rates, as discussed in Ref. [Reference Khrabry, Kaganovich, Nemchinsky and Khodak45]. A non-equilibrium plasma model[Reference Khrabry, Kaganovich, Nemchinsky and Khodak45] was utilized: separate equations for temperatures of electrons and heavy particles were solved and diffusion of electrons and ions were accounted for, allowing better prediction of the electric field strength, heating, and temperature profiles in the arc volume. Transport coefficients in the plasma were taken from.[Reference Almeida, Benilov and Naidis46] The plasma model was benchmarked in Ref. [Reference Khrabry, Kaganovich, Nemchinsky and Khodak45] by comparison to the results of previous numerical studies[Reference Almeida, Benilov and Naidis46] and in Ref. [Reference Khrabry, Kaganovich, Nemchinsky and Khodak47] by comparison to analytical solutions. Convective-diffusive transport of atomic carbon in the helium atmosphere was solved yielding a profile of the atomic carbon density in the arc volume and surrounding region. The local chemical composition of the carbon–helium mixture was assumed to be in equilibrium and was obtained using a Gibbs free energy minimization approach similar to one utilized in Refs. [Reference Wang, Rong, Murphy, Wu, Spencer, Yan and Fang48, Reference Vekselman, Khrabry, Kaganovich, Stratton, Selinsky and Raitses35]. The partial pressure of the carbon gas was limited by the temperature-dependent saturation pressure of carbon vapor taken from Ref. [Reference Pierson49]. In other words, condensation equilibrium was assumed: once the temperature decreases below the saturation point, condensation of the carbon gas equalizes the gas partial pressure to the saturation value. The results for plasma composition were validated by comparison of the C2 density profile with the results of spectroscopic measurements using the laser-induced fluorescence technique[Reference Vekselman, Khrabry, Kaganovich, Stratton, Selinsky and Raitses35]; good agreement was obtained.
Experimental results
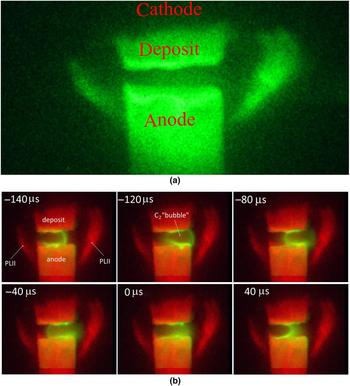
Figure 2(a) shows an example of a PLII image. The most noticeable feature of the nanoparticle incandescence pattern is the partial, non-symmetrical crescents appearing on both sides of the electrode gap. Between the electrodes, the signal is due to incandescence of large graphite chunks ablated from the anode or radiation from the arc. This picture illustrates that two very distinct populations of particles exist in different regions, similar to the results reported in Ref. [Reference Yatom, Bak, Khrabryi and Raitses32]. Figure 2(b) shows the same PLII image superimposed on a series of the spectrally filtered fast-framing camera images. The fast-framing image presents a typical distribution of C2 molecules around the arc core, resulting in a bubble-like structure. This “C2 bubble” has been described in detail in Refs. [Reference Vekselman, Feurer, Huang, Stratton and Raitses34,Reference Vekselman, Khrabry, Kaganovich, Stratton, Selinsky and Raitses35]; it shows a larger carbon dimer density on the edges and a corresponding deficiency in the plasma channel. In Fig. 2(b), the images depict the motion of this bubble-like structure from the left side of the anode to the right side and back, occurring in roughly 200 µs. The frame series is captured before, during, and after the onset of the laser pulse and the resulting PLII image. The time marks on the frames are the times of the C2 image capture and are relative to the laser pulse onset (and the subsequent PLII image acquisition) at t = 0 µs.
(a) A typical PLII image during the carbon arc discharge at the 500 Torr pressure helium gas. The incandescence from the regions of particles coagulation is identified on the right and the left side of the inter-electrode gap, assuming crescent-like formations. The hot part of the anode and the hot deposit on the cathode are seen as well. (b) PLII versus C2. This collage illustrates the oscillation of the C2 bubble-like structure, prior to and after the acquisition of the PLII image. The PLII from ICCD camera image (red) and fast-framing camera image (yellow) are fused together. The times on the images in the collage are the times of fast-framing image (i.e., C2 image acquisition), relative to the laser shot time at t = 0 µs, while the PLII image is the same on all frames and is obtained at t = 0 µs.

Modeling results and comparison with experiments
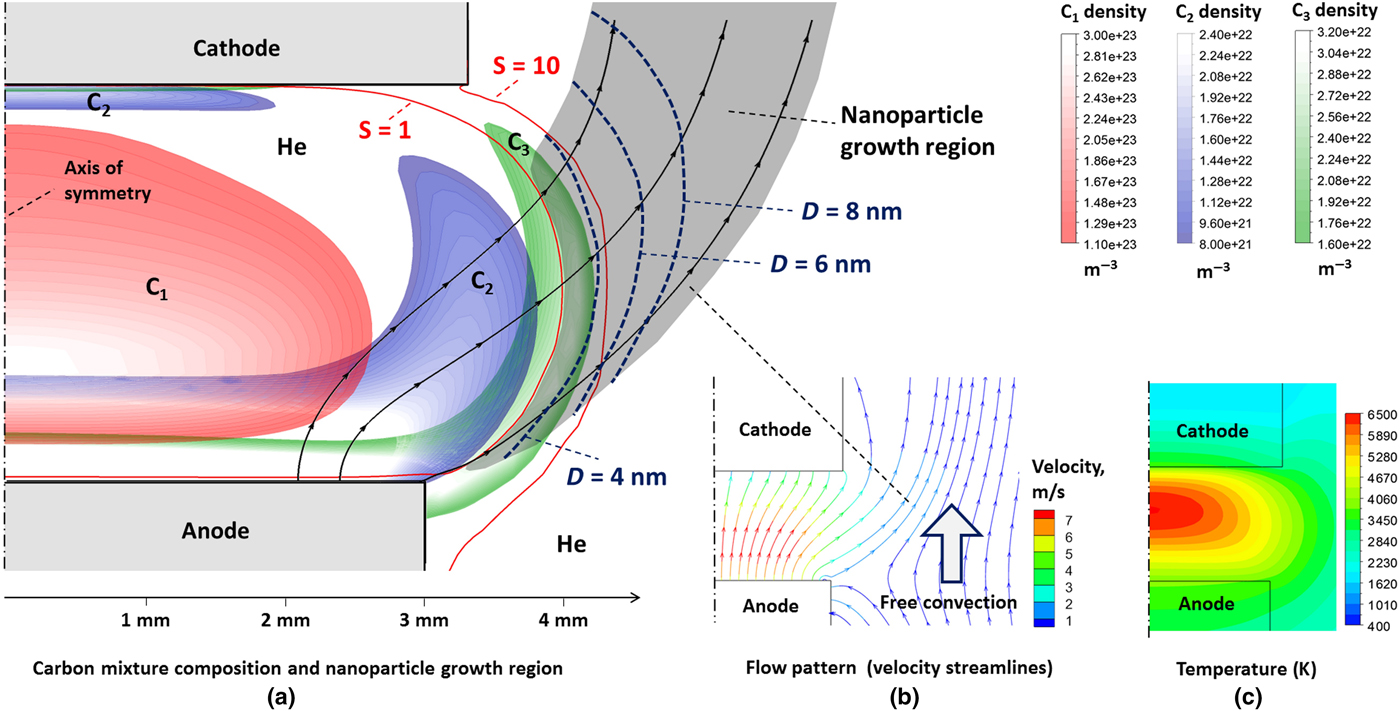
The modeled arc was similar to the one used in the experiments: a 6 mm diameter cylindrical anode, a 7 mm diameter cathode corresponding to the width of the carbonaceous deposit grown on the actual cathode, a 2–3 mm inter-electrode gap, and 60 A arc current. Results of the simulations are shown in Fig. 3. Density profiles of atomic and molecular carbon species are shown in Fig. 3(a) with different colors for different species. The color plots are cut-off for density values below certain levels to avoid overlapping of the plots and to emphasize the onion-like structure of the regions occupied by different species. In the arc center, where the gas temperature is at its highest and reaches 6500 K [see Fig. 3(c)], the carbon gas is almost completely dissociated and is present primarily in atomic form. Near the electrodes and at the arc periphery, about 3 mm from the axis of symmetry, the gas temperature decreases to about 4500 K, as shown in Fig. 3(c). The density of the diatomic carbon molecules is at its highest in this bubble-shaped region. The presence of the C2 bubble is confirmed by the present experiments and by the experiments of Ref. [Reference Vekselman, Khrabry, Kaganovich, Stratton, Selinsky and Raitses35]. Further away from the arc axis, at a distance of about 4 mm, the gas temperature is about 3500 K. In this region, the carbon gas is mostly in the form of C3 molecules.
Results of the carbon arc simulations. (a) Density profiles of various carbon species and nanoparticles growth region along selected flow streamlines; (b) flow pattern; (c) gas temperature profile. Red lines represent locations where carbon vapor supersaturation degree S equals unity and ten. At S = 1, carbon vapor condensation and nanoparticle formation starts. By S = 10 most of the vapor is condensed. Blue dashed lines show locations by which the average diameter of the nanoparticles reaches 4, 6, and 8 nm due to their agglomeration.

The source of the carbon species in the arc is ablation of the anode material. The flow pattern in the arc [Fig. 3(b)] indicates that most of the material ablated from the anode surface goes directly to the cathode front surface where it is deposited. This picture is in accordance with the experimental observations of the deposit growth at the cathode and with the measurements of the ablation and deposition rates performed in Refs. [Reference Vekselman, Feurer, Huang, Stratton and Raitses34,Reference Fetterman, Raitses and Keidar50].
However, some flow lines originating from the anode front surface, closer to its side walls, deviate from the cathode, leave the inter-electrode gap, and merge with the relatively slow upward directed convective flow of helium along the side walls of the electrodes [Fig. 3(b)]. These outgoing streamlines are also plotted in Fig. 3(a) over the density profiles. This flow carries a small fraction of the ablated material away from the arc volume where it merges with the convective flow of helium and cools down. Eventually the gas pressure decreases below the saturation point, and the carbon vapor condenses to form nanoparticles. As a result, the carbon gas density rapidly decreases along the streamlines, following the decrease of the saturation pressure that is a strong function of temperature (one order of magnitude decrease with a temperature decrease of 200 K).[Reference Pierson49] We define the carbon gas supersaturation degree S = p C/p satur, where p C is the partial pressure of carbon in the carbon–helium mixture and p satur is the saturation pressure of carbon vapor.
Condensation starts when S becomes larger than unity. Note that condensation is commonly considered to be a multi-stage process; see[Reference Smirnov51, Reference Davari and Mukherjee52] for example. Formation of condensed particles from the vapor is not energetically favored for small particles with sizes below some critical value. Hence, nucleation of the first particles of the condensed phase (nucleation stage) is a quasi-equilibrium process of competition between association and dissociation. The clusters that surpass the critical size grow in size and agglomerate in collisions with each other.
When S is only slightly higher than unity, the energy barrier for growth is large and the nucleation is slow compared with the limit when S ≫ 1. The energy barrier drastically decreases with an increase of S (decrease of temperature), and at some point, the growth and agglomeration of smaller cluster proceed unimpeded, see for example Ref. [Reference Davari and Mukherjee52]. Correspondingly, the vapor pressure and S rapidly reduce and S does not significantly deviate from unity since then. In the later stage of particle growth, the nucleated particles grow due to agglomeration (agglomeration stage).
Nucleation theory is well developed for condensation from the gaseous phase to the liquid phase using the approximation of spherical clusters.[Reference Smirnov51, Reference Davari and Mukherjee52] Carbon does not have a liquid phase at atmospheric pressure and typical temperatures of the arc plasma (<1 eV). However, we can use estimates for boron––a carbon neighbor in the periodic table, which show that the nucleation will occur at S about 3 or less; the nucleation stage duration is of an order of microseconds, and the critical size clusters formed are small, consisting of several tens of atoms. As will be evident below, the nucleation time and cluster size scales are much smaller than those for the agglomeration stage. Thus, we omit the nucleation stage in our nanoparticle growth model and consider that the agglomeration stage starting immediately.
We can estimate the amount of the condensed material by calculating the values of S while condensation is artificially prevented from occurring. In Fig. 3(a), the red lines show the locations of (i) S = 1 (condensation starts) and (ii) S = 10 (90% of the material is condensed). According to our simulations, the formation of nanoparticles starts in the region where C3 molecules are the dominant carbon species [Fig. 3(a)]. Growth of the nanoparticles can be described using a simple model of agglomeration of carbon clusters, similar to one used in Ref. [Reference Kappler, Ehrburger, Lahaye and Donnet53], in which C3 molecules were also considered to be a main precursor for growth of the nanoparticles. The nanoparticles are transported with the flow during growth. The region of nanoparticle growth is shown by the shaded area in Fig. 3(a). Assuming that at a temperature below the saturation point all collisions of carbon molecules and clusters lead to their agglomeration (upper estimate for the density of nanoparticles), the size distribution of the agglomerated particles should not broaden, and a simple relation for variation of the particle density along their trajectory as they are carried by the steady-state flow can be written as:
 $$\displaystyle{{dn} \over {dt}} = v\displaystyle{{dn} \over {ds}} = - D^2n^2\sqrt {\displaystyle{{4\pi kT} \over m}}. $$
Here n is the density of carbon particles, including molecules and multi-atomic nanoparticles, v is the flow velocity, s is the distance traveled by the agglomerating particles from the location where the agglomeration started (S = 1), D = 2r 0(n 0/n)1/3 is the average particle diameter,  $m = m_{{\rm C}_3}(n_0/n)$ is the average particle mass, T is the gas temperature, r 0 ≈ 1.2 × 10⁻¹⁰ m is the distance between atoms in a cluster (bond length), n 0 is the initial density of the particles (i.e., density of C3 molecules at the location S = 1), and
 $m_{{\rm C}_3}$ is the mass of a C3 molecule. According to the simulations, n 0 is about 3 × 1016 cm−3, as shown in Fig. 3(a). The temperature along the nanoparticle growth region changes from 3500 K at the beginning to about 2000 K at the end (see Fig. 3) and it appears under the radical in Eq. (1). Hence, the constant gas temperature approximation can be used and an analytical solution of Eq. (1) can be derived:
 $$n = \left( {n_0^{ - 5/6} + \displaystyle{5 \over 6}A\Delta t} \right) \approx (A\Delta t)^{ - 6/5}.$$
Here
 $$ A = (2r_0)^2\; n_0^{1/6} \sqrt {\displaystyle{{4\pi kT} \over {m_{{\rm C}_3}}}}. $$
This yields for average diameter of the nanoparticles:
 $$D = 2r_0n_0^{1/3} (A\Delta t)^{2/5}.$$
Spatial profiles of the nanoparticle density and average size in the growth region can be obtained by numerical integration of Eq. (1) along the flow streamlines. These profiles can be found in Fig. S1. Note that in the numerical integration, constant temperature was not assumed and the actual temperature profile along the streamline was utilized. Diffusion has a small effect on nanoparticle motion compared with convection and does not significantly influence the particle density, particle diameter, and shape of the growth region. However, a small fraction of the particles can spread out from the sides of the growth region. The ratio of convection and diffusion time scales is:
 $$\displaystyle{{t_{{\rm conv}}} \over {t_{{\rm diff}}}} = \displaystyle{{LD_{\rm p}} \over {v\; W^2}} \approx 0.003.$$
Here L ≈ 1 cm is the characteristic length of the nanoparticle growth region, W ≈ 3 mm is its width [see Fig. 3(a)], and D p is the particle diffusion coefficient defined as[Reference Khrabry, Kaganovich, Nemchinsky and Khodak45]:
 $$D_{\rm p} \approx \displaystyle{{{(kT)}^{1.5}} \over {6\sqrt {m_{{\rm He}}} \; \; p\; D^2}} \approx 3 \times 10^{ - 6}\; {\rm m}^2/{\rm s},$$
where p = 2/3 atm is the background pressure, and m He is the mass of a helium atom.
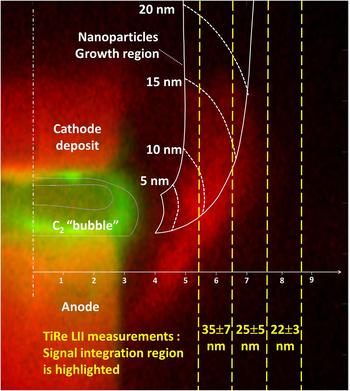
The spatial profile of the nanoparticle average size in the growth region is shown in Fig. 3(a) by dashed dark blue lines. It is evident from Fig. 3(a) that the nanoparticles grow very fast in the beginning when they are small and their density and thermal velocities are high (assuming T = const): it takes a small fraction of a millimeter for the nanoparticles to gain an average diameter of 3 nm, which corresponds to about 10,000 atoms per particle. Few small molecules are left in the mixture by this location. This is consistent with the previous statement of fast condensation of the carbon vapor. After traveling 1 mm of path, the nanoparticles grow relatively slowly, gaining 3 nm in diameter in about 1 mm of path and reaching an average diameter of 20 nm by 7 mm from the start of nucleation. Their density significantly decreases to about 5 × 1010 cm−3 after traveling 1 cm, but it is sufficient for the application of the LII technique. Note that according to Eq. (3), the nanoparticle average diameter is weakly dependent on the number density n 0 of carbon molecules and on the gas temperature. In Fig. 4, results of the simulations (white lines) are compared with an experimental photograph of the C2 molecule emission and the nanoparticle incandescence. Regions occupied by C2 molecules and by growing nanoparticles are shown by solid lines. The spatial distribution of the nanoparticle average diameter is shown by dashed lines. Note that in Ref. [Reference Vekselman, Khrabry, Kaganovich, Stratton, Selinsky and Raitses35], the arc operating at lower currents was stable and symmetric, allowing direct comparison between the measurements and results of 2D-axisymmetric simulations for C2 density profile. In the present experiments, the arc channel moves along the electrode surface at high frequency, accompanied by the motion of the bubble-shaped region occupied by C2 molecules, as shown in Fig. 2(b). This motion cannot be captured explicitly in the 2D-axisymmetric steady-state simulations. In Fig. 4, the C2 bubble is at its most extreme position to the right and therefore has the strongest effect on the nanoparticle growth region. In Fig. 4, the results of the simulations are shifted about 1 mm to the right to fit the experimental position of the C2 bubble. The location of the nanoparticle formation region also came into good agreement with the experimental measurements with this shift.
The C2 bubble and the nanoparticle growth region; results of the simulations are shown by white lines overlaid on the experimental photograph. Locations where nanoparticles have specific average sizes are shown by white dashed lines. Yellow dashed lines indicate the locations of the signal line integration in measurements of the nanoparticle average diameter[Reference Williams, Tachibana, Allen, Grigorian, Cheng, Fang, Sumanasekera, Loper, Williams and Eklund28] performed using the TiRe LII technique. Areas from which a TiRe LII signal was collected are highlighted and the mean particle diameter for each area is shown.

The simulated average diameter of the growing nanoparticles can be compared with the experimental measurements[Reference Yatom, Bak, Khrabryi and Raitses32] performed using TiRe LII technique. In the measurements, the signal was integrated along vertical line segments, which are shown in the figure by yellow dashed lines. Results of the measurements are indicated in yellow. Good agreement of the particle sizes is observed: ~20 nm in the experiments versus about 15 nm in the simulations. The TiRe LII measurements show the presence of 25 nm particles at a distance of 8 mm and further from the axis of symmetry, where neither simulations nor the PLII photograph shows the presence of the nanoparticles. This disagreement can be explained by the fact that the TiRe LII results are time averaged over the arc run. The oscillating behavior of the arc and dependence of the flow pattern on the inter-electrode gap size (which significantly changes during the arc run) can bring carbon further away from the electrodes. These effects are out of the scope of this paper and will be considered in follow-up publications. Figure 4 shows that the region of nanoparticle growth by coagulation roughly coincides with the area where PLII detects a large concentration of nanoparticles. The calculated and the measured distributions of C2 also correspond well. The simulation accurately shows the regions that allow coagulation of nanoparticles due to the existence of carbon feedstock and sufficiently low temperatures. In the simulation, all the particles are flushed upwards with the gas flow. The experiment shows that the majority of the particles exhibit this behavior, as indicated by the well-defined “horns”; however, some diffusion in the radial direction occurs as well. This is expressed by the dampened incandescence beyond the “crescent” structure [best seen in Fig. 2(a)] and also by the fact that the TiRe LII signal was measured as far as 13 mm away from the arc axis.[Reference Yatom, Bak, Khrabryi and Raitses32]
The comparison between the nanoparticle sizes predicted by simple coagulation model and the ones measured in Ref. [Reference Yatom, Bak, Khrabryi and Raitses32] by the means of TiRe LII can be summarized as follows. The TiRe LII signals were collected from segments 30 mm high in the axial direction and 1.25 mm wide in the radial direction. Thus, the TiRe LII measurement has excellent spatial resolution in the radial direction, but not in the axial direction. In addition, the mean sizes of the nanoparticles represent a broad distribution obtained for each radial segment. Finally, the TiRe LII results are also time-averaged over 150–200 signals measured during each arc run. Taking these effects into account, the best correspondence between the coagulation model and the TiRe LII results is at 7 mm distance. At 6 mm, the experimentally measured mean size is somewhat larger, which can be explained by the observation that the mean diameter in the TiRe LII measurements is larger than in the simulation due to the occasional presence of large graphite chunks in the r = 6 mm region. At larger radial distances, the occurrence of these large chunks is less frequent, resulting in a slight decrease of the mean nanoparticle size with distance. In the regions adjacent to the arc (r < 6 mm), these chunks occur frequently; hence, the sizes measured there are much larger, completely overshadowing the contribution from the 5–10 nm particles predicted in the calculation.
Conclusions
This work shows that the PLII method has successfully imaged the spatial distribution of nanoparticles synthesized in the near-arc region, while the mechanism of nanoparticle formation and growth was revealed in modeling performed in connection with 2D simulations of the arc. The majority of the observations from both the spectral imaging and the PLII were verified and reproduced in the model.
The model shows that the formation of nanoparticles takes place in a narrow spatial region outside the arc, at a distance of ~5 mm from the hot arc core. The C2 and C3 molecules serve as the building blocks for the nanoparticles. The agglomeration process happens faster than the variation of gas mixture composition, thus preventing the formation of larger carbon molecules. Almost all of the carbon gas is condensed close to the region where nucleation begins, forming small nanoparticles with diameters of ~3 nm. The subsequent nanoparticle agglomeration is slower, resulting in nanoparticles with diameters of ~20 nm at ~1 cm along the flow. Thermal convection of the ambient helium gas, heated by contact with electrodes, plays a crucial role in determining the shape of the nanoparticle growth region, while the role of particle diffusion is small. These results will contribute to the development of accurate models for the growth of nanoparticles and nanotubes in plasma environments.
Good agreement between the experimental data and the simulations of the shapes of the regions occupied by the nanoparticles and C2 molecules as well as average size of the nanoparticles was obtained. These conclusions were obtained despite the unstable behavior of the carbon arc due to rapid oscillations and the fact that feedstock production via ablation is coupled with the plasma. For this reason, the PLII technique is an important development in the experimental approaches to the in situ exploration of nanoparticle formation. The digital data in this paper are available online at: https://dataspace.princeton.edu/jspui/handle/88435/dsp01920g025r
Supplementary material
The supplementary material for this article can be found at https://doi.org/10.1557/mrc.2018.91
Acknowledgments
The authors would like to thank Dr. Michael Schneider and Dr. Ken Hara for fruitful discussions and to A. Merzhevskiy for technical assistance. LII measurements and the thermodynamic simulations were supported by the US Department of Energy (DOE), Office of Science, Basic Energy Sciences, Materials Sciences and Engineering Division. The arc modeling was supported by the US DOE Office of Science, Fusion Energy Sciences.