Implications
The inclusion of dietary glutamine, glutamic acid and nucleotides in the diets of piglets accelerated the carbon turnover during the post-weaning period.
Introduction
Breeding and nutritional programs, management practices as well as improvements to sanitation and farm facilities have increased the productivity and production quality in commercial swine cultures. In this context, attempting to accelerate production, commercial farms have gradually reduced the time to weaning of piglets. However, early weaning causes stress characterized by a decrease in feed intake followed by changes to the intestinal mucosa, and, ultimately by a decline in growth rates (Berkeveld et al., Reference Berkeveld, Langendijk, Soede, Kemp, Taverne, Verheijden, Kuijken and Koets2009). Changes to the intestinal mucosa include a reduction in villus height (VH) and an increase in crypt depth (CD) during the 1st day after weaning (Andrade et al., Reference Andrade, Almeida, Costa, Berenchtein, Mourão and Miyada2011; Tucci et al., Reference Tucci, Thomaz, Nakaghi, Hannas, Scandolera and Budiño2011). A fast recovery of the intestine represents an essential step for the proper growth of weaned piglets.
Previous studies have assessed a potential role for dietary glutamine, glutamic acid and nucleotides as performance enhancer additives for weaned pigs. Glutamine, among other functions, acts as metabolic fuel for the fast-turnover cells (Rhoads and Wu, Reference Rhoads and Wu2009), and glutamic acid replaces glutamine in several of its roles including those of energy generation and amino acid synthesis (Yi and Allee, Reference Yi and Allee2006). Nucleotides, besides forming the molecular basis of nucleic acids, integrate many coenzymes and act as donors of sugars and phosphoryl groups (Sauer et al., Reference Sauer, Mosenthin and Bauer2011). All of these feed additives improved piglet growth performance (Kitt et al., Reference Kitt, Miller, Lewis and Fischer2002; Yi et al., Reference Yi, Carroll, Allee, Gaines, Kendall, Usry, Toride and Izuru2005; Abreu et al., Reference Abreu, Donzele, Saraiva, Oliveira, Fortes and Graña2010; Cabrera et al., Reference Cabrera, Usry, Arrellano, Nogueira, Kutschenko, Moeser and Odle2013; Rezaei et al., Reference Rezaei, Knabe, Tekwe, Dahanayaka, Ficken, Fielder, Eide, Lovering and Wu2013). However, whether these compounds accelerate the recovery of the gut mucosa remains controversial. Previous morphometric studies of the small intestine have reported improvements (Yi et al., Reference Yi, Carroll, Allee, Gaines, Kendall, Usry, Toride and Izuru2005; Cabrera et al., Reference Cabrera, Usry, Arrellano, Nogueira, Kutschenko, Moeser and Odle2013; Rezaei et al., Reference Rezaei, Knabe, Tekwe, Dahanayaka, Ficken, Fielder, Eide, Lovering and Wu2013), whereas others have observed no effects (Kitt et al., Reference Kitt, Miller, Lewis and Fischer2002; Lee et al., Reference Lee, Liu, Chen, Wang, Lin and Weng2007; Abreu et al., Reference Abreu, Donzele, Saraiva, Oliveira, Fortes and Graña2010; Shan et al., Reference Shan, Shan, Li and Zhou2012).
The current controversy on the effects of additives on the small intestine mucosa may arise from technical limitations. The intestine morphometric data that results from histological analysis requires very subjective and error-prone measurements of VH and CD. Currently, isotope dilution techniques provide accurate estimates of the replacement time of an element in different animal tissues. The intake of diets and subsequent metabolism of a proportion of δ 13C that is different from that seen in the animal tissue results in the isotopic dilution of tissue carbon, and ultimately leads to a new steady-state ratio of carbon isotopes (Ducatti et al., Reference Ducatti, Carrijo, Pezzato and Mancera2002). The curve defined by isotopic incorporation v. time can be accurately established (Ducatti et al., Reference Ducatti, Carrijo, Pezzato and Mancera2002). In face of the uncertainties built into intestinal morphometric analyses and the availability of the isotope dilution technique that measures tissue regeneration, this study aimed at evaluating the influence of dietary glutamine, glutamic acid and nucleotides on duodenal and jejunal carbon turnover, and on mucosa morphometry of piglets weaned at an age of 21 days.
Material and methods
The research project was conducted at UNESP (São Paulo State University) at the Faculty of Veterinary Medicine and Animal Science, Botucatu campus, with the approval by the Animal Ethics Committee from this institution (protocol number 32/2011 – Animal Ethics Committee from UNESP (CEUA)) and, in accordance with the directive 2010/63/EU.
The weanling piglets, females and castrated males of crossbred commercial lineage were housed in a nursery facility with a ceiling height of 3.5 m, side curtains and suspended metal pens of 1.0×1.75 m that were equipped with one feeder, one nipple-type drinker and one heater. The pens had a partially slatted plastic flooring and a compact concrete floor under the heater. The internal temperature of the nursery facility was controlled by the adjustment of the side curtains and the management of the heaters.
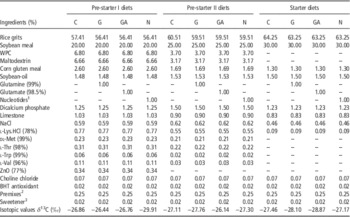
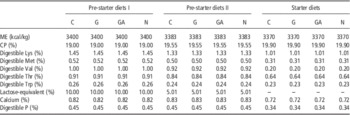
The piglets were fed ad libitum within a feeding program to attend its nutritional requirements, in accordance with Rostagno et al. (Reference Rostagno, Albino, Donzele, Gomes, Oliveira, Lopes, Ferreira, Barreto and Euclides2011) in the following phases: pre-starter I (21 to 35 days), pre-starter II (36 to 49 days) and starter (50 to 70 days) diets. The evaluated treatments were additive-free diet – control (C); diet containing 1% glutamine (G); diet containing 1% glutamate (GA) and diet containing 1% nucleotides (N) showed in Tables 1 and 2.
Percentage composition and isotopic values of the pre-starter I, pre-starter II and starter diets

BHT=butylated hydroxy toluene antioxidant; C=control diet; G=glutamine diet; GA=glutamic acid diet; N=nucleotides diet; WPC=whey protein concentrate.
1 Composed by 97% of 5'-disodium inosinate and 5'-disodium guanylate.
2 Mineral and vitamin premixes (supplied per kg of diet): Fe: 40 mg, Cu: 35 mg, Mn: 20 mg, Zn: 40 mg, Co: 0.36 mg, I: 0.84 mg, Se: 0.12 mg; vitamin A: 25 000 IU, vitamin D3: 5000 IU, Biotin: 5 mg, Niacin: 10 mg, Calcium pantothenate: 30 mg, vitamin B12: 70 µg, vitamin B2: 18 mg, vitamin E: 75 mg, vitamin K3: 1 mg.
3 Composed by sodium saccharin, neohesperidin and silicon dioxide.
Calculated nutritional composition of the pre-starter I, pre-starter II and starter dietsFootnote 1

C=control diet; G=glutamine diet; GA=glutamic acid diet; N=nucleotides diet; ME=metabolizable energy.
1 Nutritional values of ingredients proposed by Rostagno et al. (Reference Rostagno, Albino, Donzele, Gomes, Oliveira, Lopes, Ferreira, Barreto and Euclides2011).
Intestinal mucosa morphometry
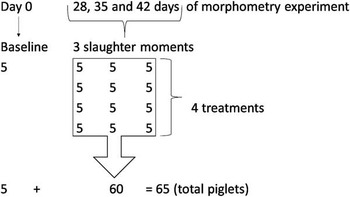
In total, 65 piglets weaned at an average age of 21 days (average weight of 6.32±0.18 kg) were allocated into a randomized block design, based on its weight (one piglet penned individually), with factorial arrangement of treatments: 4×3+1 (four diets, according to Table 1, three slaughter ages: 7, 14 and 21 days post-weaning and slaughter at baseline (experimental day 0), which corresponded to slaughter of piglets with average ages of 21, 28, 35 and 42 days). At baseline (day 0), five piglets were slaughtered after electronarcosis and at days 7, 14 and 21 days post-weaning another five piglets fed each experimental diets were slaughtered, composing a total of 20 piglets per slaughter (Figure 1).
Fluxogram that represents the morphometry experiment design.

After slaughter, samples of ±1.5 cm of the proximal portions of the duodenum and jejunum were collected, which were opened by the mesenteric border, fixed on styrofoam and immersed into a 10% buffered formaldehyde solution for 24 hours. Then, the samples were washed by 70% ethyl alcohol to remove the fixative and, subsequently were dehydrated in increasing concentrations (70 to 100%), diaphanizeded in xylene and embedded in paraffin. The structure of the digestive system were evaluated by two slides mounted for each collected sample. The microtomy was performed in the thickness of 5 μm, and made from 6 to 8 semi-serial sections from each animal segment. Also, between a cut and the subsequent one used, about 12 cuts were discarded. The staining of the sections was performed by Harris’ hematoxylin–eosin technique, according to Behmer et al. (Reference Behmer, Tolosa and Neto1976). The readings of the histological slides were performed under a light microscope coupled to a system for image capturing and image analyzing system (Leica Application Suite Interactive Measurement version 3.5) to determine the VH and CD, being held 30 readings of VH and CD in each sample. After this procedure, the VH : CD ratio value was determined. Duodenum and jejunum segments have been elected for sampling, because they are the most representative of small intestine in relation to processes of digestion and absorption.
In order to evaluate the villi density (VD), samples were collected ±1.5 cm of the proximal portions of the duodenum and jejunum, washed in phosphate buffer (0.1 M, pH 7.4) and fixed in glutaraldehyde, dehydrated in an increasing ethanol concentration solution, dried in a CO2 critical point dry air oven, over copper supports of 1.0 cm diameter, using metal tape and then, observed and electron micrographed in a scanning electron microscope. The electron micrographs of five areas of each sample were recorded to estimate the villus density (number of villi/mm2). The data of the VH, CD, VH : CD ratio and VD in the duodenum and jejunum were subjected to analysis of variance using the GLM procedure of SAS® v. 9.2 (SAS Institute, Cary, NC, USA) and the averages compared by Tukey’s test (5%).
Carbon turnover
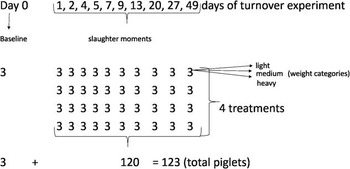
A total of 123 weaned piglets at an average age of 21 days and 6.27±0.13 kg of average weight were allocated individually into a randomized block design, considering three categories of animal weight (light, medium and heavy with an average initial weight of 5.91, 6.40 and 6.57 kg, respectively) distributed in four experimental diets (Tables 1 and 2) and one piglet per experimental unit (Figure 2). The main energy source of these diets was rice grits, a raw ingredient coming from the C3 photosynthetic plant cycle, which showed a 13C isotopic signal distinct from the diets provided for sows (−16.14‰) as gestation and lactation diets primarily had contained corn as an energy source (a C4 photosynthetic plant). The isotopic values (δ 13C) of the pre-starter I, pre-starter II and starter diets were presented in Table 1.
Fluxogram that represents the turnover experiment design.

At days 1, 2, 4, 5, 7, 9, 13, 20, 27 and 49 after weaning, three piglets per treatment (light, medium and heavy) were slaughtered after electronarcosis. At the baseline (day 0), three piglets (a light, medium and heavy) were also killed, in order to express the isotopic composition of the tissues, which was a function of the diets fed sows in the gestation and lactation phases. The sampling procedures were concentrated on the 1st day of the experimental period due to the higher speed of 13C isotopic dilution in tissues (Tieszen et al., Reference Tieszen, Boutton, Tesdahl and Slade1983; Hobson and Clark, Reference Hobson and Clark1992).
After slaughter, the segments from ~20 cm length of the proximal portions of the duodenum and jejunum were removed, which were washed with de-ionized water, then opened by the mesenteric border, washed again and its mucosal content were collected by scraping with a glass slide. The mucosa samples were placed into Eppendorf tubes (Eppendorf AG, Hamburg, Germany) of 1.50 ml, identified and immediately frozen (−18°C). In order to perform the isotopic analyses, the intestinal mucosa samples were defrosted and dried by lyophilization for 24 hours. After drying, the samples were weighed (50 to 70 μg) into tin capsules and analyzed to determine its isotopic composition by mass spectrometry (spectrometer Delta Finnigan Mat-S coupled to the Elemental Analyzer 1108 CHN-Fisions Instruments, Thermo Fisher Scientific Inc., Waltham, USA) at the Environmental Stable Isotopes Center of UNESP Biosciences Institute, Botucatu Campus. The data expressed the δ 13C notation in relation to the Pee Dee Belemnite (PDB) International Standard with analysis deviation at the order of 0.2‰ and calculated by the following equation:
 $$\delta ^{{13}} {\rm C}_{{({{{\rm sample,}\,{\rm standard}}} )}} {\equals}\left[ {(R_{{{\rm sample}}} \,/\,R_{{{\rm standard}}} ){\minus}1} \right]{\times}10^{3} $$
where δ 13C is the enrichment of the isotopic ratio 13C/12C of the sample to the standard; R represents the ratio of the heavier (13C) to the lighter (12C) stable isotopes (dimensionless).
To evaluate the speed of the carbon substitution of the samples, the following exponential function of time was employed (Ducatti et al., Reference Ducatti, Carrijo, Pezzato and Mancera2002):
 $$\delta ^{{13}} {\rm C}_{{\left( t \right)}} {\,\equals\,}\delta ^{{13}} {\rm C}_{{(f)}} {\plus}[\delta ^{{13}} {\rm C}_{{(i)}} {\,\minus\,}\delta ^{{13}} {\rm C}_{{(f)}} ]\,e^{{{\minus}kt}} $$
where δ 13C(t) is the isotopic enrichment of tissue at any time (t); δ 13C(f) the isotopic enrichment of tissue at the equilibrium or final condition; δ 13C(i) the isotopic enrichment of tissue, at the beginning; k the constant of turnover rate, in units of time−1; t the time (days) since the diet substitution.
The half-life of carbon (T50%) in the mucosa, at t=T and the total time (T99%) necessary for the initial atoms substitution by the final atoms was determined by the equation:
 $$t{\,\equals\,}\left( {{\minus}1\,/\,k} \right)\,{\rm ln}\,\left( {1{\minus}F} \right)$$
where t is the time of the initial atoms substitution to the final substitution (days); ln the Naperian logarithm (natural); F the value of the atom substitution, which can vary between 0.0 and 0.99; k the constant of turnover rate (per day), defined as rate of carbon isotopes ratio incorporation (Ducatti et al., Reference Ducatti, Carrijo, Pezzato and Mancera2002).
The calibration of the mass spectrometer was performed with CO2 6.0 (99.999%) from a cylinder, which was previously calibrated with IVA-33802174. The SD for measurements was 0.2‰. The 13C/12C standard isotope ratio was expressed as δ‰ (delta per mil), value relative to the primary standard (PDB). At the beginning of each run, two pulses of CO2 reference gas were admitted into the inlet system for about 20 s. The constant flow rate during this period has given peaks a flat-top appearance. A level of CO2 corresponding to 5 V at m/z 44 was used to calibrate the system.
Also, a internal working standard (coal) was used with an analytical uncertainty of measurement of −28±0.2‰ for carbon isotopes. This working standard was calibrated v. the official reference material IVA-33802174, provided by Analysentechnik e. K. (Meerbusch, Germany) with a certified value of δ 13CV-PDB=−39.73±0.16‰. The samples were analyzed in duplicate, and standards were analyzed in four repetitions and the values averaged. The precision of method was set at 12‰ that refers to the amplitude of isotopic signals between C3 and C4 plants. The certainty of method was set as 0.2‰ of standard deviation.
In total, 11 piglets per treatment were used at following slaughter days: 0, 1, 2, 4, 5, 7, 9, 13, 20, 27 and 49 after weaning to determine the first-order exponential equation by the software Minitab 16 and, to express the carbon incorporation rate for each animal weight category (light, medium and heavy) and also, to determine the half-life values (T50%) and 99% substitution rate (T99%) of the 13C stable isotopes. Data were analyzed by the variance test and, means had been compared by Tukey’s test (5%) using the GLM procedure of SAS® v.9.2 (SAS Institute).
Results
Morphometry of the intestinal mucosa
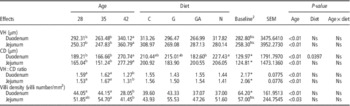
There was no difference (P>0.05) on duodenal and jejunal VH of 21-day-old piglets in comparison with each of the other age groups (Table 3). In the duodenum and jejunum VH values of 28-, 35- and 42-day-old piglets comparison, a greater value was observed at day 42 (P<0.01) and, no differences (P>0.01) were found between piglets at days 28 and 35. Animal age affected small intestine CD values (Table 3). The duodenal and jejunal CD values of 21-day-old piglets were lower (P<0.01) than other age groups. The duodenum and jejunum CD values were higher (P<0.01) at 42 days of age in comparison with 28 and 35 days of age, but both were similar (P>0.05) between piglets at the ages of 28 and 35 days.
Intestinal morphometric results of weaned piglets fed control (C), glutamine (G), glutamic acid (GA) or nucleotides (N) diets at 21-, 28-, 35- and 42-day-oldFootnote 1

VH=villus height; CD=crypt depth; Ns=non-significant.
a,bMean values in the same row with different superscript letters were significantly different by Tukey’s test (P<0.05).
1 Values are means of n=5 piglets.
2 Baseline refers to piglets at 21-day-old.
*Significance of t-test (P=0.001), Ns (P>0.05).
Regarding the duodenum and jejunum VH : CD ratios (Table 3), the values observed at weaning (21 days) were higher (P<0.05) compared with those observed in each of the other age groups. A comparison of VH : CD ratios of piglets at the ages of 28, 35 and 42 days showed for the duodenum, a similarity of values (P>0.05) between 28- and 35-day-old animals. However, these values were higher (P<0.01) in comparison with the values found for animals at 42 days of age. In the jejunum, 42-day-old piglets had lower VH : CD ratio (P<0.01) in comparison with 35-day-old animals, but no differences (P>0.05) were observed between animals at ages 28 and 35 days.
The VD (P<0.05) was higher in the duodenum of piglets at weaning (21 days) compared with the ages of 28, 35 or 42 days. However, in the jejunum no differences (P>0.05) were observed between piglets at 21 days of age compared with each of the other age groups (Table 3). In the duodenum and jejunum, there were lower values of villi per mm2 at the age of 42 days (P<0.01), but there were no differences between the ages of 28 and 35 days. There was no effect of diet (P<0.05) on the duodenum and jejunum VH, VH : CD ratios and VD and on the jejunum CD. In the duodenum, the CD value was higher (P<0.01) in piglets fed diets containing nucleotides in comparison with animals fed diets containing glutamic acid (Table 3).
Carbon turnover
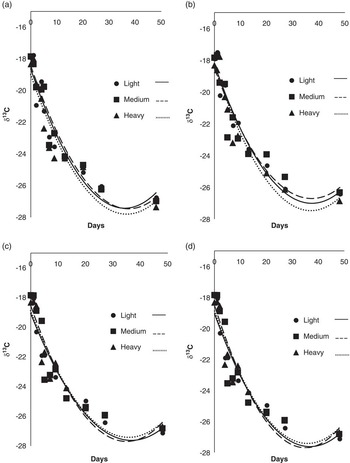
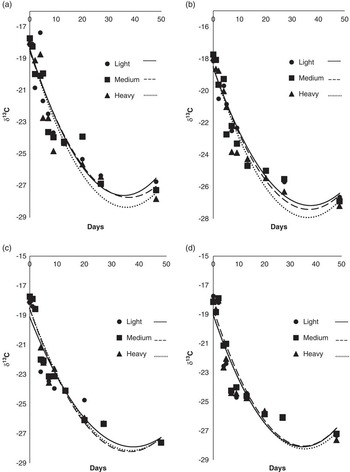
The δ 13C values in duodenal and jejunal mucosas of piglets at the weaning day (−18.02‰ and −17.95‰, respectively) was similar to the 13C isotopic signal of gestation and lactation diets fed sows (−16.14‰) which had received corn as an energy source (a C4 photosynthetic plant). Thus, the piglets have reflected isotopically diets from sows, as expected. Moreover, the average carbon isotopic values in the duodenal and jejunal mucosa of 70-day-old piglets were −26.05‰ and −27.31‰, respectively, which were similar to the average value of diets fed piglets after weaning (−27.49‰) that had contained rice as an energy source (a C3 photosynthetic plant). These value changes observed during the experimental period indicated that 49 days were enough for the tissue to reach the δ 13C isotopic equilibrium plateau and to reflect isotopically the new diet (after diet switching) (Figures 3 and 4).
Exponential equations of carbon turnover in duodenum of piglets from 21- to 70-day-old by different weight categories (light, medium, heavy) and diets (a) control diet, (b) diet containing 1% glutamine, (c) diet containing 1% glutamic acid and (d) diet containing 1% nucleotides.

Exponential equations of carbon turnover in jejunum of piglets from 21- to 70-day-old by different weight categories (light, medium, heavy) and diets: (a) control diet, (b) diet containing 1% glutamine, (c) diet containing 1% glutamic acid and (d) diet containing 1% nucleotides.

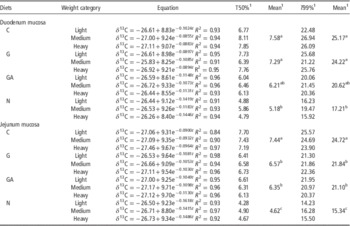
A 13C half-life of 5.18 days and 99% carbon substitution time of 17.21 days indicated that diets containing 1% nucleotides promoted higher carbon incorporation in the duodenal mucosa after weaning when compared with the control (T50%=7.58 and T99%=25.17 days), or with the diet containing 1% glutamine (T50%=7.29 and T99%=24.22 days) (Table 4). The 1% glutamic acid diet yielded intermediate values that did not differ from the nucleotide or from the other two diets (T50%=6.21 and T99%=20.62 days).
Equations of intestinal mucosa isotopic enrichments by time and half-life turnover values (T50%) and turnover of 99% (T99%) of 13C stable isotope from piglets by weight categories and diets

C=control diet; G=glutamine diet; GA=glutamic acid diet; N=nucleotides diet.
a,b,cMean values in the same column followed by different superscript letters were significantly different by Tukey’s test (P<0.05).
1 Values unit (days).
In the jejunal mucosa (Table 4), glutamine, glutamic acid and nucleotide diets yielded lower half-life values of 6.57, 6.35 and 4.62 days, respectively, and 99% substitution values of 21.84, 21.10 and 15.34 days, respectively, compared with the control diet (T50%=7.44 and T99%=24.72 days) (P<0.01). Diets containing glutamine or glutamic acid resulted in similar exchanges of 13C values between them (T50% and T99%), whereas the nucleotide diets determined lower T50% and T99% values (P<0.01).
Discussion
In the present study, we evaluated the effect of different feed additives on the recovery of the intestinal mucosa, measured by the isotope dilution technique. We observed that dietary supplementation with glutamine, glutamic acid and nucleotides promoted a greater 13C incorporation in the intestinal mucosa, decreasing the turnover periods in comparison with the control diet. On the other hand, no effects of dietary treatment on the intestinal mucosa could be detected.
Throughout the lactation phase, piglets have intact and well-oriented villi, in response to a liquid diet with high nutritional value (Cera et al., Reference Cera, Mahan, Cross, Reinhart and Whitmoyer1988; Jiang et al., Reference Jiang, Chang, Stoll, Fan, Arthington, Weaver, Campbell and Burrin2000). Changes to dietary constitution and physical form as well as other stress sources that occur at weaning contribute to a reduction in feed intake and to a number of structural and functional changes to the small intestine (Dong and Pluske, Reference Dong and Pluske2007). For example, previous work has established that the VH reaches its lowest values and the CD its highest values between 5 and 10 days after weaning, after which the mucosa gradually recovers (Berto et al., Reference Berto, Kronka, Santos, Thomaz and Curtarelli1996; Thomaz et al., Reference Thomaz, Hannas, Kronka, Tucci, Scandolera and Budiño2011).
In the present study, we observed an increase in duodenal CD up to 7 days post-weaning, but no changes to jejunal CD or VH. Further increases in both duodenal and jejunal CD were observed in piglets aged 42 days in comparison with animals at the ages of 28 and 35 days (7 and 14 days post-weaning, respectively). This additional increase probably occurred in response to the observed increase in VH at day 42, and not because of continued stress. In fact, a lower VH : CD ratio value was observed in piglets at day 42. Numerous studies have shown that 42-day old piglets are physiologically adapted and the intestinal mucosa presents a greater degree of recovery (Xu et al., Reference Xu, Wang and Zhang2000; Pluske, Reference Pluske2001). Nevertheless, some authors could not detect any changes to intestinal morphometric parameters associated with the age of weaned piglets (Castillo et al., Reference Castillo, Kronka, PizauroJr, Thomaz and Carvalho2004; Araújo et al., Reference Araújo, Junqueira, Lopes, Araújo, Ortolan and Laurentiz2006).
Dietary supplementation with glutamine, glutamic acid and nucleotides did not alter VH, VH : CD ratios, duodenal and jejunal VD, as well as jejunal CD. Similar results have been reported regarding the effects of dietary glutamine on VH (Kitt et al., Reference Kitt, Miller, Lewis and Fischer2002), nucleotides on CD (Lee et al., Reference Lee, Liu, Chen, Wang, Lin and Weng2007), glutamine and nucleotides on VH, CD and VH : CD (Abreu et al., Reference Abreu, Donzele, Saraiva, Oliveira, Fortes and Graña2010). Previous work also found no effect on VD of dietary supplementation with yeast-derived nucleotides, glutamine or polyunsaturated fatty acids (Andrade et al., Reference Andrade, Almeida, Costa, Berenchtein, Mourão and Miyada2011; Tucci et al., Reference Tucci, Thomaz, Nakaghi, Hannas, Scandolera and Budiño2011). However, glutamine and glutamate do provide fuel for intestinal epithelial cells (Reeds and Burrin, Reference Reeds and Burrin2001; Wu, Reference Wu2007). Thus, in fact, other work reported that the addition of 6.51% glutamate in the diet of early-weaned piglets prevented duodenal villi atrophy (Ewtushik et al., Reference Ewtushik, Bertolo and Ball2000).
We could only observe one effect of diet on morphometric indicators. Dietary nucleotides increased duodenal CD in comparison with the glutamic acid diet. We cannot explain this isolated effect, except by re-asserting that the currently adopted technique of morphometric analysis generates innumerous uncertainties due to its subjective nature. The reduced food intake observed on the 1st day after weaning, compromises piglet growth and results in decreased intestinal VH (Berkeveld et al., Reference Berkeveld, Langendijk, Soede, Kemp, Taverne, Verheijden, Kuijken and Koets2009; Tucci et al., Reference Tucci, Thomaz, Nakaghi, Hannas, Scandolera and Budiño2011).
However, dietary glutamine supplementation reduces the apoptosis of intestinal epithelial cells (Chow and Zhang, Reference Chow and Zhang1998) and prevents the villus atrophy in early-weaned piglets (Ewaschuk et al., Reference Ewaschuk, Murdoch, Johnson, Madsen and Field2011; Wu et al., Reference Wu, Meier and Knabe1996). Moreover, glutamine accelerates the turnover of carbon in the small intestine mucosa of piglets (Caldara et al., Reference Caldara, Ducatti, Berto, Denadai, Garcia and Ferreira2010). In the present study, this effect was particularly observed in the jejunum, where the half-life values (T50%) and the 13C total substitution (T99%) were lower for animals fed the glutamine-containing diet in comparison with piglets fed the control diet.
Mucosal cells not only use extracellular glutamine, but also synthesize it and glutamate in the villi and crypt regions (Rhoads and Wu, Reference Rhoads and Wu2009). Glutamate, especially from the diet, can easily replace glutamine in several metabolic pathways, including those involved in energy homeostasis and in the synthesis of other amino acids (Reeds and Burrin, Reference Reeds and Burrin2001). We found no differences on duodenal carbon T50% in piglets fed the control diet in comparison with animals fed diets supplemented with glutamine or glutamic acid. This lack of effect may result from the fact that piglets in the present study have been individually housed under high hygienic standards what could have affected intestinal bacterial colonization differently from those piglets that were exposed to environmental, nutritional or immunological stressors (from commercial facilities), what could have reduced the differences among piglets from treatments (Che et al., Reference Che, Perez, Song and Pettigrew2012; Yi et al., Reference Yi, Carroll, Allee, Gaines, Kendall, Usry, Toride and Izuru2005). Also, the presence of dairy products, and high concentrations of zinc oxide, both of these components with trophic effects in the intestinal mucosa, might have masked the observable differences among treatments (Molino et al., Reference Molino, Donzele, Oliveira, Ferreira, Moraes, Haese, Saraiva and Oliveira2011; Shelton et al., Reference Shelton, Tokach, Nelssen, Goodband, Dritz, DeRouchey and Hill2011).
Glutamate represents the main oxidative fuel for intestinal cells (Burrin and Stoll, Reference Burrin and Stoll2009; Reeds et al., Reference Reeds, Burrin, Jahoor, Wykes, Henry and Frazer1996), it serves as a precursor to other biologically active molecules such as glutathione, proline and arginine, and it takes part in the composition of glycoproteins present in the intestinal mucus (Wu, Reference Wu2007). These roles might explain the lower 13C T50% and T99% in the jejunal mucosa of piglets fed diets with 1% of glutamic acid or glutamine in comparison with animals fed the control diet.
Diets containing nucleotides had 13C T50% and T99% average values of 2 and 6 days, respectively, for the duodenal mucosa, and 2 and 7 days, respectively, for the jejunal mucosa. These values are lower than those observed in piglets fed any of the other diets (Table 4). Dietary nucleotides participate in the salvage pathway that is essential to fast-turnover cells (Sanderson and He, Reference Sanderson and He1994; Uauy et al., Reference Uauy, Quan and Gil1994), and may explain the levels of isotope substitution observed.
Morphometric analyses of piglet intestinal mucosa have provided inconsistent results, with high CV, regarding the trophic effects of feed additives. These inconsistencies may result from differences in the experimental periods and animal ages, from the number of villi and crypts measured, and from the fragility of intestinal epithelia, whose morphology is difficult to preserve during sampling and processing. The stable isotope dilution methodology used here more accurately assesses the trophic action of feed additives on the intestinal mucosa of piglets, and could be applied for the elucidation of several physiological mechanisms.
Conclusion
Dietary supplementation with glutamine, glutamic acid or nucleotides accelerated carbon turnover in piglets during the post-weaning period. To date, morphometric analyses have yielded no consistent results regarding the action of the evaluated additives, and few reproducible age-related effects. The carbon (δ 13C) dillution technique might represent an important alternative methodology that should be further independently investigated.
Acknowledgements
The authors acknowledge the financial support of this work (grant numbers: 2011/17844-1 and 501190/2013-9) provided by The State of São Paulo Research Foundation (FAPESP) and by The National Council for Scientific and Technological Development (CNPq).