In 1856, the General Statistics Commission was created in the Kingdom of Spain. A year later, a population census was carried out and statistics became an academic discipline in the universities.Footnote 1 Notwithstanding the effort, the 1857 population census was rapidly under scrutiny because of its poor quality. As a result, the General Statistics Commission, renamed the Board of Statistics, opted for a recount. The 1860 census marked the beginning of modern demography in Spain.Footnote 2 Interestingly, these early censuses coincided with the process of national economic development, thereby permitting an in-depth study of the spatial distribution of population.
Theoretically, there are two major forces affecting the distribution of population. On the one hand, physical geography such as soil quality, climate, altitude, or distance to the coast, among other factors. These “first nature” advantages were critical in preindustrial societies (Beeson, Dejong, and Troesken Reference Beeson, Dejong and Troesken2001; Bosker and Buringh 2015; Cuberes and González-Val Reference Cuberes and González-Val2017). With industrialisation and structural change, the concentration of firms and people brings about certain benefits or agglomeration economies (Glaeser Reference Combes, Duranton, Gobillon and Glaeser2010). Under these conditions, “first nature” factors become less relevant and agglomeration economies emerge as the dominant force (Gabaix and Ioannides Reference Gabaix, Ioannides, Vernon Henderson and Thisse2004; Duranton Reference Duranton2007; Rossi-Hansberg and Wright Reference Rossi-Hansberg and Wright2007; Michaels, Rauch, and Redding Reference Michaels, Rauch and Redding2012).
It has been widely acknowledged that the size of and/or diversity of the local economy can give rise to agglomeration economies (Marshall Reference Marshall1890; Jacobs Reference Jacobs1969; Henderson Reference Henderson2003). More specifically, the spatial concentration of economic activity increases market access, thus resulting in cheaper and more varied inputs, as well as allowing the sharing of risk and indivisible facilities (i.e., airports, universities, hospitals). Besides, denser locations enable a more efficient matching between firms and workers or buyers and sellers, both in terms of quantity and quality of matches; and facilitate knowledge spillovers within and across industries (Duranton and Puga Reference Duranton, Puga, Vernon Henderson and Thisse2004).Footnote 3 Yet, agglomeration is also associated with expensive housing, long commutes, and pollution, among other costs. There appears then to be a trade-off between increasing returns and congestion costs (Fujita and Thisse Reference Fujita and Thisse2002; Combes, Duranton, and Gobillon Reference Combes, Duranton and Gobillon2012).
From a theoretical perspective, Paul Krugman (Reference Krugman1991) suggests that, through a process of circular causation, the interaction between economies of scale and transport costs might lead to the emergence of an industrialised “core” and agricultural “periphery.”Footnote 4 In such a model initial conditions (i.e., population density) are self-reinforcing, thereby emphasising the role of history on the spatial concentration of industry. In this vein, Diego Puga (Reference Puga1999) stresses the relevance of workers' mobility to income differentials. If the agglomeration of economic activity increases wages and workers are perfectly mobile, they will tend to relocate near industrial clusters. Consequently, structural change should be one of the major driving forces of urbanisation, as Guy Michaels, Ferdinand Rauch, and Stephen Redding (Reference Michaels, Rauch and Redding2012) show. Nevertheless, urban agglomeration continues, even in countries where employment shifted away from agriculture long ago, thereby stimulating the need for further research.Footnote 5
The relationship between economic density and productivity has been at the core of most debates on agglomeration economies. Antonio Ciccone and Robert E. Hall (Reference Ciccone and Hall1996) pioneered this strand of the literature studying productivity differentials within the United States. On the whole, these authors found that variation in output per worker across states partly reflects differences in the density of economic activity. Since then, several studies have attempted to quantify the effect of economic density on productivity. Although results may vary according to the level of aggregation, period of study and/or estimation method, it is somewhat accepted that density increases the productivity of firms and workers.Footnote 6 However, most empirical studies have a static or short-term view, thereby ignoring long-run dynamics.Footnote 7 Data availability has constrained this line of research. In fact, long-run studies have usually replaced employment for population, and have employed population growth as a proxy for economic dynamism (Beeson, Dejong, and Troesken Reference Beeson, Dejong and Troesken2001; Dobkins and Ioannides Reference Dobkins and Ioannides2001; Michaels, Rauch, and Redding Reference Michaels, Rauch and Redding2012; Desmet and Rappaport Reference Desmet and Rappaport2017).
Long-run empirical studies have also focused on one of the most peculiar empirical regularities, the Gibrat's law, which suggests that city growth is independent of its initial size (Clark and Stabler Reference Clark and Stabler1991; Gabaix Reference Gabaix1999; Eeckhout Reference Eeckhout2004). But, what if Gibrat's law is violated, and hence growth and size are positively correlated? Michaels, Rauch, and Redding (Reference Michaels, Rauch and Redding2012) find evidence in support of this hypothesis for the United States, and argue that this is related to structural change and, in particular, to the reallocation of resources away from agriculture. It appears that the link between size, measured as population density, and growth was clearly visible between 1880 and 1960, but not after.Footnote 8 The fact that reallocation was less relevant in the late twentieth century, together with growing congestion costs, especially in the largest locations, may explain this process (Puga Reference Puga1999; Graham Reference Graham2007; Combes, Duranton, and Gobillon Reference Combes, Duranton and Gobillon2012; Michaels, Rauch, and Redding Reference Michaels, Rauch and Redding2012).Footnote 9
The spatial distribution of the Spanish population has also experienced marked changes since the middle of the nineteenth century. These changes have usually been described as a two-fold movement of population from the mountains to the plains and from inland to coastal areas (Collantes and Pinilla Reference Collantes and Pinilla2011). As a result, a large share of the population and economic activity is now concentrated in peripheral regions, except for Madrid and a few scattered cities, mainly provincial capitals. Different studies have examined this spatial distribution of population and the relevance of agglomeration economies. On the one hand, using provinces as unit of analysis, M. Isabel Ayuda, Fernando Collantes, and Vicente Pinilla (Reference Ayuda, Collantes and Pinilla2010) find that location fundamentals or “first nature” explain the spatial distribution of Spanish population before industrialisation (up to 1900). “Second nature” factors, related to the presence of agglomeration economies, began to play an increasing role from then onwards and disparities in population density widened accordingly.Footnote 10
Likewise, Julio Martinez-Galarraga, Elisenda Paluzie, Jordi Pons, et al. (Reference Martinez-Galarraga, Paluzie and Pons2008) find that, since the mid-nineteenth century, doubling employment density increases industrial labour productivity by around 3–5 percent, a relationship that declines over time.Footnote 11 On the other hand, exploring the evolution of the 100 largest cities during the twentieth century, Luis Lanaspa, Fernando Pueyo, and Fernando Sanz (Reference Lanaspa, Pueyo and Sanz2003) find that a convergent pattern of growth dominated between 1900 and 1970 and divergence followed thereafter. While the latter is just concerned with the upper tail of the distribution, Francisco Goerlich and Matilde Mas (Reference Goerlich, Mas and Azagra2006, Reference Goerlich and Mas2008) employ all municipalities to illustrate a tendency towards spatial concentration over the whole twentieth century, especially between 1950 and 1981. More recently, Rafael González-Val, Daniel Tirado, and Elisabet Viladecans-Marsal (Reference Cuberes and González-Val2017) explore the relationship between market potential and city growth during the period 1860–1960, showing that, while urban growth was first the result of location fundamentals, the effect of market potential was significant over the twentieth century. Although these studies suggest the increasing importance of agglomeration economies over time, further analysis is required.
In this article, we analyse how the relationship between agglomeration economies and the spatial distribution of population has evolved over time. Our contribution is twofold. First, we introduce a novel dataset that traces the evolution of the Spanish population at the district level from 1860 to 1991. The data, which comprises 464 districts and is recorded on a decadal basis, allow us to capture the transition from a pre-industrial society to a modern economy. Second, our empirical analysis examines whether initial size affects subsequent growth. If agglomeration economies play a role, orthogonal growth would not hold and large districts would grow more rapidly than small ones, thus violating Gibrat's law and increasing spatial concentration. In order to isolate the effect of initial size from other potential determinants of population growth, we have considered climatic and geographic information to capture the “first nature” advantages of each district. We also control for other issues, such as the “capital effect” and the economic dynamism of neighbouring locations. Potential endogeneity is further addressed by instrumenting the size of the local economy using historical urban population.
Our results show that a relationship between district size and population growth hardly existed during the second half of the nineteenth century. Interrupted by the Spanish Civil War and the autarkic period that followed, the link between these two variables increased significantly between 1910 and 1970. These findings, in line with previous studies, illustrate the relevance of structural change and agglomeration economies in the shaping of a modern economy. The intensity of this relation slightly weakened in the 1970s, a process that continued during the 1980s as rural out-migration slowed down and de-industrialisation hit traditional manufacturing sectors (i.e., metallurgy, extractive). Lastly, we also find that agglomeration economies appear to have a greater impact on medium-size districts, especially from 1960 onwards, thus suggesting that congestion costs might have started to mitigate the benefits arising from economic density in the largest locations. This article thus reinforces, at a lower level of aggregation and using more benchmark periods, existing evidence on the importance of agglomeration economies in explaining the spatial distribution of population in Spain (Ayuda, Collantes, and Pinilla Reference Ayuda, Collantes and Pinilla2010).
HISTORICAL BACKGROUND: SPAIN 1860–1991
From 1860 to 1991, the Spanish economy undertook a profound structural transformation that turned a predominantly agricultural society into a modern economy by the late twentieth century: labour shifted away from agriculture to industry and services, and income per capita increased accordingly (see Table 1 and Figure 1).
LABOUR FORCE BY MAIN ECONOMIC ACTIVITY IN SPAIN (IN MILLIONS), 1860–2000

REAL GDP, POPULATION AND PER CAPITA GDP GROWTH, 1850–2000

Source: Prados de la Escosura (Reference Prados de la Escosura2008, p. 288). Annual average logarithmic rates. Following Prados de la Escosura and Rosés (Reference Prados de la Escosura and Rosés.2009, p. 1070), the time-periods are derived from structural breaks in the long-term evolution of GDP.
The Spanish economy entered the early stages of modern economic growth in mid-nineteenth century. Economic growth was initially fostered by the integration of the national market and the adoption of industrial innovations, mostly in textiles and metallurgy. The integration of Spain's domestic market received a strong impulse in the middle of the nineteenth century.Footnote 12 Before that, as a consequence of the persistence of barriers and limitations to internal trade, the national market was fragmented into various local and regional markets that were largely unconnected. Local tariffs and regulations restricting trade were widespread and weights and measures differed across regions. In addition, transport costs were very high due to low public investment in transport infrastructures, the use of traditional means of transport and the particular geography of Spain, which was rugged and lacked an extensive water transport system. As a result, regional commodity markets were scarcely integrated and prices markedly differed from one region to another. It is true though that some interdependence in commodity prices had existed since the eighteenth century (Ringrose Reference Ringrose1998).
Successive political reforms in the nineteenth century promoted market liberalisation. Laws were unified, legal support was given to property rights, and tariffs and local restrictions on internal trade were eliminated (Tedde Reference Tedde1994). In addition, the expansion of the rail network brought major changes that favoured the progressive development of the domestic market. The first line finished in 1848, covered the 28 kilometres that separated Barcelona and Mataró. By 1866 the railway linked up Spain's main economic centres and by 1901 all the provincial capitals were connected (Wais Reference Wais1987).Footnote 13 The country's infrastructure stock as a share of gross domestic product (GDP) rose from 4.3 percent in 1850 to 27.2 percent in 1900 (Herranz Reference Herranz2007). Transport improvements, particularly the completion of Spain's railways network, favoured the fall in transport costs and the creation of a national market for most important commodities during the second half of the nineteenth century.Footnote 14
In parallel to the integration of the domestic market, manufacturing industries became increasingly concentrated in space (Paluzie, Pons, and Tirado Reference Paluzie, Pons and Tirado2004). While inland regions experienced a substantial process of deindustrialisation (with the exception of Madrid), Spanish industrialisation was mainly led by Catalonia and the Basque Country (Nadal Reference Nadal, Nadal, Carreras and Sudrià1987).Footnote 15 By 1910, the contribution of these regions to Spanish industrial output was 30.3 percent and 6.9 percent, while their population only represented 10.5 percent and 3.4 percent, respectively (Rosés, Martinez-Galarraga, and Tirado Reference Rosés, Martinez-Galarraga and Tirado2010). In addition, internal migratory flows were relatively low throughout most of the nineteenth century (Silvestre Reference Silvestre2005). Due to the predominance of agrarian activities and their subsequent seasonality, an important part of these movements was temporary and occurred over short distances (Silvestre Reference Silvestre2007). Indeed, up to the 1920s permanent internal migrations remained low (see Figure 2).Footnote 16 International migration, on the other hand, experienced a notable increase in the late nineteenth century and the first decades of the twentieth century, mainly heading to Latin America (Sánchez-Alonso Reference Sánchez-Alonso2000).
EMIGRATION, RETURN MIGRANTS AND INTERNAL MIGRATION IN SPAIN BY PERIOD (PER 1,000 PEOPLE)

Up to WWI, economic growth rates progressed at a slow pace, industrialisation advanced with difficulties and unevenly distributed across space, and structural change was limited. By 1910, as Figure 1 illustrates, more than two-thirds of the labour force were still in agriculture. The integration of the Spanish market continued throughout the interwar years, especially with a substantial increase in paved roads, which complemented the previous development of the railway network (Herranz Reference Herranz2005).Footnote 17 In addition, although the notable advance of electrification mitigated previous energy restrictions traditionally faced by Spain's industry and the number of industrial locations expanded, the spatial concentration of manufacturing continued. The increasing market integration was accompanied by large inter-regional migrations: Spaniards left declining regions, which were mainly rural and agrarian, to reallocate in the richest regions, which were more urban and specialised in industry and services.Footnote 18 In parallel to these developments, structural change accelerated and the share of agrarian employment decreased substantially while economic growth rates significantly increased.
The Spanish Civil War (1936–1939) and the first years of Franco's regime negatively not only affected economic growth, but also economic integration. The autarkic policy that followed the Civil War came hand in hand with a tight regulation of commodity and input markets, including state control of prices and quantities in most goods. Although these policies created a false impression of price convergence, internal trade hardly increased. In addition, due to the lack of investment in infrastructure, transport costs remained unaltered during the 1940s and early 1950s. Economic growth and structural change came to a halt: agrarian employment actually increased during the 1940s and it took 20 years to return to the pre-Civil War per capita income levels (Prados de la Escosura, Rosés, and Sanz-Villarroya Reference Prados de la Escosura, Rosés and Sanz-Villarroya2012).
The economic liberalisation and stabilisation measures introduced at the end of the 1950s, together with foreign assistance, led to a transition of the Spanish economy toward a new phase of economic development (Prados de la Escosura, Rosés, and Sanz-Villarroya Reference Prados de la Escosura, Rosés and Sanz-Villarroya2012). This period was characterised by high economic growth rates and by the lead taken by the industrial sector in the country's economic activity. New investments in infrastructures such as roads, railways, and communication networks led to further reductions in internal transport costs. Spanish economic growth in the 1960s was also characterised by the growing mobility of the labour force that was becoming increasingly concentrated in the big cities. Rural exodus towards cities, as well as to more developed European countries (Figure 2), resulted in a substantial decline in agrarian employment and an increase of the share of manufacturing, construction, and services sectors (Ródenas Reference Ródenas1994; Bover and Velilla Reference Bover and Velilla1999; Bentolila Reference Bentolila2001). Contrary to the previous phase of the 1920s, migrants from the southern provinces now played a key role in the migratory flows; migrants' destinations were, however, still limited to a relatively small number of large cities, mainly Madrid and Barcelona.Footnote 19 A new wave of international migration took place in 1960–1973, with more than 100,000 workers migrating per year to the core European countries (Bover and Velilla Reference Bover and Velilla1999).
The crisis of the 1970s, which in the case of Spain stretched well into the 1980s, put a brake on these upward trends and GDP growth rates were substantially reduced. The concentration of manufacturing industries somewhat receded during these years, thus causing the spatial distribution to present a bell-shaped evolution in the long term (Paluzie, Pons, and Tirado Reference Paluzie, Pons and Tirado2004). Furthermore, traditional industries (mining, metallurgy) underwent severe reconversion processes in the 1980s. Importantly, inter-regional migration rates fell in the 1970s and early 1980s, arguably as a result of the high unemployment during those years (Bentolila and Blanchard Reference Bentolila and Blanchard1990; Bentolila and Dolado Reference Bentolila, Dolado and Schioppa1991).
The new phase in Spanish economic growth, which started after the entry of the country into the European Union (EU) in 1986, was no longer linked to the leadership of industrial production, but rather to that of the services and construction sectors. Internal migration was now characterised by an increase in the dispersion of migratory flows due to the growing importance of services, an economic sector that is much less spatially concentrated than industry. Increasing congestion costs, such as the rise in housing prices, the higher weight of amenities, and other aspects related to the quality of life or the effect of redistributive policies would also account for the lower intensity of migratory flows in the more recent decades (Bover and Velilla Reference Bover and Velilla1999; Bentolila Reference Bentolila2001). Yet, these declining inter-province migrations, shown in Figure 2, were partially counterbalanced by growing intra-province migrations (Paluzie, Pons, Silvestre, et al. Reference Paluzie, Pons and Silvestre2009b). In addition, a new wave of investment in infrastructure helped to further reduce transport costs across Spanish regions and also across national borders. Large investments in freeways, high-speed railway, and telecommunications developed during these years, thus leading to major advances in the integration of the internal Spanish market and its connection to international markets. In this respect, the accession of Spain to the EU in 1986 bolstered the Spanish economy, thus further promoting the catch-up process to the most developed countries during the 1990s. The tertiarisation of the economy was completed at the same time that substantial GDP per capita growth rates were reached (Prados de la Escosura and Rosés Reference Prados de la Escosura and Rosés.2009).
DATA
In order to better understand the long-run evolution of agglomeration economies in Spain, we have built a panel data set that traces the population of 464 districts from 1860 to 1991.Footnote 20 Based on the Population Censuses that were carried out approximately every decade, our dataset thus covers 13 periods. Within the framework of an integrated economy, the use of population rather than income data in measuring economic activity has the advantage of taking into account that migration flows respond to income differences and tend to mitigate them. Regional differences in productivity might then be better reflected in population figures (Glaeser, Scheinkman, and Shleifer Reference Glaeser, Scheinkman and Shleifer1995; Beeson, Dejong, and Troesken Reference Beeson, Dejong and Troesken2001). Yet, our study is somewhat constrained by data availability. Using population, instead of working-age population or employment, might not capture all relevant changes in population structure. While migration flows increase the number of workers in receiving districts, the working-age population decreases in sending regions. Although population growth reflects these flows, it may also result from differential demographic patterns present in younger populations. Employing population data could thus lead to overestimating the effect of agglomeration economies.
The unit of analysis is the district or Partido Judicial, an administrative category composed of several municipalities.Footnote 21 In 1832, the Ministry of Public Works (Ministerio de Fomento) was created by royal decree. A year later, a territorial reorganisation was carried out and Spain was split into 49 provinces, which were also subdivided into smaller districts, the Partidos Judiciales.Footnote 22 The latter were created for two major reasons: for electoral purposes and to set up courts in the capital of each district, which gave rise to a greater centralisation of the national justice system.Footnote 23 Map 1 illustrates the territorial organisation of Spain in 1860.
PARTIDOS JUDICIALES (DISTRICTS) IN SPAIN, 1860

Employing districts as units of analysis has several advantages (Beeson, Dejong, and Troesken Reference Beeson, Dejong and Troesken2001; Desmet and Fafchamps Reference Desmet and Fafchamps2005). On the one hand, districts better capture the potential effects of agglomeration economies than cities because they allow taking into account the hinterland, as well as avoiding the comparability problems generated by the rise of metropolitan areas (Partridge, Rickman, Ali, et al. Reference Partridge, Rickman and Ali2008). On the other hand, given that we cover the whole Spanish territory, district-level data avoids the sample selection bias usually present in the literature focusing on cities. These studies only consider settlements above a certain threshold, thus focusing on those that have been relatively successful and missing those that did not grow enough to reach that limit or those that declined and fell below that figure. These two features of the data are crucial not only because most population has traditionally lived in rural areas, but also because rural out-migration was an essential dimension of how the spatial distribution of the population evolved. Michaels, Rauch, and Redding (Reference Michaels, Rauch and Redding2012, pp. 536, 548) show that examining both rural and urban areas significantly enhances our understanding of the urbanisation process. As these authors point out, the unit of analysis should be stable over time. Given that during the period under analysis, legislative changes have somewhat affected these administrative boundaries, we have homogenised our panel dataset using the administrative boundaries existing in 1860. We therefore rely on district boundaries that are consistent over the whole sample period. Overall, the average surface area is 1,075 squared kilometres, which allow us to capture metropolitan areas (Madrid, Barcelona), but at a lower level of aggregation than provinces (NUTS3), thus reducing potential distortions arising from the Modifiable Areal Unit Problem (MAUP) (Briant, Combes, and Lafourcade Reference Briant, Combes and Lafourcade2010).Footnote 24 By comparison, the average size of a U.S. county is around 1,500 squared kilometres (Michaels, Rauch, and Redding Reference Michaels, Rauch and Redding2012, p. 551).
Spanish population increased significantly during our period of study: from around 15.6 million people in 1860, to 18.5 million in 1900, 23.6 million in 1930, 30.4 million in 1960, and reaching 40 million in the 1990s. Its spatial concentration also underwent major changes throughout this period. Map 2 depicts how district population evolved between 1860 and 1991. Generally speaking, districts grew in size, yet unevenly, showing a tendency to concentrate along the coast and around Madrid, the capital city.
POPULATION IN SPAIN BY DISTRICT, 1860–2001
Figure 3 illustrates the structural change, proxied by the share of employment in industry and services, and the average and median size of districts by year. In the early stages, there appears to be a steady, though timid, increase in the districts population. This is expected given that structural change was rather modest. Yet, from 1920 to 1970, the Spanish population rapidly concentrated. The mechanisation of agriculture and the spread of industrialisation, especially since the 1950s, fuelled rural-urban migration.Footnote 25 Districts where modern industries located grew rapidly, whereas traditional and agrarian ones shrunk. This diverging pattern between the average and median sizes continued, but at a slower pace, into the late decades of the twentieth century, thus coinciding with the growth of the service sector and the rise of information and communication technologies (ICT).
STRUCTURAL CHANGE AND SPATIAL CONCENTRATION OF POPULATION IN SPAIN, 1860–1991

Agglomeration economies take place in more densely populated areas. Therefore, the evolution of the spatial concentration of the population can also be examined focusing on the relationship between the initial level of the district population size and subsequent population growth. Figure 4 fits kernel regressions showing the link between these two variables in each period (approximately 10-year intervals). Broadly speaking, while the second half of the nineteenth century appears to be characterised by quasi-orthogonal growth, the early twentieth century witnessed large districts tending to grow faster than small ones, a feature that intensified during the second half. Interestingly, the positive link between initial population and subsequent growth reverses for the largest locations from 1970 onwards, suggesting that congestion costs began to exert a significant effect during this later period. The next section examines these issues in more detail with the aim of quantifying how the effect of agglomeration economies evolved over time.
DISTRICT POPULATION VS INITIAL POPULATION

EMPIRICAL SPECIFICATION
In order to examine how the size of the local economy affects subsequent growth over time, we first estimate the following model for the whole period, 1860–1991, using ordinary least square (OLS):

where Δy it is the population growth rate of each district between two censuses (Δy it = ln y t+1 i – ln y t i) while y it refers to the log of the population level at the beginning of each period. Given that both variables are measured in logs, the estimated parameters can be interpreted as elasticities. In addition, x' i is a vector of control variables taking into account geographic, climatic, and geological features of each district. Appendix Tables 1 and 2 explain how the variables employed have been obtained and report summary statistics.
On the one hand, given that we attempt to isolate the effect of agglomeration economies from other determinants of population growth, we have included geographic characteristics that capture the locational fundamentals of each district. First, using the WorldClim 1 kilometre digital data, we have computed the average annual temperature and average annual rainfall.Footnote 26 Second, the SRTM 90-meter resolution digital elevation data allows a measure of the median altitude of each district, as well as a ruggedness index that measures the standard deviation of altitude. Third, drawing on the European Environment Agency WISE Large Rivers dataset, a dummy variable takes the value of 1 if a district has access to a large river. Similarly, we have also computed distance to the coast. Fourth, to further proxy for the potential agricultural productivity, we have relied on certain soil quality parameters provided by the European Soil Database (ESDB 1-kilometer resolution): top soil available water capacity, base saturation of the top soil, volume of stones, top soil organic content, and distance to rock. Following Pierre-Philippe Combes, Gilles Duranton, Laurent Gobillon, et al. (Reference Briant, Combes and Lafourcade2010), we have computed the most common category in each district and then assigned the corresponding dummy variables to control for that. Given the large heterogeneity of the districts' geographic size, the specification also controls for district area. Moreover, given the central location of Madrid, the country's capital, a dummy variable has also been created to account for this.Footnote 27
On the other hand, the growth of a particular district not only depends on its own economic dynamism, but also on that of competing neighbouring population, so our model incorporates the existence of important neighbouring locations using GIS techniques.Footnote 28 More specifically, we have computed for each period the population living in towns larger than 10,000 inhabitants within a certain radius from the district centroid: less than 50, 50–100, 100–250, and 250–500 kilometres, respectively.Footnote 29 Lastly, to capture potentially unobserved characteristics, we include time and regional fixed effects.Footnote 30
Estimating a pooled-OLS model including the variables explained earlier yields a statistically significant long-run coefficient of 0.077 for the whole period, thereby implying a positive relationship between initial size and subsequent growth: a 1 percent increase in initial population results in a 0.077 percent increase in population growth (see Appendix Table 3).Footnote 31 Given this long-run relationship, we delve further into its nature by estimating equation (1) using OLS for each period. All 12 estimations include the control variables described earlier and regional fixed effects.Footnote 32
Table 2 reports the estimated coefficients for each period, whereas Figure 5 displays them. The long-run elasticity (0.077) is represented with a dotted-line (LRE). Standard errors are clustered at the provincial level to take into account that same-province districts may share unobserved characteristics. These results provide empirical evidence that the effect of size was negligible in the second half of the nineteenth century and the first decade of the twentieth century: the estimated coefficients were mostly not statistically different from 0 between 1860 and 1910.Footnote 33 Centripetal forces only started consistently to induce population concentration after 1910. The estimated coefficients kept growing during the first third of the twentieth century, from 0.055 in the 1910s to 0.077 in the 1930s. The Civil War and its aftermath, however, saw a setback in the intensity of agglomeration economies which were reduced to around 0.040. While in the 1950s the estimated coefficients returned to the levels existent prior to the war, the 1960s experienced a major boost that situated them around 0.156. Although the 1970s still enjoyed relatively high figures (around 0.131), the effect of initial size on subsequent population growth declined in the 1980s (0.056). The long-run elasticity is thus mainly determined by the 1960s and 1970s. The net effect is smaller than the LRE at the beginning of the twentieth century and again in the 1980s and it hardly exists between 1860 and 1910.
EVOLUTION OF AGGLOMERATION EFFECTS (OLS)

EVOLUTION OF AGGLOMERATION ECONOMIES. OLS RESULTS

Note: Robust standard errors clustered at the provincial level in parentheses; ** p<0.01, * p<0.05. All specifications include the full set of controls discussed in the text. Both the dependent and the independent variables are expressed in natural logs, so the coefficients can be interpreted as elasticities.
The previous model may suffer from endogeneity problems. It is plausible that larger locations are the result of some local characteristics, so their growth may not be the result of agglomeration economies but of some underlying feature, such as better agricultural potential or the presence of certain amenities (administrative or transportation infrastructures), that promotes their future growth. Although we have included a comprehensive set of variables to control for this issue, we further attempt to mitigate this concern by instrumenting the size of the local economy using historical urban population. In particular, we employ population living in cities larger than 5,000 individuals in 1500.Footnote 34 By doing so, we exploit the long-term persistence of the spatial distribution of population from the inertia that local population and economic activity generate. Given the long lag employed, this instrument is plausibly exogenous because the modern sources of local productivity differ from those existing in such a distant past.
At the same time, there might be local characteristics that affected population growth in the past that still continue to influence it in more recent times: suitable agro-climatic conditions, the presence of a large river or another geographical feature that increases the location's potential such as the centrality of the location in the country or having access to the sea (Combes and Gobillon Reference Combes, Gobillon, Duranton, Vernon Henderson and Strange2015, p. 287). This is especially important because we start measuring agglomeration economies in the mid-nineteenth century when structural change remained limited and agriculture was still a significant source of local wealth. Crucially, as discussed earlier, our model directly controls for many geographical, climate, and geological variables that may have influenced each district's potential productivity during the period under study.
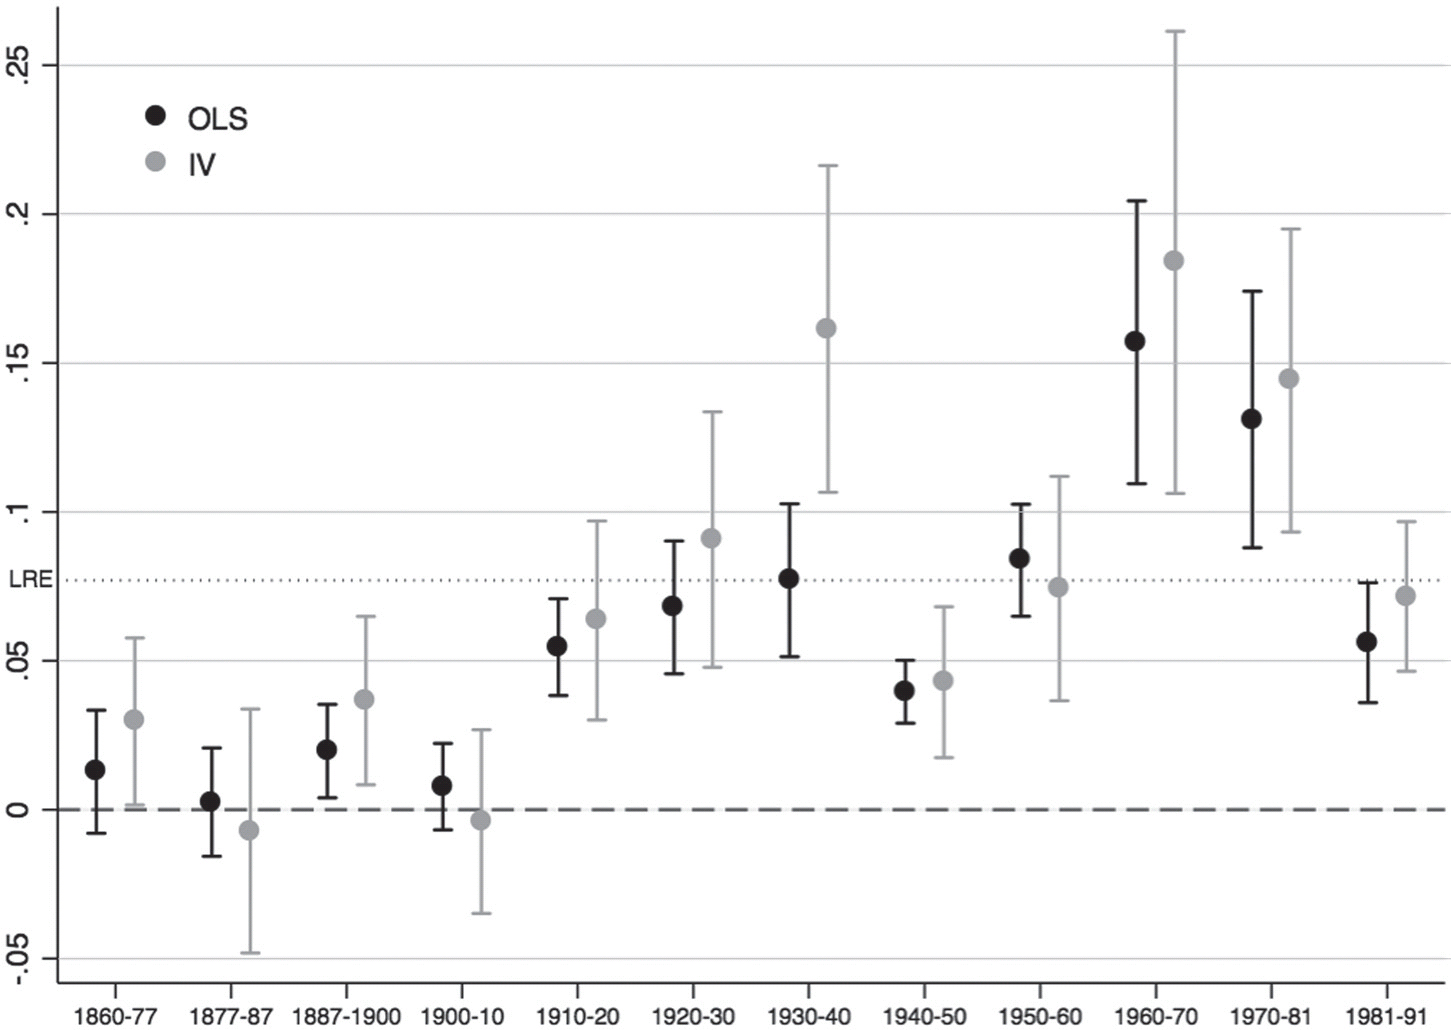
The results are reported in Table 3, with Figure 6 comparing the Instrumental Variable (IV) results to those obtained previously. As the first stage suggests, our instrument is highly correlated with the instrumented variables.Footnote 35 Broadly speaking, both sets of estimated coefficients depict similar trends. Although the difference is not statistically significant, the IV results tend to be higher, especially between 1910 and the Civil War and between 1960 and 1980, thus reinforcing the image of rapid structural change and the increasing spatial concentration of the population that these two periods witnessed.Footnote 36 By the 1930s, when initial size was twice as large, growth was around 16.1 percent higher. The magnitude of agglomeration economies was even higher during the 1960s. In comparison, these forces paled during both the aftermath of the Civil War and the 1980s.
EVOLUTION OF AGGLOMERATION EFFECTS (OLS VS IV)

EVOLUTION OF AGGLOMERATION ECONOMIES. IV RESULTS

DISCUSSION
The results presented earlier are consistent with theoretical and applied studies. Krugman (Reference Krugman1991), on the one hand, suggests that agglomeration economies strengthen as transport costs are reduced over time. On the other hand, the structural transformation away from agriculture also helps explaining the increasing effect of agglomeration over time, especially in medium-size locations. For example, the increasing relationship between initial size and subsequent population growth at intermediate U.S. locations was stronger from 1880 to 1960 than during the late twentieth century (Michaels, Rauch, and Redding Reference Michaels, Rauch and Redding2012, p. 537). This pattern is arguably related to reallocation away from agriculture, a process that was significantly more intense during the former period. Michaels, Rauch, and Redding (Reference Michaels, Rauch and Redding2012, p. 536) argue that, in more populated areas, where non-agricultural activities already dominate, further population growth is not necessarily correlated with initial population density. Taking into account the obvious differences between the history of the United States and Spain, the evolution of the effect of initial size on subsequent population growth is similar. In Spain, this relationship, even when the largest districts are excluded, increased significantly between 1910 and 1970, although this trend was abruptly interrupted by the Civil War and the autarchic period. Using provinces as unit of analysis, Ayuda, Collantes, and Pinilla (Reference Ayuda, Collantes and Pinilla2010) also find that increasing returns only started to play a role in the geographical concentration of the Spanish population from 1900 onwards as the share of increasing-returns sectors in the Spanish economy grew.
The relatively high coefficients found around 1960/1970s are consistent with the comparatively higher incidence of agglomeration economies found in developing countries nowadays.Footnote 37 The intensity of the link between initial population and growth decreased in the 1970s, a process that continued during the 1980s. Klaus Desmet and Marcel Fafchamps (Reference Desmet and Fafchamps2005, p. 262) argue that these recent developments can be attached to de-industrialisation. While services, mostly a non-tradable activity, had traditionally been spread out, declining transportation and communication costs have recently allowed even services to concentrate (Paluzie, Pons, and Tirado Reference Paluzie, Pons and Reig2007). In contrast, the same processes have weakened the benefits from agglomeration in manufacturing, thus promoting its geographical dispersion.Footnote 38 The depression that followed the 1970s crises indeed meant that the service and construction sectors replaced industrial production as the main engines of economic growth in Spain (Bentolila and Blanchard Reference Bentolila and Blanchard1990; Bentolila and Dolado Reference Bentolila, Dolado and Schioppa1991). Similarly, as land prices increase, more land intensive activities, such as manufacturing, are replaced by less land intensive activities, such as services (Desmet and Fafchamps Reference Desmet and Fafchamps2005, p. 262). Consistent with our results, Paluzie, Pons, and Tirado, et al. (Reference Paluzie, Pons and Tirado2004) show that the spatial distribution of manufacturing in Spain presented a bell-shaped evolution, with an initial phase characterised by a significant increase in industrial concentration followed by a trend reversal since the 1970s when a growing dispersion of industry is observed.Footnote 39 In this regard, Paluzie, Pons, Javier Silvestre, et al. (Reference Paluzie, Pons and Silvestre2009b) show that the geography and intensity of internal migrations mirrored the patterns of industrial concentration.
Increasing congestion costs, arising from rising housing prices and the higher weight of amenities and other aspects related to the quality of life (Bover and Velilla Reference Bover and Velilla1999; Bentolila Reference Bentolila2001), may also explain why the coefficients on initial population got smaller during the 1970s and 1980s. Focusing on the evolution of the largest cities, Lanaspa, Pueyo, and Sanz (Reference Lanaspa, Pueyo and Sanz2003) find that while differences in city size were amplified between 1900 and 1970, small and intermediate cities grew faster than large ones from that moment onwards.Footnote 40 As a result of congestion and pollution costs, agglomeration economies are subject to diminishing returns, so we now explore how agglomeration economies depend on district size. The size of the coefficients we have estimated reflect the total net impact of the concentration of economic activity. Given that congestion costs increase as population density grows, it is interesting to examine their importance by estimating the same model but excluding the largest districts.
Figure 7 compares the 2SLS results of estimating equation (1) using the whole sample for each period to those from replicating the same exercise but sequentially excluding the largest locations: those with a population of more than 1 million, 500,000, and 250,000 inhabitants, respectively (see also Appendix Table 4). This exercise shows that our results are not just driven by the upper tail of the distribution. The estimated coefficients of initial size on subsequent population growth, once the largest districts are excluded from the sample, actually remain qualitatively unchanged up to the 1930s, when they slightly increase. Furthermore, once the disruptions caused by the Civil War and its aftermath waned, this occurs again, though the difference between the coefficients is only statistically significant in the 1980s. These results could be driven by the dynamism of middle-sized districts and the presence of congestion costs in the largest districts, especially during the more recent decades. Yet, it is worth noting that, despite congestion costs, the gains from agglomeration prevailed.
EVOLUTION OF AGGLOMERATION EFFECTS (IV). EXCLUDING LARGEST DISTRICTS

CONCLUSION
Agglomeration economies play a fundamental role in the location of economic activity. However, the impact of these forces is likely to have varied over time. We have shown how economic density only started to significantly influence the spatial concentration of the Spanish population in the early twentieth century, a process closely related to the structural transformation of the economy. The effect of initial population on subsequent population growth increased between 1910 and 1970, although this trend was temporarily interrupted by the Spanish Civil War and the autarkic period that followed. The intensity of this relationship, however, receded in the 1970s, and especially during the 1980s, as rural out-migration slowed down and several traditional industries declined significantly. Furthermore, the largest locations did not benefit as much as medium-size ones from the presence of agglomeration economies after the 1960s.
This study thus sheds further light on the forces that have shaped the spatial distribution of population in Spain. Although previous research has already pointed to the relevance of increasing returns, this is the first approach employing districts, instead of provinces. By using a smaller spatial unit and more benchmark periods, we delve further into the subject. Moreover, this study suggests that congestion costs started to play an important role since the 1970s. More research, however, is needed on the trade-off between increasing returns and congestion costs. Notwithstanding, our study emphasises the changing nature of the relationship between the size of the local economy and population growth, thereby stressing the relevance of historical studies in understanding a hotly debated issue.
Appendix
DESCRIPTION OF THE VARIABLES EMPLOYED

SUMMARY STATISTICS

AGGLOMERATION ECONOMIES. POOLED OLS RESULTS

EVOLUTION OF AGGLOMERATION ECONOMIES. IV RESULTS. DIFFERENT SAMPLES