I. INTRODUCTION
While much attention in recent literature has focused on the enhanced strength and hardness of nanocrystalline (NC) metals, far fewer publications have been dedicated to their fatigue behaviors.Reference Padilla and Boyce1 From the few studies available, clear trends of improved high-cycle fatigue performance compared to coarse-grained (CG) and ultrafine grained (UFG) counterparts have emerged. For example, enhanced high-cycle fatigue resistance has been observed in NC Ni,Reference Padilla and Boyce1–Reference Hanlon, Tabachnikova and Suresh4 Ni alloys,Reference Boyce and Padilla5 Al,Reference Kumar, Alam and Haque6 Ti,Reference Garbacz, Pakiela and Kurzydlowski7 Co,Reference Cavaliere3 and Cu.Reference Witney, Sanders, Weertman and Eastman8 For these materials to be reliable, it is critical to understand the effects of notches, flaws, and geometric discontinuities on their fatigue performance, especially since NC metals can be particularly susceptible to processing-related flaws (e.g., pores, inclusions, and surface roughness),Reference Koch9,Reference Sanders, Youngdahl and Weertman10 which are suspected to compromise their mechanical properties.Reference Sanders, Youngdahl and Weertman10–Reference Hugo, Kung, Weertman, Mitra, Knapp and Follstaedt12
The stress concentrating effect of a notch is often considered analytically from the perspective of continuum elasticity solutions where there is no material length scale.Reference Peterson and Plunkett13 Even within the framework of purely elastic behavior, the presence of grains introduces a field of anisotropic domains that give rise to local stress and strain heterogeneities superposed on the macroscopic elastic solution.Reference Bishop, Emery, Field, Weinberger and Littlewood14 Under elastic loading, notch effects associated with NC grains can differ from their CG counterparts in three ways: (i) for a given notch size and loading condition, there are more NC grains in the high stress region allowing for a broader statistical sampling of microstructural features; (ii) as grain size decreases, Hall–Petch strengthening permits higher elastic stresses before the onset of plasticity; and (iii) at very small grain sizes, near the amorphous limit, the Hall–Petch effect saturates or breaks down,Reference Meyers, Mishra and Benson15 and the modulus decreasesReference Kim and Bush16,Reference Giallonardo, Erb, Aust and Palumbo17 and becomes more isotropic.
Under plastic loading, notch effects are more complicated with the additional considerations of slip anisotropy and strain-gradient plasticity effects. In deformable CG metals, the stress concentrating effect of a notch is generally diminished, compared to the elastic solution, due to the plastic dissipation or blunting of the notch.Reference Yen and Dolan18 For NC metals, Kumar et al. have surprisingly postulated that “extreme stress homogenization” causes notches to have an “immeasurable amount of stress concentration.”Reference Kumar, Li, Haque and Gao19 They found that in notched thin film monotonic tensile tests on 50 nm grain size NC Al, failure occurred far away from the notch and only elastic deformation was observed within the notch.Reference Kumar, Li, Haque and Gao19,Reference Kumar, Haque and Gao20 Based on molecular dynamics (MD) simulations, they suggested that grain rotation and grain boundary mediated deformation “minimize strain anisotropy and gradient in the deformation field.”Reference Kumar, Li, Haque and Gao19 This evidence from monotonic fracture might also be taken to infer that notches will have negligible effects on fatigue behavior as well.Reference Kumar, Alam and Haque6
In fatigue, notch effects become even more convoluted and are often characterized using empirical or semiempirical methods. A common method to assess notch sensitivity in fatigue is to compare the endurance limits of the notched and un-notched material. An effective fatigue stress concentration, K f, can be simply defined as the ratio of the un-notched endurance limit to that for the notched members. It has been widely observed and generally accepted that the fatigue stress-concentration factor is lower than the theoretical elastic stress concentration factor, K t, and a notch sensitivity factorReference Suresh21–Reference Pilkey and Pilkey23 can be described as
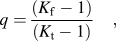 $$q = {{\left( {{K_{\rm{f}}} - 1} \right)} \over {\left( {{K_{\rm{t}}} - 1} \right)}}\quad ,$$
in which a value of zero implies that the material is completely insensitive to the notch (i.e., that there is no difference between the endurance limits of the notched and un-notched material), and a factor of one implies that the material is fully notch sensitive in that the fatigue stress concentration factor equals the theoretical elastic stress concentration factor. Currently, very limited data exist for the notch sensitivities of unconventional grain sized metals (e.g., UFG or NC metals). One of the only detailed studies was performed by Lukáš et al. which compared the notch effects on the fatigue endurance limits in 305 nm grain size UFG Cu to 50 μm grain size CG Cu with several different semicircular notch radii ranging from 50 μm to 1 mm.Reference Lukáš, Kunz and Svoboda24 For both grain sizes, there was a pronounced notch-size effect, in which the notch sensitivity factor decreased with decreasing notch radius. In the 305 nm UFG Cu with a notch radius of 1 mm, the fatigue stress concentration factor, K f, was found to be 1.73, only ∼10% below the theoretical stress concentration factor; at a notch radius of 50 μm, the presence of the notch had a lesser effect on the fatigue endurance limit, in which a fatigue stress concentration factor of only 1.16 was observed (i.e., the endurance limit of the notched material was only 14% lower than the unnotched counterpart). A similar notch-size effect was found for the CG Cu, though at all notch sizes, persistently higher notch sensitivity factors were observed for the UFG material compared to the CG counterpart. To reiterate this final point for the purpose of emphasis, the higher notch sensitivity in the UFG material compared to the CG material suggests that NC metals should have a stronger effective stress concentration in fatigue compared to their CG counterparts—this appears to contradict the lack of stress concentrating effects found in notched NC Al by Kumar et al.Reference Kumar, Alam and Haque6,Reference Kumar, Li, Haque and Gao19,Reference Kumar, Haque and Gao20
Regarding notch effects on the fatigue properties of NC metals, even less work has been performed. One conference proceedings report on the high cycle fatigue of 55 nm grain size NC TiReference Garbacz, Motyka, Ziaja, Lewandowska, Sieniawski and Topolski25 briefly mentioned that the lower fatigue strengths found in their notched samples could be attributed to high notch sensitivity in nanostructured materials; however, a systematic follow up has not yet been published. A recent study also alluded to possible effects of line edge-roughness on the fatigue in ultrathin NC Au,Reference Hosseinian and Pierron26 but a direct comparison of the fatigue in smooth edged and rough edged samples was not made. To our knowledge, a systematic study on the actual fatigue stress concentrations and notch sensitivity in NC metals has not been previously performed.
The purpose of the current work is to provide insight into the effects of geometric discontinuities on the NC fatigue properties and to confirm that stress concentrations are indeed relevant in NC metals. In this study, electrodeposited specimens from two different lots, deposited at slightly different conditions, were tested to failure in tension–tension fatigue. The materials from the two lots had nearly identical microstructures; however, a critical difference was found in the overall surface quality—the first deposition lot resulted in a relatively defect-free surface, while the specimens from the second deposition lot consistently showed small surface defects in the form of surface depressions or “pits”. These two as-deposited conditions present a realistic and somewhat typical scenario of electrodeposited material in which the overall quality of the deposited film can vary with the deposition conditions. Therefore, it is of practical interest to characterize the potential effects of these intrinsic defects on the fatigue performance. To examine fatigue stress concentrations and notch sensitivities systematically, micro-scale extrinsic defects in the form of semicircular notches were intentionally introduced and the high-cycle fatigue performance was compared to nominally pristine material and material with smaller intrinsic defects. The fatigue stress concentrations and the notch sensitivity factors were determined for each case as functions of the notch (or defect) size and the crack initiation sites were evaluated to further elucidate the effects of the stress concentrations.
II. EXPERIMENTAL DETAILS
A. Sample preparation
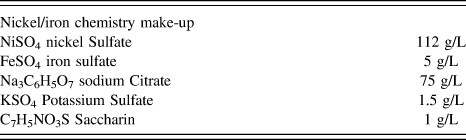
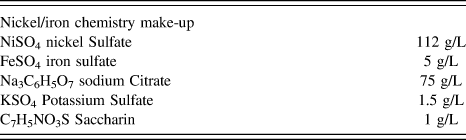
Two sets of NC nickel/iron (Ni–Fe) foils were electrodeposited using the chemistry constituents listed in Table I. The chemistry was mixed together using stir bar agitation at 30 °C and a pH of 4.8 (adjustments in pH were made using 30% ammonium hydroxide, when necessary) and then filtered prior to deposition. A pulsed electrodeposition method was used that implemented a 1 s “on cycle” and a 3 s “off cycle”. In the first material lot (“Lot-10 mA”), a current density of −10 mA/cm2 was applied during the on cycle, while −20 mA/cm2 was applied during the on cycle for the second material lot (“Lot-20 mA”). In both cases, a bias of −0.19 mA/cm2 was applied during the off cycle to keep the surface activated while restoring the interfacial cation concentrations to near bulk values.
Nickel/iron chemistry make-up for both deposition lots. Stir bar agitation was used at 30 °C and a pH of 4.8.
In both cases, the Ni–Fe was deposited onto a 100 nm thick layer of e-beam evaporated Cu on top of a 20 nm thick titanium adhesion layer on a Si wafer carrier substrate. A negative lithographically patterned mold of KMPR photoresist was used to define individual tensile dogbones with nominal gage widths of 500 µm and gage lengths of 2.4 mm. The dogbones were removed using a selective Cu etch consisting of 30% ammonium hydroxide to water solution mixed with 300 g/L of sodium chlorite. The average dogbone thicknesses within the gage sections were 11 ± 3 µm in the Lot-10 mA specimens, and 22 ± 4 µm in Lot-20 mA (measured using a Mitutoyo VL-50A digital indicator, Aurora, Illinois).
The microstructures and compositions were found to be nearly identical for both material lots. Average grain sizes, approximated using the linear intercept methodReference Suryanarayana27 from multiple transmission electron microscope (TEM, Philips CM30 at 300 kV; FEI Company, Amsterdam, The Netherlands) images, were 16 ± 8 nm for Lot-10 mA and 15 ± 8 nm for Lot-20 mA (note: parallel lines were drawn perpendicular to the growth direction; ∼200 grains were counted in each case). Figure 1(a) shows a representative bright field TEM image taken from Lot-10 mA. Energy-dispersive x-ray spectroscopy (results not shown) revealed compositions of Ni–40 wt%Fe for both lots and x-ray diffraction (XRD) analysis, presented in Fig. 1(b), confirmed the expected presence of a single FCC phase. In general, the XRD patterns were very similar for both material lots; in particular, the profiles exhibited similar peak widths implying comparable average grain sizes (note, < 6% difference was found between the calculated average grain sizes using the Scherrer equation), and no peak shifts relative to each other were observed, suggesting similar compositions and internal stress levels.Reference Cullity28,Reference Vicenzo29 The only notable difference in the XRD profiles was a slight decrease in the (200) peak in the Lot-20 mA material, likely due to a slight increase in the (111) crystallographic texture; the (111) texture has been previously shown to increase with increasing current density in similar electrodeposited metals.Reference Ullal and Hegde30
(a) Representative cross-sectional bright field TEM image (Philips CM30 at 300 kV) of the electrodeposited NC Ni–Fe (Lot-10 mA shown here) and accompanying diffraction pattern showing the NC structure. The arrow in (a) denotes the deposition direction. (b) X-ray diffraction patterns, normalized by the (111) peak intensities, revealing the expected single FCC phase and similar profiles for both lots; a slightly stronger (111) crystallographic texture was observed for the samples deposited at −20 mA/cm2 (Lot-20 mA), compared to those deposited at −10 mA/cm2 (Lot-10 mA), consistent with other reports of electrodeposited NC metals.

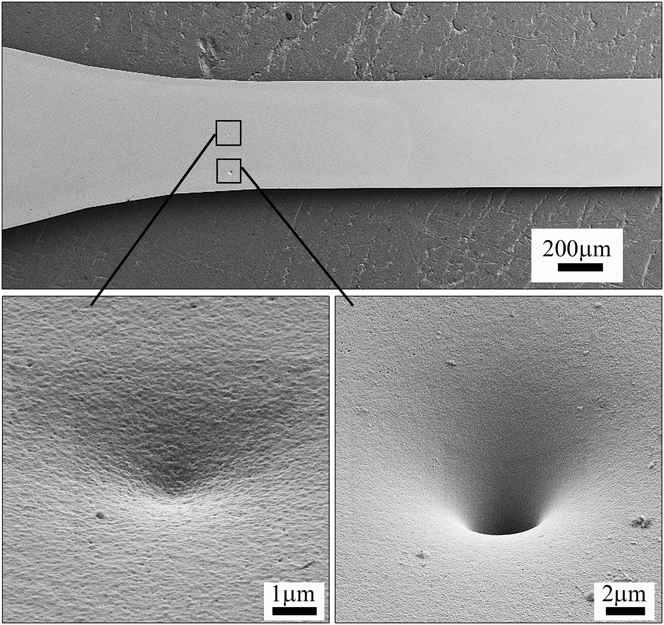
Although the microstructures were found to be very similar, a critical difference was found on the surfaces of the electrodeposited specimens—in the Lot-20 mA material deposited at the higher current density, small depressions or “pits” with an average radius of 2.0 ± 1.5 µm, representatively shown in Fig. 2, were observed on the surfaces; no obvious surface defects were found in the Lot-10 mA material that was deposited at the lower current density. These defects in the Lot-20 mA material likely arise from the production of hydrogen gas bubbles at the cathode surface. These pits have long been known to form in nickel deposits from hydrogen gas bubble formation,Reference Cymboliste31,Reference Watanabe32 where the plating ceases in the vicinity of the bubble once formed; after growing beyond a critical size, the bubble desorbs from the surface, allowing plating to continue in the region, thus filling the hole but leaving behind a small pit. It is likely that the larger potential used for the Lot-20 mA deposits led to an increased propensity for hydrogen gas bubble formation and thus more pits compared to the deposit at a lower current density. It is important to note here that even in the Lot-20 mA material, only a few (usually one or two) of these intrinsic defects were found in each specimen; thus, they would not be expected to greatly affect the monotonic mechanical properties, but may play an important role in the high-cycle S–N fatigue response, given that fatigue crack initiation is generally a “weakest link” phenomenon.Reference Bloom and Ekvall33
Examples of surface defects (surface depressions and “pits”) with an average size of 2.0 ± 1.5 µm in radius in the material deposited at −20 mA/cm2 (Lot-20 mA). In each Lot-20 mA specimen, at least one (but no more than three) of these intrinsic defects were found, while no obvious defects were observed in the material deposited at −10 mA/cm2 (Lot-10 mA).
Baseline mechanical properties of the as-deposited NC Ni–Fe dogbones were evaluated using monotonic tensile tests performed at strain rates of ∼10−3/sec. As expected, both material lots showed similar mechanical properties despite the differences in the surface quality and sample thickness: in the Lot-10 mA material, the elastic modulus, 0.2% offset yield strength, and ultimate tensile strength were 131 ± 3, 1.5 ± 0.2, and 1.86 ± 0.03 GPa (four samples tested), respectively; in the Lot-20 mA material, these properties were 133 ± 2, 1.5 ± 0.3, and 1.8 ± 0.2 GPa, respectively (six samples tested). In both cases the total strain to failure was 5 ± 3%. All of these properties are consistent with other reports for NC Ni–Fe with similar grain sizes.Reference Vicenzo29,Reference Sharon, Padilla and Boyce34,Reference Yang, Imasogie, Fan, Liaw and Soboyejo35 The similarities in the mechanical properties between the two material lots corroborate that the microstructures are nominally identical, as suggested by the material characterization, and that the few surface defects found in the Lot-20 mA material did not dramatically affect the macro-scale properties.
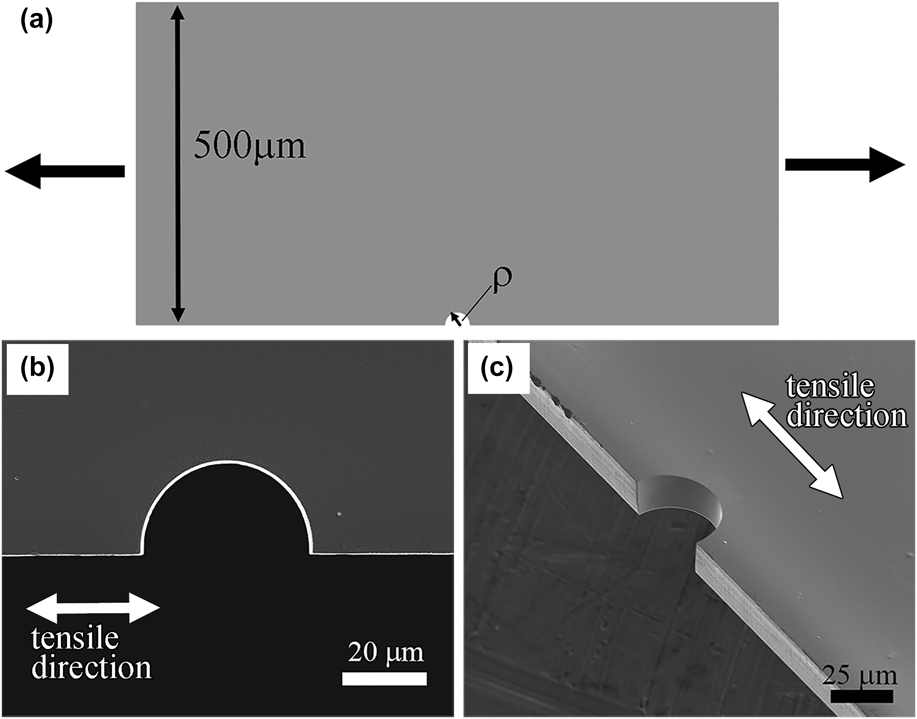
To quantify the sensitivity of the NC Ni–Fe material to stress concentrations during fatigue, extrinsic defects in the form of semicircular notches were introduced in specimens from the two material lots. The notches were prepared using dual-beam focused ion beam (FIB, FEI Nova600 and Helios Nanolab; FEI Company, Hillsboro, Oregon) micro-machining on a single edge, centered within the dogbone gage sections, as shown schematically in Fig. 3(a). The majority of each notch was milled using a high energy beam (20 nA at 30 kV) for time considerations, and a subsequent lower energy (3 nA at 30 kV) mill was used for final polishing to minimize FIB-induced damage. Figures 3(b) and 3(c) show top-down and isometric views of representative FIB-milled notches. It should be noted that subsequent TEM imaging of sacrificial notches (not shown here) was also performed and no substantial FIB damage, including FIB-induced grain growth, was observed from the notch preparation. 10 µm radius notches were used in both material lots and 20 µm notches were used in the Lot-20 mA material to assess any potential notch-size effects. The nominal elastic stress concentration factors for the given notched geometries, determined using Peterson's empirical equation for a flat tension bar with a single-edged semicircular notch,Reference Pilkey and Pilkey23 were 2.89 and 2.73 for the 10 and 20 μm notches, respectively.
(a) Schematic representation and top-down (b) and isometric (c) views of the FIB-milled single-edge semicircular notches in the NC Ni–Fe dogbones. Notch radii, ρ, of 10 and 20 µm were used in the current study.
B. Fatigue testing
Tension–tension fatigue tests were performed on the un-notched and notched specimens in lab air at room temperature using a custom-built benchtop piezo actuated testing device designed for thin foil fatigue testing. The piezo actuator (Newport NPX400SG, Irvine, California) had a total axial range of 320 µm and a 4 nm resolution. Actuator creep was eliminated by employing closed-loop feedback control using an internal strain-gauge-based displacement sensor. A 44.5 N capacity load cell (Honeywell Model 31, Morristown, New Jersey) provided the force measurements. The real-time load and displacement signals were output to a custom-built LabVIEW program allowing for either force or displacement closed-loop control. In the current study, the fatigue tests were configured for force-control, providing constant force amplitude and constant mean force sinusoidal loading at frequencies between 4 and 7 Hz and the maximum and minimum forces were selected to maintain an R-ratio (F min/F max) of 0.3.
III. RESULTS
A. Fatigue test results
Figure 4 shows the Wöhler S–N curves [the log of the number of cycles to failure (N f) versus the nominal stress range (Δσ = (σmax − σmin)] for the un-notched and notched Lot-10 mA (the samples with the relatively “pristine” surface condition) and Lot-20 mA (the material with ∼2 µm intrinsic surface defects). The stress values for the notched specimens were calculated using the dogbone thicknesses in the vicinity of the notch and the nominal un-notched gage widths. The data were fit using the Basquin relationship,Reference Stephens, Fatemi, Stephens and Fuchs36 shown as the dashed lines in the Wöhler plots, using the equation
 $$\Delta \sigma = A{\left( {{N_{\rm{f}}}} \right)^b}\quad ,$$
where A is the coefficient that represents the approximate stress range failure at one cycle and b is the fatigue strength exponent, also known as the Basquin exponent. The exponent was determined by plotting the log–log of the S–N data and calculating the slope, b, using a least-squares linear fit. Once b was obtained, the coefficient, A, was determined through a least-squares regression using Eq. (2). The endurance limit for each case was approximated as the stress range value at 106 cycles, determined using the corresponding Basquin equations. The Basquin parameters and approximated endurance limit for each fatigue data set are summarized in Table II. Figure 4 is the figure that best represents the key results of this work.
Number of cycles to failure (N f) versus the nominal stress range (Wöhler S–N plot) for the un-notched and notched Lot-10 mA (the relatively “pristine” condition) NC Ni–Fe and its counterpart, Lot-20 mA, with ∼2 µm radius intrinsic surface defects. The dashed lines show the fits to the data using the Basquin equation. Clearly, both the intrinsic and extrinsic defects resulted in a reduction of the fatigue resistance. Calculated values for the fatigue stress concentration and notch sensitivity factors for each case are shown in Table II.
Summary of the key results showing the fatigue strength exponent (Basquin exponent), b, and the Basquin coefficient, A [both determined from the Basquin relationship in Eq. (2)], the approximated endurance limit, Δσlim, theoretical elastic stress concentration factor, K t, fatigue stress concentration factor, K f, and notch sensitivity factor, q, for each case.
a Note: the specimens from the material lot contained intrinsic defects with an average radius of ∼2 µm, but were un-notched; therefore, a notch sensitivity factor was not calculated.
Despite some variability in the notched tests, it is immediately clear that the notches had a deleterious effect on the fatigue resistance in both materials. Fatigue stress concentration factors, K f, defined as the ratio of the un-notched to notched endurance limits (assuming the “pristine” curve as the un-notched material in all cases), were 1.55 and 1.53 for the 10 µm notched Lot-10 mA and Lot-20 mA, respectively, and 1.69 for the 20 µm notched Lot-20 mA material. Not surprisingly, based on conventional wisdom for notched fatigue in traditional metals, all of the values for K f are lower than the theoretical elastic stress concentration factors, K t, for the given geometries. The notch sensitivity factors, q, were then calculated using Eq. (1) to be 0.29 and 0.28 for the 10 µm notched Lot-10 mA and Lot-20 mA samples, respectively, and 0.4 for the 20 µm notched Lot-20 mA material. The fatigue stress concentration and notch sensitivity factors for each case are also included in Table II. Additionally, the un-notched Lot-20 mA specimens with the ∼2 µm intrinsic defects clearly showed reduced fatigue resistance, with the S–N data falling between the “pristine” and notched samples, corresponding to a fatigue stress concentration of 1.20 (q was not included for this case since the geometries of these intrinsic defects cannot be directly compared to the single-edged notches). Note that the S–N curves for the 10 µm notched specimens fall nearly on top of each other, despite the Lot-20 mA specimens containing the intrinsic flaws [the square data points in Fig. 4 are for Lot-10 mA and triangles are Lot-20 mA data]. This highlights the “weakest-link” phenomenon during fatigue in which the largest stress concentration in the material dictates the fatigue behavior and also serves to show that the differences in the sample thicknesses between the two material lots had negligible effects on the fatigue performance.
B. Cyclic strain ratcheting
Figure 5 shows representative fatigue data for one of the 20 µm notched samples that fractured after ∼56,000 cycles. In Fig. 5(a), the nominal engineering stress and strain amplitudes are plotted against the number of cycles, while Fig. 5(b) shows the mean engineering stress and strain. The strain here is defined using the piezo actuator displacement which, due to extra compliance from the machine and the specimen fillet regions, overestimates the actual strain values in the gage section; however, defining the strain in this way still provides a reasonable estimate of the change in strain as a function of the number of cycles. In all tested specimens, both un-notched and notched, a pronounced increase in the mean engineering strain was observed throughout the entire fatigue test, as shown in Fig. 5(b), despite relatively small changes in the strain amplitudes [Fig. 5(a)]; the mean strain first increased in a logarithmic type trajectory, followed by a more linear trajectory after ∼6000 cycles. While the initial logarithmic trajectory may be explained as a cyclic hardening phenomenon,Reference Moser, Hanlon, Kumar and Suresh37 the persistence over a large number of cycles is more in line with room temperature creep, which has been widely observed in other fatigued NC metalsReference Witney, Sanders, Weertman and Eastman8,Reference Hosseinian and Pierron26,Reference Moser, Hanlon, Kumar and Suresh37–Reference Hu, Wang, Hsu, Sun and Lin39 and is generally attributed to grain boundary mediated deformation processes (e.g., grain rotation and GB sliding). Thus, this cyclic-creep effect provides insight into the potentially dominant deformation mechanisms in these materials. As was suggested by Moser et al.,Reference Moser, Hanlon, Kumar and Suresh37 it is possible that dislocation sources can be exhausted during cyclic deformation resulting in cyclic hardening in the initial stages of deformation, followed by the time-dependent grain boundary processes (cyclic creep) in the later stages.
Representative results showing the cyclic strain behavior in a force-controlled tension–tension fatigue test of a Lot-20 mA 20 µm notched NC Ni–Fe sample. (a) Engineering stress and strain amplitudes and (b) mean engineering stress and strain as functions of the number of cycles, which reveal a continuous increase in the mean strain, indicative of room-temperature cyclic creep.
C. Crack initiation and fatigued microstructures
Figure 6 shows representative edge-on scanning electron microscope (SEM) images of the fracture initiation sites in the various cases. The apparent sources of the crack initiation are highlighted by the blue arrows. In all notched cases, the crack initiation occurred directly below the notch root, as shown in Fig. 6(a), and the predominant crack propagated away from the notch, macroscopically along the expected mode-I plane. Similarly, the crack initiation in the un-notched Lot-20 mA (the samples containing the intrinsic defects), was found to occur at the surface defects, as shown in Fig. 6(b). These observations were consistent throughout all of the specimens containing either the intrinsic or extrinsic defects which further highlights the importance of stress concentration effects on high cycle fatigue. In the un-notched Lot-10 mA specimens (the relatively “pristine” material condition), similar crack profiles were observed but in seemingly random locations within the gage sections. In some cases, no obvious source of the crack initiation was found, although fracture always seemed to initiate at one of the sample surfaces; in other cases, as revealed in Fig. 6(c), upon very close examination of the crack initiation sites, very small (≤500 nm) surface depressions were observed. Although no signs of any obvious surface pits were originally discovered prior to testing, it is possible that these very small features were indeed present and provided relatively mild, but effective, stress concentrations leading to the crack initiation. Given the apparent high notch sensitivity of this NC material, it is reasonable to assume that even very small defects, if present, may still control the fatigue response.
Representative SEM fractographs within crack initiation zones (images are taken edge-on to the fractured edges) in the (a) notched specimens (b) un-notched Lot-20 mA material containing ∼2 µm intrinsic defects, and (c) un-notched Lot-10 mA samples with a relatively “pristine” surface condition. The notched specimens consistently fractured directly under the notches, while crack initiation in the Lot-20 mA samples occurred at the intrinsic defects. Fracture in the Lot-10 mA material was seemingly more random; however upon close examination, very small (≤∼500 nm) surface depressions were found at the initiation source in some of the un-notched “pristine” material. The blue arrows highlight the apparent sources of crack initiation in each case.
To examine the potential crack initiation mechanisms during high cycle fatigue in the stress concentration regions, the subsurface microstructures under the various defects were examined by excavating material in the vicinity of crack initiation via FIB cross-sectioning. In each case, evidence of abnormal grain growth (AGG) under the crack initiation site was observed. Figure 7(a) shows a representative cross-sectional ion-channeling image of a notched specimen that fractured after ∼56,000 cycles, wherein a region of abnormally large grains [highlighted by the green arrow in Fig. 7(a)] was found at the surface of the fracture edge and directly underneath the notch. In Fig. 7(b), a TEM image from a similar sample is shown, where an isolated large grain was found along the fractured edge underneath the notch; the corresponding selected area diffraction patterns obtained within the large grained region [Fig. 7(c)] and the NC region [Fig. 7(d)] further reveal the large grain embedded in the NC matrix. These results corroborate previously reported evidence that AGG likely occurs during high-cycle fatigue in various NC metals,Reference Witney, Sanders, Weertman and Eastman8,Reference Meirom, Alsem, Romasco, Clark, Polcawich, Pulskamp, Dubey, Ritchie and Muhlstein40–Reference Mughrabi and Höppel42 including NC Ni and Ni-based alloys,Reference Boyce and Padilla5,Reference Kobayashi, Kamata and Watanabe43–Reference Cheng, Lee, Li, Lei, Almer, Want, Ungar, Wang and Liaw45 and will be discussed further in Sec. IV.
(a) Ion-channeling cross-sectional image and (b) TEM image from the vicinity of crack-initiation sites in notched fatigue specimens that fractured after ∼56,000 cycles. Abnormal grain growth (AGG), shown by the green arrow in (a) and in the TEM image in (b), was consistently observed in samples that fractured after ∼6000 cycles. The selected area diffraction patterns from the notched fatigue specimen shown in (b) further highlight the AGG region (c) embedded in the NC matrix (d) outside of the AGG region.
IV. DISCUSSION
A. Ratio of notch size to grain size
The present study, which clearly shows strong stress concentrating effects in fatigue due to geometric discontinuities, appears to contradict prior experimental observations and MD simulations of Kumar et al. which indicate that notches are negligible in NC metals.Reference Kumar, Alam and Haque6,Reference Kumar, Li, Haque and Gao19,Reference Kumar, Haque and Gao20 It is important to recognize, however, that the ratio of grain size to notch size is importantly different between those studies and the current study. In Kumar et al.’s experimental work, the grain size and notch radius were both ∼50 nm, which would cause the elevated stress field of the notch to sample only ∼1 grain. If that particular grain was oriented in a relatively “strong” orientation, failure would likely occur elsewhere at a “weaker” oriented grain, perhaps at one of the other stress concentrations found in the edge roughness all across the specimen [e.g., see Fig. 1(d) in Ref. Reference Kumar, Haque and Gao20], or in the microstructural stress concentrations caused by the elastoplastic incompatibility of grain neighbors. A commensurate conclusion was reached in a similar nano-notch monotonic tension study, wherein MD simulations confirmed that local plasticity ahead of the notch can reduce the effective stress concentration to levels that are comparable to those from other microstructural features, such as grain boundaries and triple junctions.Reference Gu, Wu, Zhang, Srolovitz and Greer46 In contrast, the notch radii of the current study were 2–3 orders of magnitude larger than the grain size—therefore, the elevated stress field from the notch could interrogate hundreds of thousands of grains, thus guaranteeing a broad statistical sampling of both “weak” and “strong” oriented grains, in addition to a variety of other potential local stress concentrators (e.g., grain boundaries, triple junctions, etc.). It is also clear that the intrinsic surface defects in the un-notched Lot-20 mA specimens led to a notable reduction in the fatigue resistance and served as the predominant crack initiation sites. Since these defects ranged in exact size and morphology, they cannot be examined as systematically as the notched specimens; however, their average size is still orders of magnitude greater than the grain size of the material and thus, they inherently sample a statistically significant number of grains compared to the nano-notches used in the previously mentioned studies.
B. Notch sensitivity and the Lukáš length scale parameter
The apparent decreasing notch sensitivity with decreasing notch radius in the NC Ni–Fe here follows conventional wisdom based on trends that have been widely reported in metals for many years.Reference Peterson and Plunkett13,Reference Lukáš, Kunz and Svoboda24,Reference Owolabi, Prasannavenkatesan and McDowell47–Reference McEvily, Endo, Yamashita, Ishihara and Matsunaga49 However, the exact mechanisms leading to this trend are still not fully understood, as several competing arguments exist. As summarized in a recent review by Pluvinage and Capelle,Reference Pluvinage and Capelle50 most researchers agree on the concept of a local fracture criterion that operates over some characteristic length; however, wide discrepancies exist regarding the nature of this characteristic length. Some of the proposed characteristic lengths rely solely on the notch geometry, others on the fracture process zone and stress distributions (which are described as material parameters), while others suggest a length scale pertaining explicitly to the grain size. For example, the original analysis by Ritchie, Knott, and RiceReference Ritchie, Knott and Rice51 (the “RKR hypothesis”) expresses that failure occurs when the fracture stress is exceeded over a characteristic distance approximately equal to 1–2 grain diameters (at least for the cleavage fracture in relatively brittle materials). Another criterion suggested by Pluvinage and Capelle for less brittle materials describes a critical distance connected to the fracture process zone, which is the high stressed volume ahead of the notch.Reference Pluvinage and Capelle50 This fracture process zone scales proportionately with the notch radiusReference Pluvinage52 and is a function of the exact stress distribution. They state that the effective fracture stress is the average volume of the stress distribution over the effective distance (a characteristic of the specific stress distribution, not the grain size). This can be expected to relate to fatigue fracture and notch sensitivity as a function of notch size in that the average volume of the stress distribution inside the process zone is larger for the larger notches, thus sampling a larger portion of the microstructure and reaching a critical value (e.g., the fatigue limit) sooner than for smaller notches. Unfortunately, much more theoretical work is required to fully understand the correct choice for the scaling parameter in NC metals, especially since additional potential complications may arise from the microstructural evolution during fatigue in these metals (e.g., AGG leading to a fatigue-induced bimodal microstructure directly under the notch, thus inconsistent grain sizes and additionally convoluted stress distributions).
Although there seems to be general qualitative agreement between the apparent notch effects in the NC Ni–Fe material here and those for conventional metals, a notable distinction can be found in the magnitudes of the fatigue stress concentration and notch sensitivity factors of the NC metals studied here, compared to UFG and CG metals. For the notch sizes used in the current study, the values for q and K f/K t are more than two orders of magnitude larger than those that would be expected for UFG materials, and the values for UFG materials are also larger than the CG metals (see Figs. 3 and 4 in Ref. Reference Lukáš, Kunz and Svoboda24). Taking this into account, the trend of increasing notch sensitivity with decreasing grain size appears to extend down to the NC regime—this is critical in that exceedingly small notch sizes, those that may have negligible effects in conventional metals, can actually have pronounced effects in NC metals. Thus, at least in the context of fatigue, stress concentrations may actually be more relevant for NC metals, again contradicting the inferences of Kumar et al. that stress concentrations may be irrelevant for NC metals. The enhanced notch sensitivity in NC metals compared to conventional metals is likely related to a similar notch-to-grain size relationship discussed earlier, and suggests that multiple length scales (e.g., both grain size and notch size) are important when assessing the notch sensitivity of a material, rather than only the notch size. It should be noted that this concept is a general principle that can be found in many other areas of mechanical behavior, and is not reserved only for scaling down to the nano-regime (i.e., the concept of notch-to-grain size ratio is not unique to NC metals). For example, in polycrystalline plasticity simulations of CG brass under monotonic deformation,Reference Battaile, Emery, Brewer and Boyce53 the notch size to grain size ratio was systematically varied to show that the largest scatter in the peak strain occurs when the notch and grain sizes are comparable. Moreover, as the notch size is enlarged well beyond the grain size, the material response becomes much less stochastic. In other words, when the notch size is equal to or less than the grain size, the material response under a geometric discontinuity deviates greatly from the elastic solution and other factors, such as microstructural heterogeneities, play a more critical role. Therefore, as the grain size is reduced from CG to UFG to NC, the critical defect size that will produce a dominant stress concentration over all other stress concentrators would be expected to decrease as well; this would lead to an apparent increase in notch sensitivity at smaller defect sizes when the grain size is reduced. To fully characterize these potential effects of the notch size to grain size ratio specifically for NC metals, additional testing across a wider array of grain sizes and notch sizes is still required and will be the subject of future work.
The reports of notch effects on fatigue by Lukáš et al.Reference Lukáš, Kunz and Svoboda24,Reference Lukáš and Klesnil54 have also revealed the potential to obtain relatively accurate approximations of the notch sensitivities of various NC metals using other potentially more convenient methods than the time-consuming notch S–N approach used in this study. For example, they suggested that the fatigue stress concentrations due to a notch can be approximated by way of the critical stress intensity factor. Under the assumption that small micro-cracks are present in the vicinity of the notch (either pre-existing or cyclically grown), the fatigue fracture can be assumed to initiate once these micro-cracks grow to a certain critical size. The critical size, a o, can be considered a characteristic length scale in fatigue fracture and is related to the notch radius, ρ, and the ratio K f/K t through the equation
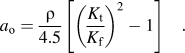 $${a_{\rm{o}}} = {\rho \over {4.5}}\left[ {{{\left( {{{{K_{\rm{t}}}} \over {{K_{\rm{f}}}}}} \right)}^2} - 1} \right]\quad .$$
Additionally, this can be related to the critical stress intensity factor assuming that this parameter is the same length scale parameter used in the equation derived from short-crack growth:
 $$\Delta {K_{{\rm{th}}}} = 1.222\cdot\Delta {\sigma _{{\rm{lim}}}}{\left( {\pi {a_{\rm{o}}}} \right)^{{\raise0.7ex\hbox{$1$}\!/\!\mathord{\left{\vphantom {1 2}}\right.\kern-\nulldelimiterspace\lower0.7ex\hbox{$2$}}}}\quad .$$
where Δσlim is the stress range endurance limit of the un-notched material. This well-known fatigue fracture equation and its correlation to notched fatigue have been experimentally verified for a variety of conventional and UFG materialsReference Lukáš, Kunz and Svoboda24,Reference Lukáš and Klesnil54 but not yet for NC metals. Using the K f/K t values determined for the NC Ni–Fe in this study (shown in Table II), a o was calculated to be 5.4 and 5.7 (with an average value of 5.55 µm) for the 10 µm Lot-10 mA and Lot-20 mA notched samples, respectively, and 7.1 µm for the 20 µm notched Lot-20 mA material. Although this a o parameter is typically on the order of the grain size for conventional metals, which is clearly not the case here, it is interesting that these calculated values are on the same order as the lengths of the micro-cracks found within the crack initiation sites [e.g., the lengths of the crack ledges or steps in the fracture surface observed in Fig. 6(a)]. When these values are applied to Eq. (4), along with the experimentally determined stress range endurance limits from the un-notched fatigue tests, the predicted values for the threshold stress intensity factors are 3.27 and 3.38 MPa m1/2 for the 10 µm notched specimens and 3.44 MPa m1/2 for the 20 µm Lot-20 mA notched case; since the critical stress intensity factor is a material constant, it would be expected that these values are very similar, if not identical, for the various notched tests, which is the case here. Therefore, the average critical stress intensity factor (the mean of these three values) for this material is estimated to be 3.36 ± 0.07, which is surprisingly close to directly obtained experimental values from crack growth experiments for similar NC metals (see, e.g., Fig. 7 in HanlonReference Hanlon, Tabachnikova and Suresh4 and Fig. 12 in CavalierReference Cavaliere3).
This, coupled with the observation that the Basquin exponents were similar for the notched and un-notched materials (shown in Table II), highlights the potential to obtain fairly accurate approximations of the fatigue performance and notch/flaw sensitivity in a variety of metals using only a few data points—this has great implications for mechanical design problems that require good first-order estimates of the material response using a limited data set. For example, in this case, knowledge of the un-notched Basquin exponent (determined from one set of un-notched fatigue tests), and an approximate stress intensity threshold factor (estimated from crack-growth experiments), may provide sufficient information for relatively quick first-order estimates of the notched fatigue behaviors and notch sensitivities.
C. Abnormal grain growth mechanism for crack initiation
The exact origins of AGG and its role on the cyclic deformation and fracture in these materials are still unclear. Boyce et al.Reference Boyce and Padilla5 showed that abnormally large grains in fatigued NC Ni–Fe were elongated in the directions of maximum stress and that they were oriented in such a way to suggest uniaxial deformation. Coupled with their observations of low-angle grain boundaries in the abnormally large grains, and faceted “blocky” fracture initiation sites, their results suggested a strong probability that the large grains underwent cyclic deformation and contributed to crack initiation. However, the question could still rightfully be asked as to whether some abnormally large grains pre-existed from the material synthesis and were deformed and further grown during the fatigue process. Although the scope of the current study is not on the detailed fracture mechanisms and AGG processes, as much more research is needed on this topic, the results here qualitatively corroborate their evidence of fatigue-induced AGG during high-cycle fatigue. It was observed here that in all of the notched samples that experienced high-cycle fatigue (> 10,000 cycles), abnormally large grains and “blocky” faceted crack initiation features, as shown earlier in Figs. 5 and 6, were found directly underneath the notch [note: no obvious AGG was found in the samples with Nf < ∼6000 cycles; our preliminary data suggest that above a certain critical stress near low-cycle fatigue conditions, only fracture occurs, similar to monotonic loading, without initiating the AGG process. The differences in the fracture mechanisms during high-cycle and low-cycle fatigue are beyond the scope of this work and will be the subject of future research]. It is worth repeating that FIB-induced grain growth was not widely observed in the as-prepared notches. It should also be noted that similar features were found under crack initiation sites in all of the samples that experienced high-cycle fatigue, whether notched or unnotched, thus reassuring the point that the notch preparation was not responsible for the AGG. Given the very low probability of always happening to mill a notch precisely centered on pre-existing anomalous regions of abnormally large grains, it is highly probable that these AGG regions were indeed grown from the original NC matrix during high cycle fatigue (i.e., that the AGG is, in fact, a fatigue-driven deformation mechanism).
Regardless of how the large grains arrived at the base of the notch, it is evident that there is a strong correlation between those large grains and the fracture of the material during high-cycle fatigue, as originally suggested by Boyce et al.Reference Boyce and Padilla5 We hypothesize that AGG is a necessary precursor for crack initiation in these metals during high-cycle fatigue and that the higher stresses and larger sampling volume of the stress concentration zones led to the early onset of AGG and thus earlier fracture compared the relatively defect-free counterparts. A follow up study is currently underway to systematically evaluate the onset of AGG as a function of the fatigue conditions to further elucidate its role in the fatigue deformation and fracture mechanisms.
V. CONCLUSIONS
The primary objective of this study was to systematically demonstrate, for the first time, the effects of geometric discontinuities on the fatigue performance of NC metals. We intended to unequivocally confirm that stress concentrations are indeed relevant in NC metals, despite some doubts recently raised in the literature. These objectives were addressed by fatigue testing electrodeposited NC Ni–Fe dogbones containing both intrinsic and extrinsic material defects, in addition to relatively defect-free samples. The intrinsic defects found in the as-received material deposited at a higher current density consisted of “pits” with an average size of 2 µm. Extrinsic defects in the form of single-edged semicircular notches with 10 or 20 µm radii were also introduced to systematically characterize the notch sensitivity of the material. It was clearly shown that both the intrinsic and extrinsic material defects had deleterious effects on the fatigue performance. In every notched specimen, dramatic reductions in the fatigue resistance compared to un-notched counterparts were observed, with fatigue stress concentration factors of ∼1.5 for the 10 µm notched specimens and ∼1.7 for the 20 µm notched samples, respectively; these stress concentration factors corresponded with notch sensitivity factors of ∼0.29 and 0.40, respectively, which are more than two orders of magnitude larger than for conventional metals with similar notch sizes.Reference Lukáš, Kunz and Svoboda24,Reference Lukáš and Klesnil54 The specimens containing the 2 µm intrinsic surface defects also showed significant stress concentration effects with a fatigue stress concentration factor of 1.2. In general, the fatigue stress concentration was found to decrease with decreasing defect size; however, additional tests are needed to further evaluate the size effects in various NC materials, particularly in terms of the notch size to grain size ratio, and to determine the limits at which the material becomes truly insensitive to the stress concentrations.
In each case, fracture was found to initiate directly under the predominant defect, thus further highlighting their stress concentration effects, and the fatigued microstructures consistently revealed abnormal grain growth within the crack initiation sites; these observations helped to qualitatively confirm that this grain growth process is a fatigue-driven mechanism that occurs during high-cycle fatigue in NC metals, and that the AGG appears to play a critical role in the crack initiation and subsequent fracture of these metals. We hypothesize that the higher stresses due to the geometric discontinuities led to the early promotion of AGG processes and, thus, earlier fracture compared to the relatively defect-free counterparts. Although the exact mechanisms responsible for the fatigue-induced grain growth are still unclear, these results highlight their importance to the fatigue and fracture behaviors of NC metals, and that the fatigue stress concentrations and AGG are likely intimately related. Devising means to inhibit these growth processes may be paramount in delaying the fracture under stress concentrations, thereby significantly improving the fatigue resistance and notch sensitivity in NC metals.
ACKNOWLEDGMENTS
The authors thank Michael Rye for FIB notch preparation and microscopy support and Dr. Bill Mook and Amy Allen for additional microscopy support. The authors also thank Dr. Khalid Hattar and Dr. Stephen Foiles for careful internal review of this manuscript. This work was performed, in part, at the Center for Integrated Nanotechnologies, a United States Department of Energy, Office of Basic Energy Sciences user facility. This work was funded by the United States Department of Energy, Office of Basic Energy Sciences, Division of Materials Science and Engineering. Sandia is a multiprogram laboratory operated by Sandia Corporation, a Lockheed Martin Company, for the United States Department of Energy's National Nuclear Security Administration under Contract No. DE-AC04-94AL85000.