





Chromosomal microarray is frequently requested by paediatricians and other clinicians as the first-line genetic investigation for children with neurodevelopmental disorders and congenital anomalies. A common outcome is identification of a copy number variant of uncertain significance (CNV VUS). These findings are among the most frequent reasons for referral to clinical genetics services because neither the referring clinician nor the clinical geneticist can confidently determine whether the CNV explains the patient’s phenotype. In this setting, clinical geneticists commonly request whole exome sequencing (WES) to search for an alternative molecular diagnosis. However, the diagnostic yield of WES after identification of a CNV VUS has not previously been quantified. If WES is substantially less likely to identify another diagnosis, this would suggest that many CNV VUS are themselves disease-causing. This study examines this question and uses differences in WES diagnostic yield to estimate the proportion of CNV VUS that are likely to be pathogenic.
Chromosomal microarray and whole exome sequencing (WES) are widely used in the diagnostic evaluation of individuals with developmental delay or intellectual disability, autism spectrum disorder, and/or multiple congenital anomalies. In this population, the diagnostic yield of chromosomal microarray is 15−20% and was recommended as a first-line test by the International Standard Cytogenomic Array Consortium in 2010 (Miller et al., Reference Miller, Adam, Aradhya, Biesecker, Brothman, Carter, Church, Crolla, Eichler, Epstein, Faucett, Feuk, Friedman, Hamosh, Jackson, Kaminsky, Kok, Krantz, Kuhn and Ledbetter2010). In 2019, a subsequent consensus statement recommended whole exome sequencing as first-line investigation for neurodevelopmental disorders, reflecting its higher diagnostic yield of 36% (Srivastava et al., Reference Srivastava, Love-Nichols, Dies, Ledbetter, Martin, Chung, Firth, Frazier, Hansen, Prock, Brunner, Hoang, Scherer, Sahin and Miller2019). Nevertheless, in Australia and many other countries, chromosomal microarray is generally performed as a first-line investigation, with whole exome sequencing offered as second line only when chromosomal microarray is uninformative.
Variants of uncertain significance (VUS) are identified in 9% to 25% of individuals undergoing chromosomal microarray for neurodevelopmental disorders, and interpretation of the findings is a common reason for referral to clinical genetics services (Chaves et al., Reference Chaves, Ocampos, Barbato, de Camargo Pinto, de Luca, Barbato Filho, Bernardi, Costa Netto Muniz and Francesca Maris2024; Jezkova et al., Reference Jezkova, Heath, Williams, Barrell, Norton, Collinson, Beal, Corrin and Morgan2020). Variants classified as uncertain cover a large range of confidence and may have a considerable spectrum of evidence toward their involvement in disease. Ultimately, some of these variants are likely to be causative for the individual’s presentation, although the available evidence is insufficient to establish or exclude pathogenicity with confidence. Consequently, clinicians must determine whether further investigation for an alternative explanation, frequently through WES, is warranted. WES may also lead to the finding of variants of uncertain significance, with reported rates of 25−86% depending on reporting practices and inclusion of parental data (Shashi et al., Reference Shashi, McConkie-Rosell, Schoch, Kasturi, Rehder, Jiang, Goldstein and McDonald2016; Trujillano et al., Reference Trujillano, Bertoli-Avella, Kumar Kandaswamy, Weiss, Köster, Marais, Paknia, Schröder, Garcia-Aznar, Werber, Brandau, Calvo Del Castillo, Baldi, Wessel, Kishore, Nahavandi, Eyaid, Al Rifai, Al-Rumayyan and Abou Jamra2017).
There is increasing overlap between CNVs detectable by chromosomal microarray and those identified using next generation sequencing technologies. Depending on platform and probe density, chromosomal microarray may detect CNVs as small as approximately 25–50 kb, whereas WES-based CNV analysis may identify variants involving only a small number of exons (Munté et al., Reference Munté, Roca, Del Valle, Feliubadaló, Pineda, Gel, Castellanos, Rivera, Cordero, Moreno, Lázaro and Moreno-Cabrera2024). Despite these technical advances, determining the clinical significance of identified CNVs remains challenging.
VUS increase demands on health system resources, complicate clinical decision making, and adversely affect patient experiences (Burke et al., Reference Burke, Parens, Chung, Berger and Appelbaum2022). A key challenge for clinicians is deciding whether to pursue further testing when a CNV VUS has already been identified. This study compares the diagnostic yield of WES in individuals with and without a CNV VUS and uses the observed difference to estimate the proportion of CNV VUS that may be pathogenic.
Materials and Methods
Clinical Context
Genetic Health Western Australia is a statewide service with a catchment of approximately 2.8 million people in 2022. The service provided approximately 3100 consultations during this period, excluding consultations through the familial cancer service. The paediatric and adult services had 6.8 full-time equivalent clinical geneticists and 2 FTE clinical genetics trainees in 2022. As all WES in the state were ordered through a single centralised genetics department, with regular multidisciplinary case review, case selection was standardised, minimising inter-clinician variability and reducing selection bias.
It was a mixed cohort, with phenotypes including neurodevelopmental diagnoses, congenital anomalies, dysmorphic features, and seizure disorders. All WES analyses in 2022 (n = 177) were performed by the PathWest Laboratory.
Ethics
This study was approved by the General Ethical and Knowledgeable Oversight (GEKO) committee under reference number 54221, with approval granted on 3 October 2024. All research procedures complied with GEKO’s ethical standards, including ensuring confidentiality and data protection.
Inclusion Criteria
This study included all individuals who had WES requested through Genetic Health Western Australia in the 12-month period of 2022. Of note, individuals seen through the service with findings on chromosomal microarray that sufficiently explained the phenotype would not have progressed to WES, and therefore are not included in this study.
Data Collection
Clinical information was collected from a spreadsheet that formed part of the clinical WES ordering process, including demographics and phenotypic information displayed as HPO terms. Phenotypic information was also drawn from review of medical records with results obtained from clinical test reports.
Test Methods
All chromosomal microarray reports retrospectively examined in this study were issued between 2017 and 2022 and were reviewed and updated for consistency with current reporting criteria as per ACMG/ClinGen and ACGS guidelines (Durkie et al., Reference Durkie, Cassidy, Berry, Owens, Turnbull, Scott, Taylor, Deans, Ellard, Baple and McMullan2024; Riggs et al., Reference Riggs, Andersen, Cherry, Kantarci, Kearney, Patel, Raca, Ritter, South, Thorland, Pineda-Alvarez, Aradhya and Martin2020). CNVs reported using GRCh37 genomic coordinates were converted to GRCh38 using UCSC liftover.
Whole genome SNP chromosomal microarray analysis was performed by one of three laboratories (PathWest, Western Diagnostic Pathology and QML Pathology) using one of the following platforms: Illumina HumanCytoSNP-12 BeadChip, Illumina GSAv2 plus Psych MD v1 array, or Affymetrix Cytoscan. Data were interpreted using either KaryoStudio software version 1.4, NxClinical software version 6.0 or Chromosome Analysis Suite (ChAS) software depending on the laboratory and timing of analysis. Reporting criteria included deletions >200kb and duplications >400kb or >500kb depending on the laboratory, with smaller CNVs reported if overlapping clinically relevant regions.
All WES reports examined in this study used the TWIST Exome Panel and TWIST EF Library prep kit. Massively parallel sequencing and primary analysis were performed on an Illumina NextSeq550 with High Output Kit v2.5. Secondary analyses were performed using DRAGEN Enrichment v3.6.3 with GRCh38 alignment. Tertiary analyses used Alissa Interpret v5.3 (Agilent Technologies) and associated annotation sources. Phenotype-driven single nucleotide variant analysis included filtering for all predicted nonsense, frameshift, splicing (+/−5 bases within the intron) variants or variants abolishing translation initiation or translation termination associating with ≥1 of the provided HPO terms; all variants reported as (likely) pathogenic in clinical databases associating with ≥1 of the provided HPO terms; and all other variants in a gene with autosomal recessive mode of inheritance where only a single (likely) pathogenic variant was detected through initial filtering. CNVs were identified with variable sensitivity via WES in 2022 and were generally limited to predominantly CNVs involving multiple exons in genes associating with the provided HPO terms. No CNVs previously identified by the SNP microarray were reported by WES.
Statistical Methods
Statistical analysis included descriptive and analytical methods. Fisher’s exact tests were used for yield comparison between groups; p values below .05 were considered significant.
Results
WES with HPO driven analysis was performed for 177 individuals who had had a preceding microarray in 2022. Individuals with a WES VUS were excluded from statistical analysis of WES yield (n = 5). Clinical data were available for all individuals.
Chromosomal Variants Preceding WES
Of the 177 individuals, 32 (18%) had had a reportable CNV identified on microarray. These included 4 (2%) that were classified as pathogenic or likely pathogenic and 28 (16%) that were classified as a VUS. In all CNVs, including the 4 pathogenic or likely pathogenic variants, the findings did not adequately explain the phenotype, prompting WES to be ordered by the clinical geneticist. One individual with a CNV went on to have a VUS identified on WES, and was excluded from further analysis as WES could not be considered diagnostic or otherwise.
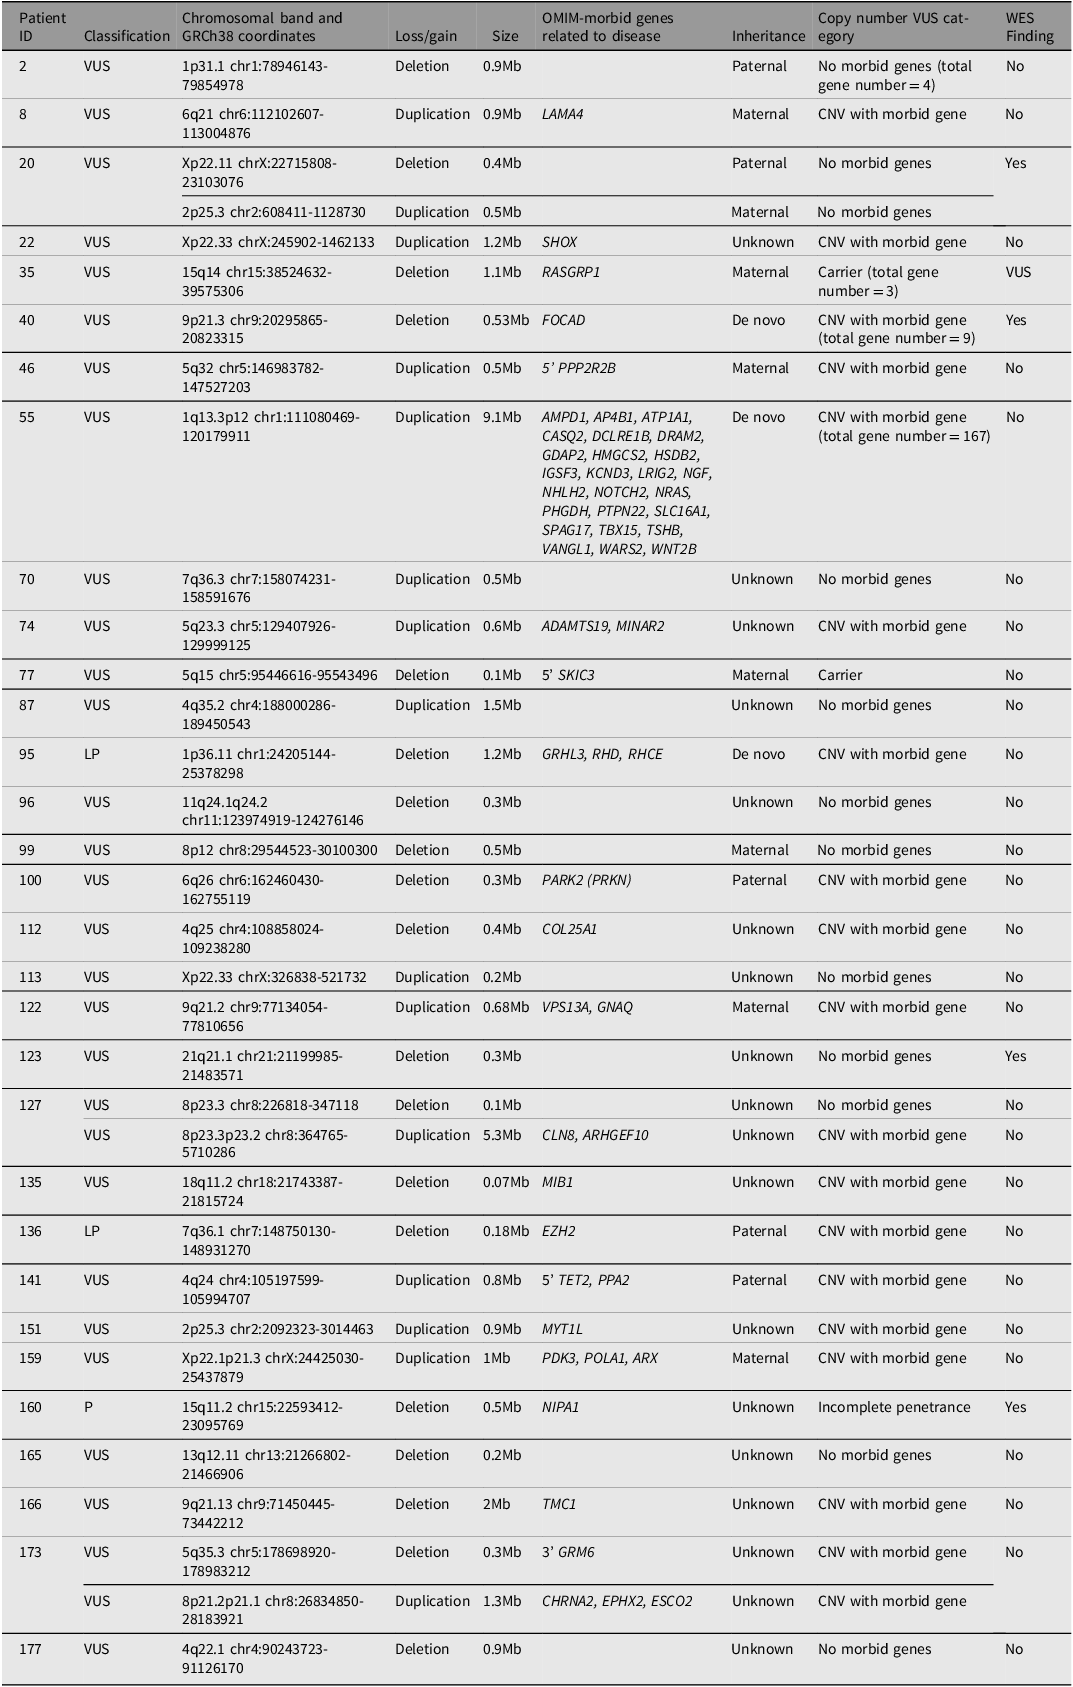
CNV VUS were classified into ‘CNV with OMIM-morbid gene/s’, ‘incomplete penetrance CNV’, ‘CNV involving no OMIM-morbid genes’, and ‘carrier status’. Of the 32 individuals with CNVs, 16 (50%) had deletions, 13 (41%) had duplications, including one individual with trisomy X, and 3 individuals had both a duplication and a deletion (9%) (Table 1).
Molecular characteristics of copy number variants

Table 1. Long description
The table presents data on chromosomal band and size of copy number variants (CNVs) in patients with various classifications. It includes 180 rows and 9 columns. The columns are labeled as follows: Patient, Classification, Chromosomal band and size of CNVs, OMIM morbid genes related to disease, Inheritance, Copy number VUS category, WES Finding. Each row lists specific details for each patient, including the patient number, classification (VUS, LP, P), chromosomal band and size of CNVs, OMIM morbid genes related to disease, inheritance type (Maternal, Paternal, De novo, Unknown), copy number VUS category (CNV with morbid gene, CNV no morbid gene, Carrier total gene number, Incomplete penetrance, No), and WES Finding (Yes, No). The table provides a comprehensive overview of the genetic variations and their characteristics in the studied patients.
Note: CNV, copy number variant; VUS, variants of uncertain significance; P, pathogenic; LP, likely pathogenic.
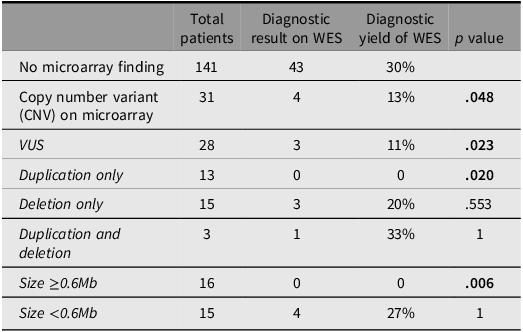
Diagnostic yield of whole exome sequencing (WES) across copy number variant groups

Table 2. Long description
The table has six columns and nine rows, including the header row. The columns are labeled ‘Total patients’, ‘Diagnostic result on WES’, ‘Diagnostic yield of WES’, and ‘p value’. The rows are labeled with different copy number variant groups: No microarray finding, Copy number variant (CNV) on microarray, VUS, Duplication only, Deletion only, Duplication and deletion, Size ≥0.6Mb, and Size <0.6Mb. Each row provides data on the total number of patients, diagnostic results on WES, diagnostic yield percentages, and p values. Notable trends include a higher diagnostic yield for the ‘No microarray finding’ group (30 percent) compared to the ‘Copy number variant (CNV) on microarray’ group (13 percent). The ‘Duplication only’ group shows a 0 percent diagnostic yield, while the ‘Deletion only’ group has a 20 percent yield. The ‘Size <0.6Mb’ group has a 27 percent yield. Statistically significant groups (p < 0.05) are indicated with bold text.
Note: Diagnostic rate of WES is influenced by factors relating to CNV. Fisher’s exact test was used due to small sample sizes n < 5. VUS, variants of uncertain significance. Bold text indicates statistically significant groups (p <.05)
Yield of Whole Exome Sequencing
With WES, a causative variant was identified in 47/177 (26%) individuals, no variant was identified in 125/177 (71%) individuals, and a WES variant of uncertain significance was identified in 5/177 (3%) individuals. Two individuals had multiple WES findings. One individual had dual WES findings of a pathogenic PACS1 variant and a likely pathogenic PAX3 variant, which explained their blended phenotype. One individual had a WES finding of homozygous pathogenic PLG variants considered an incidental finding not related to the phenotype as well as a VUS in CLTC, which was felt to fit the phenotype, but parental testing was unavailable so inheritance could not be confirmed.
Effect of CNV on WES Yield
In the cohort with a pre-existing CNV VUS, the yield of WES was significantly lower at 11%, compared to 30% in the cohort with no chromosomal microarray finding (p = .023). This indicates that a causative variant was less likely to be found on WES if a VUS had already been found on microarray. This suggests that the CNV VUS is the diagnostic answer some of the time.
Subset analysis demonstrated that none of the 13/28 individuals with an isolated CNV duplication had a diagnosis made on WES (p = .020). In contrast, 15/28 individuals had an isolated CNV deletion VUS, and of those, 3/15 (20%) had a causative finding on whole exome sequencing. Three of 31 individuals had both a CNV VUS deletion and duplication, with one receiving a WES diagnosis.
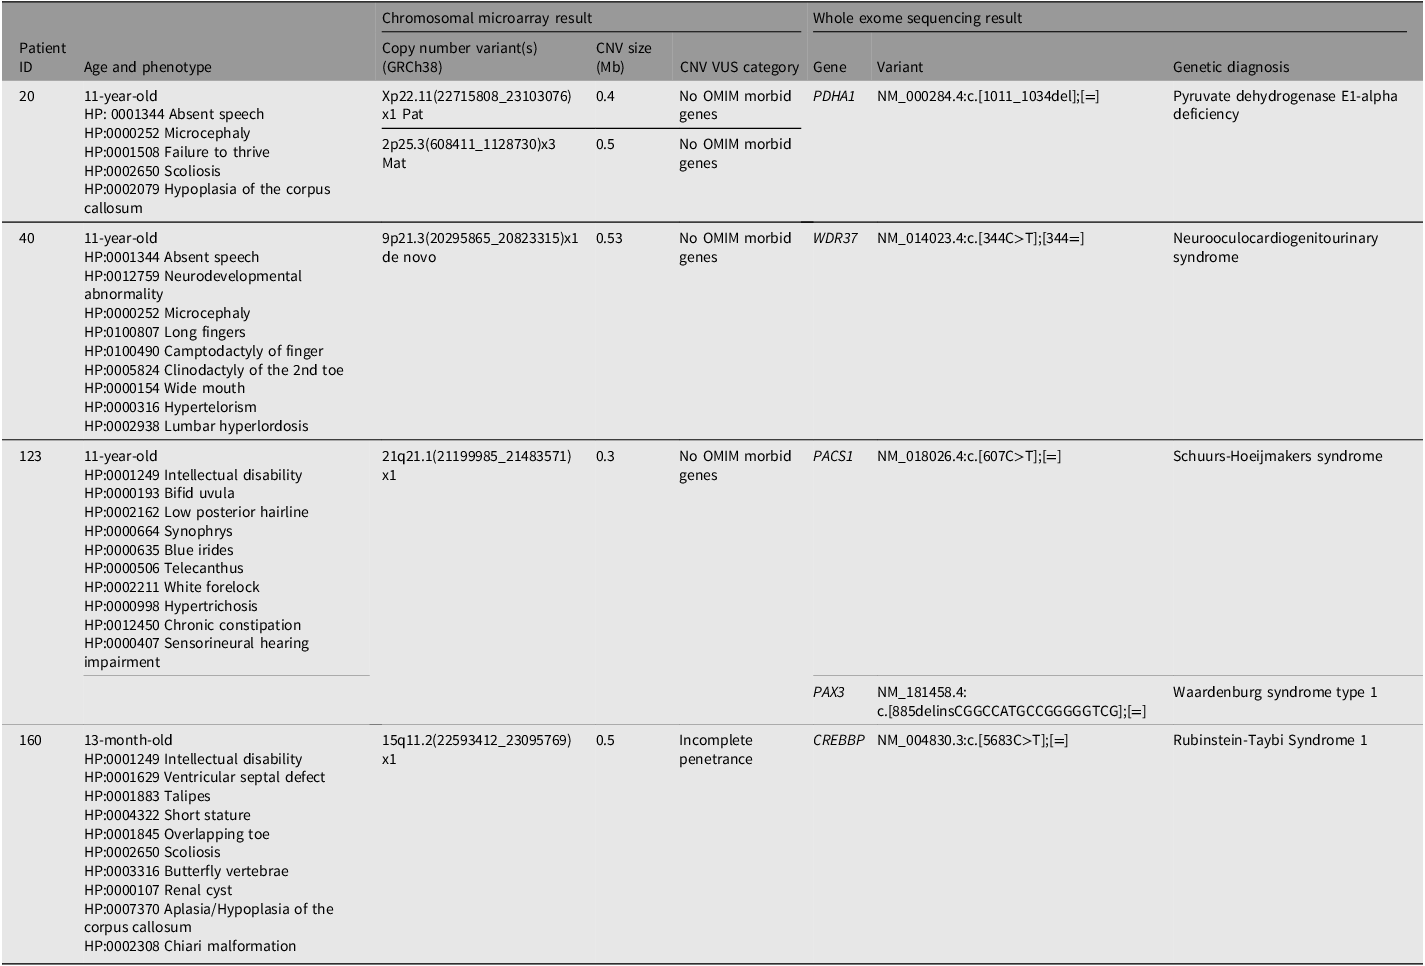
Four individuals (patient ID 20, 40, 123, 160) had both a reportable CNV and a likely pathogenic or pathogenic WES finding (Table 3). In all four, the exome finding fully explained their phenotype. One of these individuals (patient ID 160) carried a 15q11.2 deletion, which is a low penetrance pathogenic variant involving NIPA1. One deletion involved 5’ FOCAD, a gene associated with autosomal recessive severe congenital liver disease (patient 40). The other two carried deletions 0.53Mb or smaller that involved no known disease-causing genes. None of the 16 individuals with a CNV 0.6Mb or larger in this study received a WES diagnosis (p = .006).
Summary of findings in individuals with copy number findings and causative variant on whole exome sequencing

Table 3. Long description
The table presents data for four patients with both chromosomal microarray and whole exome sequencing results. It includes columns for Patient ID, Age and phenotype, Chromosomal microarray result with Copy number variant(s), CNV size, CNV VUS category, Whole exome sequencing result with Gene, Variant, and Genetic diagnosis. Patient 20 is an 11-year-old with various health conditions and has specific chromosomal variants and a genetic diagnosis of Pyruvate dehydrogenase E1-alpha deficiency. Patient 40, also 11 years old, has multiple developmental issues and a genetic diagnosis of Neurooculocardiogenitourinary syndrome. Patient 123, an 11-year-old with intellectual disability and other conditions, has a genetic diagnosis of Schuurs-Hoejmakers syndrome. Patient 160, a 13-month-old with intellectual disability and other health issues, has a genetic diagnosis of Rubinstein-Taybi Syndrome 1.
Note: All four individuals had a diagnosis made on whole exome sequencing (WES) that was felt to explain the phenotype, with the array detected copy number variant (CNV) not thought to contribute apart from individual 160 who was given dual diagnoses.
By comparing the diagnostic rate of WES in the reportable CNV findings group (4/31) with those in the no reportable CNV findings group (43/141), we can estimate the number of individuals with a CNV VUS for whom their genetic diagnosis is likely due to their CNV VUS (x). The relationship between groups can be expressed as 4/(31 − x) = 43/141. Rearranging yields a value for x of 17.9. Therefore, for 58% (17.9/31) of individuals with a CNV VUS, their genetic diagnosis likely lies with their CNV VUS. This calculation assumes patients only have one monogenic cause and is limited by the small study size. Larger studies would be required to provide higher accuracy and precision on the true proportion in the target population.
Discussion
The principal finding of this study is that individuals with a CNV VUS had a lower diagnostic yield from WES than individuals without a reportable CNV. The most probable explanation is that many CNV VUS already represent the underlying molecular diagnosis. By comparing diagnostic yields between groups, we estimate that approximately half of reportable CNV VUS may ultimately prove to be pathogenic.
Our study in a real-world clinical genetics environment with complete capture for an entire state in Australia in 2022 showed that 11% of individuals with a CNV VUS achieved a different molecular diagnosis through WES compared to 30% of individuals who did not have a CNV VUS. There is significant global research in identifying the missing diagnostic yield with WES or whole genome sequencing (WGS), and newer technologies are emerging to address this gap (Olivucci et al., Reference Olivucci, Iovino, Innella, Turchetti, Pippucci and Magini2024; Wojcik et al., Reference Wojcik, Lemire, Berger, Zaki, Wissmann, Win, White, Weisburd, Wieczorek, Waddell, Verboon, VanNoy, Töpf, Tan, Syrbe, Strehlow, Straub, Stenton, Snow and O’Donnell-Luria2024; Wojcik et al., Reference Wojcik, Reuter, Marwaha, Mahmoud, Duyzend, Barseghyan, Yuan, Boone, Groopman, Délot, Jain, Sanchis-Juan, Starita, Talkowski, Montgomery, Bamshad, Chong, Wheeler, Berger and Miller2023). Our data suggests that an overlooked source of this missing diagnostic yield could be a CNV VUS that has already been identified in a patient’s genomic data.
CNV Reporting and Reanalysis
Clinical interpretation of CNVs can be challenging when there are limited comparable cases with the same breakpoints in the literature and/or relevant databases and no knowledge of the genes or genomic region involved to guide the classification of pathogenicity. CNV interpretation and reporting discrepancies between laboratories are acknowledged, as there are no specific recommendations for CNV size cut-offs and the reporting criteria, particularly for CNV VUS differ, with some CNVs remaining unreported. Consensus recommendations of the American College of Medical Genetics and Genomics (ACMG) and the Clinical Genome Resource (ClinGen) encourages the use of a scoring system assigning a point value between –0.99 and 0.99 that correlates to a level of confidence of pathogenicity, with CNV VUS assigned a point score between –0.89 and 0.89 (Riggs et al., Reference Riggs, Andersen, Cherry, Kantarci, Kearney, Patel, Raca, Ritter, South, Thorland, Pineda-Alvarez, Aradhya and Martin2020). We propose that laboratories indicate tier in their report as this will aid clinicians to realise the level of suspicion attributed to a VUS. Some laboratories currently do this for single nucleotide variants of uncertain significance (Karbassi et al., Reference Karbassi, Maston, Love, DiVincenzo, Braastad, Elzinga, Bright, Previte, Zhang, Rowland, McCarthy, Lapierre, Dubois, Medeiros, Batish, Jones, Liaquat, Hoffman, Jaremko and Higgins2016).
Periodic re-evaluation of VUS to align with current knowledge is important as VUS may be reclassified in the future. Ravel et al. (Reference Ravel, Renaud, Muller, Becker, Renard, Remen, Lefort, Dexheimer, Jonveaux, Leheup, Bonnet and Lambert2023) performed reanalysis of 259 patients with CNV VUS and upgraded the classification to pathogenic or likely pathogenic in 3% and downgraded the classification to benign or likely benign in 30%. They found most CNVs reclassified as benign were <500kb and there was no relationship between CNV type (deletion or duplication) and reclassification (Ravel et al., Reference Ravel, Renaud, Muller, Becker, Renard, Remen, Lefort, Dexheimer, Jonveaux, Leheup, Bonnet and Lambert2023).
A Cohort of Interest: Duplications
In our cohort, all 13 individuals with isolated duplications identified on microarray remain undiagnosed following WES, a significant drop in yield compared to the subgroup of those with a CNV VUS or to the subgroup of those without CNV findings. Nine of these duplications were >500kb.
There are several ways in which duplications may be pathogenic. One possibility is if one or more genes contained within the duplication are triplosensitive. Triplosensitivity is not as easily demonstrated as haploinsufficiency, so duplications that are truly pathogenic may not be recognised and clinicians may proceed to WES, while pathogenic deletions may be more readily recognised and not proceed to WES, which would be consistent with this data. A second possibility might be a partial duplication-inversion of a gene, with the inversion not seen on chromosomal microarray (Newman et al., Reference Newman, Hermetz, Weckselblatt and Rudd2015) — this will cause haploinsufficiency of the gene. A third possibility may be to do with epigenetics and structural changes to histone modification and topology of the region with the extra chromosomal material by modifying topologically associated domains (Franke et al., Reference Franke, Ibrahim, Andrey, Schwarzer, Heinrich, Schöpflin, Kraft, Kempfer, Jerković, Chan, Spielmann, Timmermann, Wittler, Kurth, Cambiaso, Zuffardi, Houge, Lambie, Brancati and Mundlos2016; Lupiáñez et al., Reference Lupiáñez, Kraft, Heinrich, Krawitz, Brancati, Klopocki, Horn, Kayserili, Opitz, Laxova, Santos-Simarro, Gilbert-Dussardier, Wittler, Borschiwer, Haas, Osterwalder, Franke, Timmermann, Hecht and Mundlos2015; Newman et al., Reference Newman, Hermetz, Weckselblatt and Rudd2015). A fourth possibility might be an insertion of the duplication into or near the coding region for another gene on the same or different chromosome, disrupting the second gene’s transcription, start codon, or topologically-associated domain (Newman et al., Reference Newman, Hermetz, Weckselblatt and Rudd2015). Another possibility may involve an extra copy of regulatory elements or disruption of existing regulatory elements within the duplicated region.
Duplications may also lead to the creation of a fusion gene if reading frame and orientation are maintained (Newman et al., Reference Newman, Hermetz, Weckselblatt and Rudd2015). Fusion genes are well characterised in cancer genetics, and there is some evidence that they may have a role in neurodevelopmental disorders including ASD (Loi et al., Reference Loi, Moi, Blois, Bacchelli, Vega Benedetti, Cameli, Fadda, Maestrini, Carta, Doneddu and Zavattari2020; Mayo et al., Reference Mayo, Monfort, Roselló, Orellana, Oltra, Caro-Llopis and Martínez2017). Establishing the orientation and location of the duplication is important to understand the possible genetic consequence of the CNV.
Role of Other Methods in Clarification of CNV VUS
Given the resources and efforts underway to improve the missing diagnostic yield of exome and genome sequencing, improved methods and tools are needed to also address CNV VUS results.
Optical genome mapping (OGM) is a tool to assess structural variants (SVs) and their role in disease. OGM is able to analyse structural features of the genome at high resolution, using linearised strands of high molecular weight DNA, with average read lengths >200kbp (longer than most next generation sequencing techniques; Dremsek et al., Reference Dremsek, Schwarz, Weil, Malashka, Laccone and Neesen2021). This allows better mapping of repetitive and other complex regions, and the detection of CNVs and other SVs as small as 30kb (Dremsek et al., Reference Dremsek, Schwarz, Weil, Malashka, Laccone and Neesen2021). It is a tool that can uncover complex or balanced SVs not identified on chromosomal microarray or WGS (Lombardo et al., Reference Lombardo, Sinibaldi, Genovese, Catino, Mei, Pompili, Sallicandro, Falasca, Liambo, Faggiano, Roberti, Di Donato, Vitelli, Russo, Giannini, Micalizzi, Pietrafusa, Digilio, Novelli and Alesi2024; Rodriguez-Gil et al., Reference Rodriguez-Gil, Nagy and Francke2024) or provide valuable further information about SVs initially detected by other diagnostic means (Dremsek et al., Reference Dremsek, Schwarz, Weil, Malashka, Laccone and Neesen2021). In a study of 4577 molecularly characterised families, OGM was applied to selected negative cases and was helpful in identifying structural variants smaller than the detection limit of chromosomal microarray, and accounted for a molecular diagnosis in 2.7% of their cohort (AlAbdi et al., Reference AlAbdi, Maddirevula, Shamseldin, Khouj, Helaby, Hamid, Almulhim, Hashem, Abdulwahab, Abouyousef, Alqahtani, Altuwaijri, Jaafar, Alshidi, Alzahrani, Al-Sagheir, Mansour, Alawaji, Aldhilan and Mendeliome2023).
Long read sequencing provides another technology that may map complex SVs in a single read, and better allows CNV calling in complex and difficult to map genomic regions compared to short read or array data (Lavrichenko et al., Reference Lavrichenko, Johansson and Jonassen2021).
New research methods such as modelling CNVs in cellular models (Khan et al., Reference Khan, Revah, Gordon, Yoon, Krawisz, Goold, Sun, Kim, Tian, Li, Schaepe, Ikeda, Amin, Sakai, Yazawa, Kushan, Nishino, Porteus, Rapoport and Paşca2020), multi-omics (Seal et al., Reference Seal, Das, Goswami and De2020; Shao et al., Reference Shao, Lv, Liao, Long, Xue, Ai, Xu and Fan2019; Wang et al., Reference Wang, Han, Li, Hong, Xue, Huang, Du, Hou, Li, Li, Liao, Xie and Ding2021), machine learning (Asif et al., Reference Asif, Martiniano, Marques, Santos, Vilela, Rasga, Oliveira, Couto and Vicente2020; Schuetz et al., Reference Schuetz, Ceyhan, Antoniou, Chaudhari and White2024), ChIP-Seq and Hi-C sequencing (Servant et al., Reference Servant, Varoquaux, Heard, Barillot and Vert2018; Wang et al., Reference Wang, Sun, Liu, Chen, Chen, Ren, Lin, Hu, Jia, Xu, Xu, Liu, Li and Bo2024) have begun and in the future may form part of the toolkit available to better interpret and classify copy number VUS.
Conclusions and Clinical Recommendations
Clinical genetics professionals are familiar with the challenges of interpreting CNV VUS and deciding whether further testing is warranted. This study is the first to quantify the reduction in WES diagnostic yield associated with a pre-existing CNV VUS. Rather than viewing WES solely as a search for an alternative diagnosis, clinicians should also recognize that a negative WES result increases the likelihood that the original CNV VUS is clinically relevant. We do not suggest abandoning WES in this setting; instead, inconclusive exome results should prompt renewed consideration of the CNV VUS, ongoing reinterpretation, and, where appropriate, use of emerging technologies to better define its biological consequences.
Data availability statement
The data that support the findings of this study are available from the corresponding author, BK, upon reasonable request.
Acknowledgements
The authors acknowledge the clinicians and laboratory staff involved in providing the clinical care and laboratory processes throughout the year from which this data was derived.
Financial support
This research received no specific grant from any funding agency, commercial or not-for-profit sectors.
Competing interests
None

 Open access

