INTRODUCTION
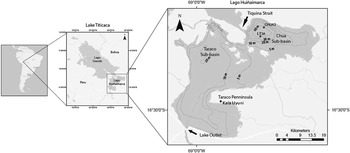
Lake Titicaca (Fig. 1), located ~3810 meters above sea level (m asl) in the Andean Altiplano, is the world’s highest navigable lake and has a long tradition of research into understanding its unique natural and cultural history. The physical, chemical, and biological characteristics of Lake Titicaca have been studied since D’Orbigny explored the area in the 1830s (see Dejoux and Iltis, Reference Dejoux and Iltis1992). Paleoenvironmental researchers have subsequently studied the lake deposits and their content, particularly in the smaller southern basin known as Lago Wiñaymarca, in order to reconstruct the lake’s hydrologic and ecological history and the climatic forces that influenced these variables (Abbott et al., Reference Abbott, Binford, Brenner and Kelts1997; Binford et al., Reference Binford, Kolata, Brenner, Janusek, Seddon, Abbott and Curtis1997; Mourguiart et al., Reference Mourguiart, Corrège, Wirrmann, Argollo, Montenegro, Pourchet and Carbonel1998). Although these data are important to paleoenvironmental scholars, the lake’s history, particularly during the mid- to late Holocene (Talbi et al., Reference Talbi, Coudrain, Ribstein and Pouyaud1999; Baker et al., Reference Baker, Seltzer, Fritz, Dunbar, Grove, Tapia, Cross, Rowe and Broda2001; Baker and Fritz, Reference Baker and Fritz2015), is also crucial for archaeologists who wish to understand the human-environmental interactions that shaped the development of human societies in this important region.
Map of Lago Wiñaymarca with locations of cores discussed in this study.

Previous collaborations between paleoclimatologists and archaeologists suggested a strong correlation between the rise and fall of human societies with fluctuations in the region’s climate and lake level. In particular, research conducted in the 1990s suggested a severe drought around 850 BP (AD 1100), accompanied by a subsequent reduction of lake level, resulted in the collapse of the Tiwanaku state (Binford et al., Reference Binford, Kolata, Brenner, Janusek, Seddon, Abbott and Curtis1997). Additionally, archaeologists have attempted to find links between lake-level shifts as presented in Abbott et al. (Reference Abbott, Binford, Brenner and Kelts1997) and changes in fishing practices (Moore et al., Reference Moore, Bruno, Capriles and Hastorf2010), trade networks (Bandy and Hastorf, Reference Bandy and Hastorf2007), and shifts in regional political configurations (Kolata, Reference Kolata1996; Stanish, Reference Stanish2003). These correlations remain tenuous, however, and have been criticized, in part based on the known resilience of local inhabitants to adjust their farming, herding, and fishing practices in relation to changes in climate and lake level (Erickson, Reference Erickson1999; Bruno, Reference Bruno2008; Capriles et al., Reference Capriles, Moore, Domic and Hastorf2014). Additionally, there remain serious challenges in correlating paleoclimatic and archaeological records because of differences in the nature of the respective deposits, as well as their temporal resolutions. Available paleoenvironmental data have been at a much lower temporal resolution than the archaeological record (millennial and century scale vs. multidecadal scale). Lake-level histories are based on radiocarbon-dated unconformities that are of uncertain duration and may not represent a complete history. Thus, it is necessary for paleoclimatologists and archaeologists to continue working together to refine their data sets for comparison before conclusions can be drawn about the impact of local climate change on human communities in the Lake Titicaca basin during the late Holocene. Toward this end, we present here a revised and refined lake-level history of Lago Wiñaymarca from fossil diatoms in sediment cores at a higher temporal resolution than earlier studies. This provides a more fine-grained chronological and ecological history that both paleoclimatologists and archaeologists can utilize to better understand the timing and extent of climatic and environmental pressures faced by the ancient inhabitants over the last ~6000 cal yr BP.
SITE LOCATION AND GEOGRAPHY
Lake Titicaca is located in the Altiplano, a high-altitude internally drained basin between the Cordillera Occidental and the Cordillera Oriental in the tropical Andes. The Altiplano has a tropical subalpine climate, with a rainy season between November and March, with more moderate temperatures than the dry season (April–October) (Boulange and Aquize Jaen, Reference Boulange and Aquize Jaen1981). Lake Titicaca (16°S, 69°W) has two basins: the larger, northern Lago Chucuito (7131 km2, maximum depth 284 m, mean depth 125 m; also called Lago Grande) and the smaller, southern Lago Wiñaymarca (1428 km2, maximum depth 42 m, mean depth 9 m; also called Lago Menor, Lago Pequeño, and Lago Huiñaimarca). The Tiquina Strait (~850 m wide and ~20 m depth below outlet level) connects the two basins. Thus, a decrease of >20 m in lake level will separate the northern and southern basins of the lake (Wirrmann et al., Reference Wirrmann, Ybert and Mourguiart1992). The lake outflow is via the Rio Desaguadero (sill elevation of 3804 m asl) on the southwestern shore of Lago Wiñaymarca (Roche et al., Reference Roche, Bourges, Cortes and Mattos1992).
River and stream input via the Rio Ilave, Rio Suchez, Rio Ramis, Rio Coata, Rio Huancané, and Rio Catari accounts for ~53% of the hydrologic input in the basin, whereas direct precipitation onto the lake accounts for ~47%. Evaporation accounts for the majority of output (~90%), with <10% output via the Rio Desaguadero (Roche et al., Reference Roche, Bourges, Cortes and Mattos1992). During the last century, annual fluctuations in lake level were typically ~60–80 cm; however, larger long-term declines in lake level have been recorded. For example, between 1914 and 1989, lake level fluctuated by a total of 6.37 m (Roche et al., Reference Roche, Bourges, Cortes and Mattos1992). The modern lakes are moderately saline, with an average salinity of ~0.9 g/L in Lago Chucuito and 1.2 g/L in Lago Wiñaymarca (Wirrmann and Mourguiart, Reference Wirrmann and Mourguiart1995).
Lago Wiñaymarca (Fig. 1) has two subbasins, and more than 70% of its area is presently less than 10 m deep (Binford et al., Reference Binford, Kolata, Brenner, Janusek, Seddon, Abbott and Curtis1997). The two subbasins are separated by a broad sill that is approximately 7 m below current lake level (Wirrmann, Reference Wirrmann1992). As such, a drop of ~7 m will result in these subbasins becoming separated. The northeastern Chua subbasin is smaller but deeper (maximum depth 42 m) and is directly connected to the Tiquina Strait. The western Taraco subbasin, adjacent to the Taraco Peninsula, is much shallower and wider than the Chua subbasin (maximum depth 20 m) (Wirrmann, Reference Wirrmann1992). It is connected directly to the outlet at the Rio Desaguadero in the south.
The gradual slopes that dominate Lago Wiñaymarca’s bathymetry result in large areas of land being exposed or waterlogged with moderately small fluctuations in lake level. This can have marked effects on both aquatic biota and human activities in the area. Approximately 58% of Lago Wiñaymarca presently is covered in macrophytes, and both the biological and physical properties of these large littoral areas can influence sediment distribution. Extensive shallow shelves on the southern edge provide a large area for organisms that require shallow water, including benthic diatom species and many macrophytes, and provide habitat for fish nurseries. Lake-level decline sufficient to expose the lake floor produces land that can be used for agriculture and pastoralism by local inhabitants, while subsequently decreasing habitat for aquatic species. As lake levels rise and inundate shoreline regions, soils become waterlogged, and cultivation and grazing adjacent to the lake cannot occur.
METHODS
Core material
Two cores were analyzed for diatom species abundance (Fig. 1). LT01-3A was recovered from Lago Wiñaymarca in 2001 using the GLAD 800 drilling platform and coring system at a water depth of ~39 m (Fig. 1, LT3A; Fritz et al., Reference Fritz, Baker, Seltzer, Ballantyne, Tapia, Cheng and Edwards2007). We analyzed the top ~2.0 m (100–290 cm, ~1100–4600 cal yr BP) of this core. The upper portion of the sedimentary record was not recovered during drilling; thus, a short gravity core was recovered at ~40 m depth from the Chua subbasin (CHUA3) in January 2014 to obtain a complete sequence that spanned the entire mid- to late Holocene. CHUA3 and LT01-3A were correlated with each other based on similarity in diatom species abundances, and a composite core sequence was developed.
Diatom analysis
Relative diatom species abundance in the cores was quantified using 0.5 cm continuous samples from LT01-3A and 1 cm continuous samples from CHUA3 through the entire core lengths. All samples were digested using 10% HCl for carbonate removal and 30% H2O2 to remove organics. The samples were rinsed with deionized water to remove chemical by-products. The resulting diatom suspension was spiked with calibrated microspheres, dried onto coverslips, and mounted on slides using Naphrax (Refractive Index [RI]=1.74).
Diatom identification took place using a LEICA microscope fitted with a 100× Phase contrast (Numerical aperture [N.A.]=1.40) oil immersion objective lens. At least 300 diatom valves were counted per slide, and species abundance is expressed as a percentage of the total valves counted for each slide. Concentration is expressed as the number of valves per gram of sediment using procedures outlined in Battarbee and Keen (Reference Battarbee and Keen1982). Diatom species were identified to the highest taxonomic level possible using a range of floras, including Krammer and Lange-Bertalot’s Susswasserflora von Mitteleuropa (1986) and supplemented by regional floras (Metzeltin and Lange-Bertalot, Reference Metzeltin and Lange-Bertalot1998, Reference Metzeltin and Lange-Bertalot2007; Metzeltin et al., Reference Metzeltin, Lange-Bertalot and Garcia-Rodriguez2005) and other published literature, as cited. The ecological preferences of species are based on previous studies of Lake Titicaca (Servant-Vildary and Roux, Reference Servant-Vildary and Roux1990; Servant-Vildary, Reference Servant-Vildary1992; Sylvestre, Reference Sylvestre2002; Tapia et al., Reference Tapia, Fritz, Baker, Seltzer and Dunbar2003; Fritz et al., Reference Fritz, Baker, Tapia, Spanbauer and Westover2012), the Identification Guide and Ecological Resource for Diatoms of the United States (http://westerndiatoms.colorado.edu/), and the previously mentioned floras. Species were placed into the following ecological groups: freshwater planktic (Cyclostephanos andinus, Discostella stelligera, and Fragilaria crotonensis), oligosaline planktic (Cyclotella meneghiniana), epiphytic (Cocconeis spp.), saline (Chaetoceros spp. and Fragilaria zeilleri), and benthic (Nitzschia denticula, Epithemia spp., and other common and rare benthic species). Diatom assemblage zones were assigned using constrained cluster analysis in PAST (Hammer et al., Reference Hammer, Harper and Ryan2001) with the single linkage algorithm and the correlation similarity measure. All species, dominant and rare, were used in this analysis.
Age models
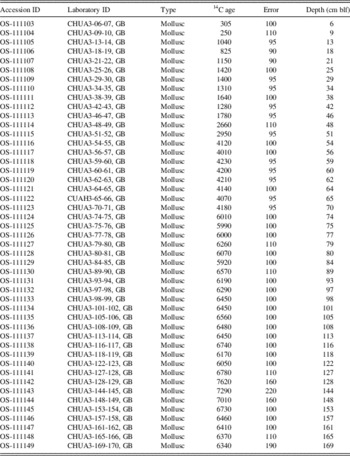
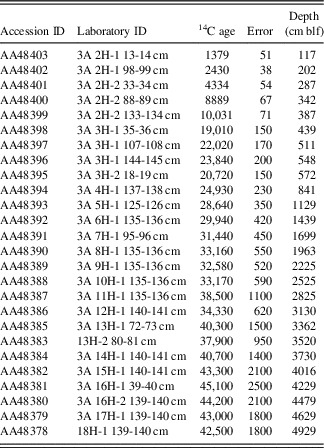
All dates were calibrated for Southern Hemisphere terrestrial archives using the SHCal13 calibration curve (Hogg et al., Reference Hogg, Hua, Blackwell, Niu, Buck, Guilderson and Heaton2013), with a 250 yr reservoir effect for Lago Wiñaymarca as Abbott et al. (Reference Abbott, Binford, Brenner and Kelts1997) had used. Using both aquatic and atmospheric sources, Abbott and colleagues (Reference Abbott, Binford, Brenner and Kelts1997) determined that the ~250 yr 14C reservoir age remained nearly constant throughout the late Holocene. The age models for CHUA3 and LT01-3A (Tables 1 and 2) were made using Bayesian analysis in Bacon (version 2.2; Blaauw and Christen, Reference Blaauw and Christen2011). For core CHUA3, 49 radiocarbon measurements were made by use of gas ion source accelerator mass spectrometry on biogenic carbonate, at Woods Hole Oceanographic Institution’s National Ocean Sciences Accelerator Mass Spectrometry facility, predominantly derived from aquatic gastropods, such as Littoridina sp. Sampling intervals for the radiocarbon dates were chosen to optimally constrain all observed lithologic changes in the core, with a resulting sampling density averaging one datum every ~3.5 cm. Abrupt changes in lithology or color and concomitant jumps in radiocarbon age were interpreted as indicative of disconformities or depositional hiatuses, allowing for the identification of three such horizons in the CHUA3 core at depths of 73 cm, 54 cm, and 47 cm. The duration of the three hiatuses was estimated from the temporal gap between radiocarbon dates and set at 1800, 1000, and 500 yr, respectively. Initial sediment accumulation rates were then calculated for each uninterrupted period of sedimentation by linear interpolation between the youngest and oldest date for each segment and were used as prior information for Bayesian analysis. The shape of the sedimentation rate distribution was set for the first 55 cm (acc.shape=2) and was slightly constrained below 55 cm to improve model performance because of several outliers. Thickness of each calculated section for Bayesian analysis was set to 4 cm, approximating the ~3.5 cm per datum density of the radiocarbon dates.
Radiocarbon dates for CHUA3. cm blf, centimeters below lake floor.

Radiocarbon samples from LT01-3A. All samples are bulk sediment. cm blf, centimeters below lake floor.

LT01-3A had 26 radiocarbon measurements taken from bulk sediment (Table 2). An age model was developed using Bacon 2.2. The mean value for cal yr BP provided by Bacon was then applied to the composite core samples. Core unconformities at 390 cm, 344 cm, and 289 cm were run as hiatuses, each with a mean of 500 yr.
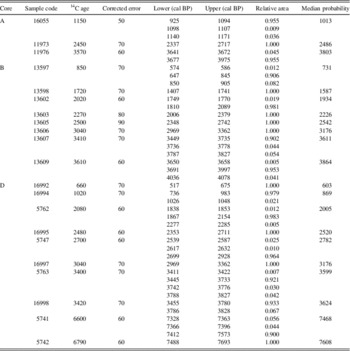
Radiocarbon dates for the erosional surfaces published in Abbott et al. (Reference Abbott, Binford, Brenner and Kelts1997; Fig. 2) were recalibrated using Calib 7.0.4 (Stuiver and Reimer, Reference Stuiver and Reimer1986; Reimer et al., Reference Reimer, Bard, Bayliss, Beck, Blackwell, Ramsey, Buck, Cheng, Edwards and Friedrich2013) in order to assure that the most recent calibration curve (SHCal13) was used for all dates (Table 3) and that patterns are comparable to the cores reported here. The 2-sigma mean probability cal yr BP date provided by Calib 7.0.4 was used, and, when compared directly to the current diatom assemblage zones, rounded to the nearest decade. Dates for the NE98-1PC core published in Tapia et al. (Reference Tapia, Fritz, Baker, Seltzer and Dunbar2003) were also recalibrated using Calib 7.0.4 and SHCal13.
Radiocarbon dates from gastropod shells published in Abbott et al. (Reference Abbott, Binford, Brenner and Kelts1997). Recalibrated with 250 yr reservoir age using Calib 7.0.4, reporting 2-sigma only.

RESULTS
Core lithostratigraphy
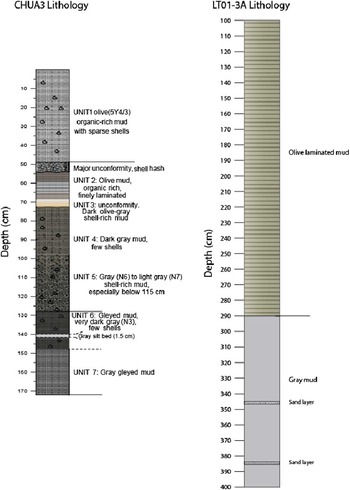
The CHUA3 core has a total length of 172 cm and is mostly organic-rich olive and gray mud with seven identifiable units (Fig. 2). Unit 7 (148–172 cm) is gray gleyed mud with no shells. Unit 6 (128–148 cm) is very dark-gray gleyed mud, with sparse shells and a gray silty bed ~3.5 cm thick. Unit 5 (98–128 cm) consists of a gray/light-gray mud, with abundant shells, especially below 115 cm. Unit 4 (80–98 cm) is a dark-gray mud, with only a few shells scattered throughout. Unit 3 (75–80 cm) is a relatively thin layer of dark-olive-gray shell-rich mud. Unit 2 (65–75 cm) is a finely laminated, organic-rich olive mud. A 5-cm-thick shell hash lag deposit, representing an unconformity (60–65 cm) separates unit 2 and unit 1. Unit 1 (0–46 cm) is an olive organic-rich mud with sparse shells throughout.
(color online) Lithologic column of CHUA3 and LT01-3A. The upper meter of the LT01-3A core was not recovered. Only the upper 290 cm of the LT01-3A core was analyzed for diatoms.

LT01-3A was drilled to a maximum depth of 123 m below lake floor and spans ~150,000 cal yr BP. Two lithologic units (Fig. 2) are identified for the sections examined for this study. Unit 1, an olive laminated mud (289–103 cm), has higher total organic carbon and lower magnetic susceptibility relative to unit 2, a gray mud (400–289 cm). These units and their characteristics are similar to those described in core LT01-2B recovered from Lago Chucuito (Fritz et al., Reference Fritz, Baker, Seltzer, Ballantyne, Tapia, Cheng and Edwards2007). Sand layers at 344 cm and 384 cm and at the boundary between units 1 and 2 were treated as stratigraphic discontinuities and time hiatuses for the age model.
Age model
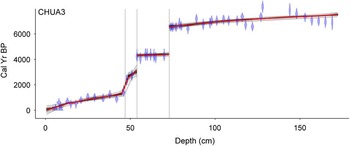
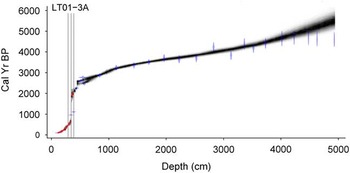
The CHUA3 age model shows a highly variable sediment accumulation rate, ranging from 10 to >1000 yr/cm (Fig. 3), with very high sediment accumulation rates at the base of the core (106–172 cm) and an unconformity represented by the shell lag between 50 and 55 cm. Dates for LT01-3A were run with default values, and the model was modified until the model with the best 95% confidence interval was found (acc.mean=10, acc.shape=1.5, mem.mean=0.7, mem.strength=4, hiatus.depths=c[390, 344, 290], hiatus.mean=500, hiatus.shape=1). The best age model for LT01-3A (Fig. 4) suggests a sedimentation rate that varies between ~10 and ~140 yr/cm without a notable change in lithology. Thus, LT01-3A has a higher average sedimentation rate than CHUA3.
CHUA3 age model. The main graph shows the calibrated 14C dates (blue shaded shapes). The dark-gray shading is the age model, with the red line highlighting the best model. (For interpretation of the references to color in this figure legend, the reader is referred to the web version of this article.)

Selected Bacon age model for LT01-3A. This graph shows the calibrated 14C dates (blue shaded shapes). The dark-gray shading is the age model, with the red line highlighting the best-fit model. (For interpretation of the references to color in this figure legend, the reader is referred to the web version of this article.)

Using erosional surfaces as indicators of low lake levels, Abbott et al. (Reference Abbott, Binford, Brenner and Kelts1997) recorded five low stands of Lago Wiñaymarca: >3500 cal yr BP, 2900–2800 cal yr BP, 2400–2200 cal yr BP, 1900–1700 cal yr BP, and 900–500 cal yr BP (published dates). Recalibrated ages of the Abbott et al. (Reference Abbott, Binford, Brenner and Kelts1997) erosional surfaces (Table 3) suggest older ages than published for these dated materials, in some cases several centuries earlier. Comparisons reveal some consistencies in periods of lower lake levels, but recalibration modifies the duration as suggested by the erosional surfaces; whereas the diatoms complicate that picture by revealing fluctuations that are erased by the low-stand record. The duration of our low-stand intervals are similar to the original suggestions by Abbott et al. (Reference Abbott, Binford, Brenner and Kelts1997) along with the recalibrated ages, with the exception of the most recent low stand, which lasted ~800 cal yr using our recalibrated dates versus 400 cal yr in the original formulation.
Core correlation
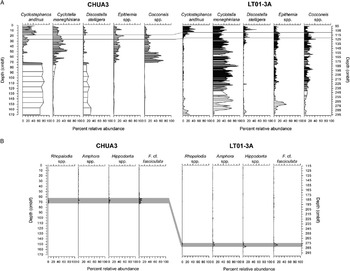
Diatom species abundance in the CHUA-3 and LT01-3A cores were compared, and the following features were used to establish a correlation between the two cores: (1) Cocconeis spp. and Epithemia spp. in LT01-3A show a marked decrease in abundance relative to samples below, beginning at 110 cm depth, which is correlated with the marked decrease in these species in CHUA3 at 17 cm (Fig. 5A). (2) Both cores also show the onset of decreased abundance in C. andinus and in D. stelligera at these same depths (Fig. 5A). (3) Peaks in the LT01-3A core of Amphora spp. and Hippodonta spp. at 278 cm and 281 cm, respectively, coincide with similar features in these species at 60 cm in CHUA3 (Fig. 5B). This level, in both cores, also has peaks of the rare taxa Gomphonema spp., Luticola spp., Rhopalodia spp., and Fragilaria fasciculata.
Comparison of common dominant species in the top (A) and bottom (B) sections of both CHUA3 and LT01-3A to illustrate diatom-based tie points. cm blf, centimeters below lake floor.

LT01-3A has a marked decrease in C. andinus at ~125 cm, which is similar to the trend in the CHUA3 cores at ~25 cm (Fig. 5A). Decreased abundances of similar magnitude in Epithemia spp. and Cocconeis spp. (Fig. 5A) are also evident in both cores at 125 cm and 25 cm, respectively. Because of the limitations of the age model, specifically that there are no radiocarbon dates above 117 cm in LT01-3A, a composite core sequence was produced by applying ties between the following levels: CHUA3 0–25 cm, LT01-3A 125–289 cm, and CHUA3 59–172 cm. Because of differences in sediment accumulation rates between the two cores, the sedimentation rate appears to slow down where the cores are joined. The following diatom analysis and reconstruction uses this composite core.
Diatom analysis
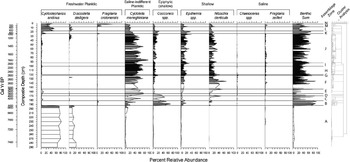
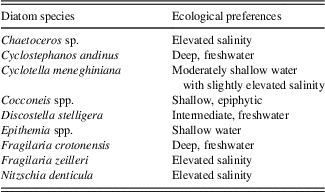
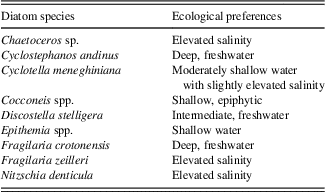
Constrained cluster analysis of 47 diatom taxa observed in the composite core resulted in 14 distinct zones (Fig. 6, right side, labelled A–N), with 40 of the taxa occurring as minor taxa (<10%). Throughout the core, seven dominant species or groups make up the majority of the flora: C. andinus, C. meneghiniana, D. stelligera, F. crotonensis, N. denticula, Epithemia spp., and Cocconeis spp. (mostly C. placentula). Table 4 summarizes the ecological preferences of the dominant species.
Species abundance with cluster analysis and zonation.

Ecological preferences of dominant diatoms observed in Lago Wiñaymarca, based on data from Tapia et al. (Reference Tapia, Fritz, Baker, Seltzer and Dunbar2003).
Zone A (290–193.0 cm) is dominated by the freshwater planktic species C. andinus and D. stelligera, with little variability. Together, they comprise ~90% of the diatom flora in this zone. The remaining ~10% is composed of C. meneghiniana and benthic species.
Zone B (193.0–180.5 cm) is dominated by benthic species, including Epithemia spp. and Nitzschia spp., as well as high abundances of the epiphytic genus Cocconeis. C. meneghiniana is also a major component of this zone and becomes one of the dominant species near the top of the zone. C. andinus and D. stelligera appear but are rare to absent.
Zone C (180.5–170.5 cm) continues to be dominated by C. meneghiniana and moderate abundances of benthic species, including Cocconeis spp., N. denticula, and Epithemia spp. At the bottom of this zone, the freshwater planktic diatoms C. andinus and D. stelligera appear but remain uncommon.
Zone D (170.5–165.0 cm) shows a slight decrease in Cocconeis, but it is still the dominant species throughout most of the zone. N. denticula increases in abundance and is the dominant taxon at the top. Epithemia spp. are less than 10% of the flora, C. meneghiniana is less than 20%, and C. andinus and D. stelligera are rare to absent.
Zone E (165.0–154.5 cm) is marked by an increase in all the planktic species, with C. meneghiniana dominating the zone. Abundance of C. andinus and D. stelligera remains less than 15%. Cocconeis declines sharply at the bottom of this zone and remains low throughout the remainder of this interval. Epithemia spp. increase steadily, and N. denticula increases sharply to become the dominant species at the top of the interval.
Zone F (154.5–121.5 cm) is unique in that it is dominated by both C. meneghiniana and N. denticula throughout the zone. C. andinus and D. stelligera remain rare to absent. Cocconeis is absent at the bottom of the zone but increases slightly toward the top. Epithemia spp. remain relatively constant throughout. In the middle of this zone, a peak of F. zeilleri (~12%) occurs.
Zone G (121.5–120.0 cm) is very similar to zone F. C. meneghiniana remains dominant, although it decreases slightly in the middle of this zone. C. andinus remains rare. Cocconeis increases then decreases, whereas Epithemia remains stable relative to the previous zone. N. denticula decreased from zone E but remains the most abundant benthic group. This group assemblage looks very similar to the previous zone, but Chaetoceros has a small spike of about 6% and subsequently is absent.
Zone H (120.0–100.5 cm) is dominated by C. meneghiniana, with abundance of up to 80%. The abundances of C. andinus and D. stelligera remain low in this zone. Epithemia spp. are stable across the boundary of zones F and G but then decrease slightly midway through the zone. N. denticula continues to dominate the benthic flora.
Zone I (100.5–92.5 cm) is distinguished by a decrease in C. meneghiniana, which is replaced with an increase in Epithemia spp. and Gomphonema spp. C. andinus and D. stelligera remain rare.
Zone J (92.5–24 cm) is still dominated by C. meneghiniana, which fluctuates in abundance throughout this zone, with a slight overall decrease from bottom to top. D. stelligera is initially rare, but, in the top ~10 cm of the zone, it increases to 20% abundance. N. denticula and Epithemia dominate the benthic flora, with Cocconeis also contributing ~15%. F. zeilleri and Fragilaria spp. are a larger component than previously, contributing ~8%. This shift is concurrent with a slight decrease in C. meneghiniana. Approximately one-third of the way into the zone, their abundance drops back to <3%, and C. meneghiniana increases again.
Zone K (24–18 cm) is dominated by C. meneghiniana and benthic species, with Epithemia as the most abundant of the benthic species. D. stelligera is a small part of the assemblage; C. andinus is common at the bottom of this zone but decreases significantly near the top. F. crotonensis is common at the bottom of the zone but disappears up-section.
Zone L (18–7 cm) is remarkable for the large increase (almost doubling) of C. andinus, which peaks in this zone. D. stelligera also increases, along with a concomitant decrease in C. meneghiniana. All three major benthic species decrease, although Epithemia spp. and N. denticula increase at the top of this zone. F. zeilleri also increases about halfway up the zone.
Zone M (7–2 cm) continues to be dominated by C. andinus, although it has decreased relative to its abundance in zone E. C. meneghiniana remains a large component of the flora but begins to decrease near the top boundary. D. stelligera’s numbers decreased again, but F. crotonensis appears near the onset of this zone, with percent abundances of up to ~20%. Cocconeis, Epithemia spp., and N. denticula decrease steadily over this period, and Cocconeis abundance remains low. F. zeilleri, a saline species, peaks through this zone.
Zone N (2–0 cm) is dominated by freshwater planktic species C. andinus and F. crotonensis. C. andinus remains relatively stable relative to the previous zone, but F. crotonensis comprises up to 50% of the individuals. C. meneghiniana, D. stelligera, and all benthic taxa decrease to less than 10% each.
DISCUSSION
Diatom stratigraphy and inferred limnological variation
Prior research has suggested that during the mid-Holocene (~8500–4500 cal yr BP), the water level in Lago Wiñaymarca was very low, much of the basin was completely dry, and it was isolated from Lago Chucuito (Wirrmann and De Oliveira Almeida, Reference Wirrmann and De Oliveira Almeida1987; Wirrmann et al., Reference Wirrmann, Mourguiart and de Oliveira Almeida1988; Binford et al., Reference Binford, Kolata, Brenner, Janusek, Seddon, Abbott and Curtis1997; Cross et al., Reference Cross, Baker, Seltzer, Fritz and Dunbar2000, Reference Cross, Baker, Seltzer, Fritz and Dunbar2001; D’Agostino et al., Reference D’Agostino, Seltzer, Baker, Fritz and Dunbar2002). This middle Holocene dry period was interrupted by a wet interval (~7100–6900 cal yr BP), as indicated by high abundances of freshwater planktic diatoms in sediments of the large northern basin of the lake (Baker et al., Reference Baker, Seltzer, Fritz, Dunbar, Grove, Tapia, Cross, Rowe and Broda2001; Tapia et al., Reference Tapia, Fritz, Baker, Seltzer and Dunbar2003). This period corresponds to the majority of zone A in the cores studied here, which also are dominated by freshwater planktic species, indicative of moderately high lake levels. In the Lago Wiñaymarca cores, the top of zone A is dated to ~4400 cal yr BP, and the sedimentation patterns and lithology in the CHUA3 core (unconformity at 72 cm) suggest a hiatus in sediment deposition spanning ~6500–4400 cal yr BP, indicative of dry conditions at the core site.
As the climate became wetter around 4400 cal yr BP, the lake level rose in Lago Chucuito, and it overflowed via the Tiquina Strait and into the Chua depression in Lago Wiñaymarca (Abbott et al., Reference Abbott, Binford, Brenner and Kelts1997; Baker et al., Reference Baker, Seltzer, Fritz, Dunbar, Grove, Tapia, Cross, Rowe and Broda2001). The Chua subbasin, because it is proximal to the strait and very deep, likely would have filled with water earlier than other areas of Lago Wiñaymarca. Sedimentation in the Chua basin cores resumed at ~4400 cal yr BP, which is included as the uppermost part of diatom zone A and is dominated by C. andinus and D. stelligera. Two explanations are possible for the dominance of freshwater planktic diatoms at this time. One is that the diatom valves were carried in from the main basin via overflow through the Tiquina Strait, but this is not supported by the flora at this time in the large lake, which was dominated by C. meneghiniana (Tapia et al., Reference Tapia, Fritz, Baker, Seltzer and Dunbar2003). A more likely explanation is that only the small deep 40 m depression of the Chua basin, where the cores were taken, was flooded at this time. Because the Chua basin is steep sided, it does not contain shallow habitat suitable for benthic diatoms, hence the dominance by planktic species.
Starting at 4300 cal yr BP (zone B, ~192 cm depth in Fig. 6), freshwater planktic species were replaced initially by benthic taxa, especially shallow epiphytic species (Cocconeis spp.), as other parts of the small lake continued to fill via increased precipitation and overflow from Lago Grande and as these shallow-water taxa were washed into the Chua depression. The high abundance of Cocconeis spp. suggests that Lago Wiñaymarca was initially quite shallow, with extensive areas covered by macrophytes.
At about this same time, C. meneghiniana also started to increase in abundance. C. meneghiniana is a salinity-indifferent planktic diatom that can grow in a wide range of conditions but in Lake Titicaca is indicative of moderately shallow waters with somewhat elevated salinity (Tapia et al., Reference Tapia, Fritz, Baker, Seltzer and Dunbar2003). For a brief period of about 50 yr (~4380–4330 cal yr BP, 191–181 cm depth), C. meneghiniana co-occurred with small spikes in the freshwater taxon F. crotonensis, followed by an increase in C. andinus abundance and a slight increase in D. stelligera, trends that suggest brief intervals when conditions may have been slightly deeper (increased F. crotonensis and C. andinus) in Lago Wiñaymarca alternating with slightly shallower conditions (C. meneghiniana dominated).
A subsequent loss of the freshwater planktic species at ~4150 cal yr BP (~175 cm depth, zone C) suggests a modest lake-level decline, followed by a further decrease in lake level at ~3960 cal yr BP (~170 cm depth, zone D) as indicated by a brief shift from C. meneghiniana to N. denticula, which is adapted to saline conditions. Continued low lake level and the expansion of macrophytes are indicated by the increased abundances of the epiphyte Cocconeis until ~3770 cal yr BP (~164.5 cm depth). In general, the very slow sediment accumulation rates from 4400 until ~3100 cal yr BP (~193–149 cm depth), along with the composition of the diatom flora, suggest a very shallow lake overall, but with fluctuating lake depth, with somewhat deeper conditions during dominance of C. meneghiniana and shallower conditions when benthic and epiphytic species are more common.
The next ~2 ka (~3100–1100 cal yr BP, ~149–25.5 cm depth) show shifts between C. meneghiniana and major benthic species, which suggests fluctuating lake levels. For example, at approximately 2560 cal yr BP (~120.5 cm depth, zone G) a slight increase in N. denticula and Cocconeis abundances occurred, together with decreased C. meneghiniana and an increase in Chaetoceros sp., which increases from absent to 6% at this time. Chaetoceros sp. is an obligate saline planktic diatom and indicative of elevated salinity (>2 g/L) and very low lake levels (Tapia et al., Reference Tapia, Fritz, Baker, Seltzer and Dunbar2003; Fritz et al., Reference Fritz, Baker, Tapia, Spanbauer and Westover2012). At ~2550 cal yr BP (~119.5 cm depth, zone H), the increasing abundance of C. meneghiniana and lack of Chaetoceros sp. suggests the recurrence of fresher water and lake deepening, particularly after ~2315 cal yr BP (~111 cm depth), when N. denticula and Epithemia declined and C. meneghiniana increased rapidly to about 80%. Subsequent shifts between ~2000 and 1100 cal yr BP (~95–25.5 cm depth, zones I and J) in the abundance of C. meneghiniana relative to Epithemia/N. denticula indicate continued fluctuations in lake level.
Zone J contains another long period (~1930–1100 cal yr BP, ~92–25.5 cm depth) of fluctuations between C. meneghiniana dominance and Epithemia/N. denticula dominance. During this 800 yr time, there were about five fluctuations, with the highest abundance of C. meneghiniana (up to 95%) and thus the deepest conditions of this time at ~1790 cal yr BP (~85 cm depth). At ~1250 cal yr BP (~40 cm depth), D. stelligera increased, suggesting that the lake was becoming even fresher than at any prior time in the late Holocene, approaching its modern depth. Cores from Lago Chucuito also show considerable freshening of the large basin of the lake at this time (Tapia et al., Reference Tapia, Fritz, Baker, Seltzer and Dunbar2003; Fritz et al., Reference Fritz, Baker, Tapia, Spanbauer and Westover2012).
This freshening trend continued, and, at ~830 cal yr BP (~24 cm depth), C. andinus increased to about 20% abundance to become the dominant planktic taxon for most of the remainder of the sequence, signifying a fresher, deeper lake with outflow down the Rio Desaguadero. Peaks in benthic diatom species in zone K (~850–640 cal yr BP) and at the boundary of zones L and M (~260 cal yr BP) suggest slightly lower lake levels during those times, within a general period of overall higher lake levels. At this shift to a deep fresh planktic-dominated lake, F. crotonensis began to increase (~260 cal yr BP), replacing the oligosaline C. meneghiniana, and is also indicative of continuing freshening of the lake. By ~80 cal yr BP (~2 cm depth), C. meneghiniana was rare to absent, and only freshwater planktic species were present, representing a relatively fresh and deep Lago Wiñaymarca, similar to that of today.
CONCLUSIONS
Revised lake-level reconstructions from Lago Wiñaymarca
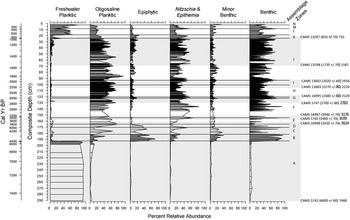
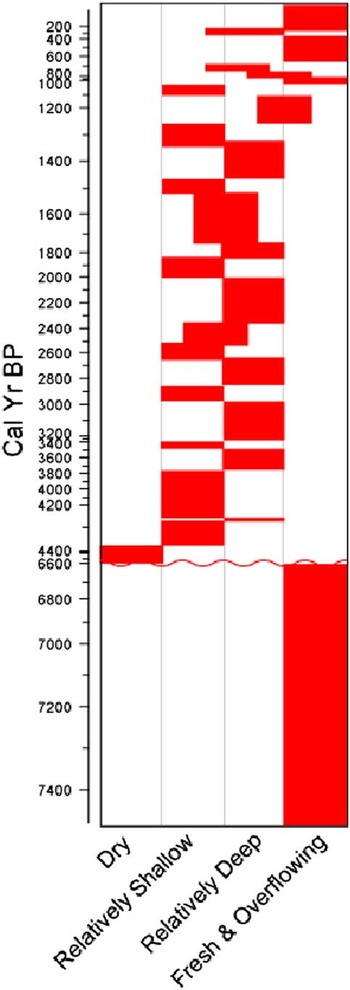
Important new data emerge when the newly recalibrated dates for the erosional surfaces, used as proxies for lake low stands, identified by Abbott and colleagues (Reference Abbott, Binford, Brenner and Kelts1997), and the assemblage zones modeled in the cluster analysis of our new diatom species composition are brought together (Fig. 7). Many of the erosional surfaces coincide with or are very near to diatom zone boundaries and are in proximity to intervals dominated by benthic species, which reflect lower lake levels. The diatom record presented here, however, is a continuous record and demonstrates that the low stands were probably of short duration and that the erosion that produced the surfaces used to identify low stands (gray areas in Fig. 7) probably removed evidence of multidecadal lake-level fluctuation, indicated by the fluctuations between saline-indifferent C. meneghiniana and various benthic diatom species. The diatom record suggests a much more complex history with relatively higher lake levels during zones E (~3700–3500 cal yr BP), H (~2400–2200 cal yr BP), and J (~1900–1000 cal yr BP) and relatively lower levels in the intervening zones C (~4200–4000 cal yr BP), D (~3900–3800 cal yr BP), F (~3200–2700 cal yr BP), G (~2600–2500 cal yr BP), and I (~2100–2000 cal yr BP). A simplification of this complex model of lake-level fluctuation is illustrated in Figure 8. Actual lake depths are not inferred here, but rather characterized on a continuum of relatively shallow or deep.
Ecological diatom groups compared with thin lines indicating diatom zone boundaries. The gray shaded areas are the duration of the sediment hiatuses based on our recalibrations in Calib 7.0.4 of Abbott’s original work (Abbott et al., Reference Abbott, Binford, Brenner and Kelts1997).

(color online) Relative lake level through time. This graph illustrates relative lake level as inferred from diatom analysis.

The high-resolution diatom record presented here shows that Lago Wiñaymarca was variable on a centennial and subcentennial scale during the mid- to late Holocene. This study reveals that there were not simply periods of drastically different low lake levels and high lake levels with which the inhabitants of the region had to contend, but rather multiple fluctuations that produced a continuum of relatively lower versus relatively higher lake levels. This more precise and nuanced reconstruction will now permit archaeologists to better compare and interpret the changes in fishing, birding, farming, and herding patterns that are uncovered in the archaeological record and what they indicate about how these changes affected local social, political, and economic processes in relation to the environment.
ACKNOWLEDGMENTS
D. Achá, O. Ramos, G. Mollericon, A. Mollericon, R. Katari, and A. Katari assisted with fieldwork and core subsampling. We thank the anonymous reviewers for their comments, which made this a stronger paper. This work was funded in part by financial assistance from a National Science Foundation (NSF) Integrative Graduate Education and Research Traineeship grant to SCF and colleagues and an associated traineeship to DMW; by a National Geographic Society grant (9299-13) to CAH, MCB, and SCF; and NSF grants EAR-1251678 and EAR-1338694 to SCF, PAB, and colleagues.