


Obesity and chronic diseases such as CVD, cancer and type 2 diabetes are major public health concerns. Unhealthy eating and physical inactivity are key contributors to the prevalence of obesity and chronic diseases, and thus are of public health importance. Fruit and vegetables are important components of a healthy diet. The 2004 Canadian Community Health Survey reported that children and youth who eat fruit and vegetables five or more times a day are substantially less likely to be overweight or obese, than those whose fruit and vegetable consumption is less frequent(Reference Shields1). Fruit and vegetables also help prevent chronic diseases such as CVD and certain cancers if consumed daily, in sufficient amounts(Reference Maynard, Galuska, Blanck and Serdula2, Reference Ness, Maynard, Frankel, Davey Smith, Frobisher, Leary, Emmett and Gunnell3). Health Canada’s Food Guide recommends that children aged 4–13 years consume five to six servings of fruit and vegetables every day(4). Unfortunately, Canadian children and youth, on average, consume only 4·5 servings of fruit and vegetables/d, and seven out of ten do not consume the recommended number of daily servings(Reference Garriguet5).
Increasing fruit and vegetable consumption among children and youth is an important public health approach(Reference Krebs-Smith, Heimendinger, Patterson, Subar, Kessler and Pivonka6), because dietary habits developed early in life may persist throughout adulthood(Reference Kelder, Perry, Klepp and Lytle7, Reference Lien, Lytle and Klepp8). Children spend a large portion of their days in school; thus, schools are key settings for delivering programmes aimed at children and adolescents(Reference Sharma9). Canadian schools do not have a federally assisted meal programme like the National School Lunch Program in the United States(10), and there are no cafeterias in Ontario elementary schools. Offering free fruit and vegetables during school hours provides a promising opportunity to promote healthy eating in a Canadian setting.
In 2006, as part of Ontario’s Action Plan for Healthy Eating and Active Living, the Ontario (Canada) Ministry of Health Promotion launched the school-based Northern Fruit and Vegetable Pilot Programme (NFVPP), which provided free fruit and vegetables to students in selected elementary schools in a defined area of Northern Ontario. The primary mandate of the NFVPP was to promote healthy eating and wellness while increasing children’s awareness of the benefits of eating fruit and vegetables. The programme’s specific objectives were to increase awareness of the dietary importance of fruit and vegetables, favourably shift children’s preferences and willingness to try fruit and vegetables and increase consumption of fruit and vegetables, both in and outside of school.
A rigorous evaluation was conducted to assess the implementation process (i.e. process evaluation) and the impact (i.e. impact evaluation) of the NFVPP. The present paper focuses on results from the impact evaluation, while findings from the process evaluation will be reported in a separate paper(Reference Sangster Bouck, St Onge, He, Beynon, Lemieux, Khoshaba and Stewart11). The impact evaluation’s objectives were to assess the effect of the NFVPP on psychosocial variables regarding fruit and vegetable behaviours, and fruit and vegetable consumption patterns.
Experimental methods
The evaluation protocol was approved by the Research Ethics Boards at Brescia University College and The University of Western Ontario, London, Ontario, Canada. Parental informed consent was obtained prior to data collection.
Northern Fruit and Vegetable Pilot Programme (NFVPP)
The NFVPP, a 21-week programme for elementary-school children in seven Northern Ontario communities, consisted of two components: (i) Free Fruit and Vegetable Snacks (FFVS) and (ii) Enhanced Nutrition Education (ENE). The FFVS offered either one fruit or one vegetable serving three times per week, to every student in junior kindergarten to grade eight in all intervention schools. The FFVS menu was structured on a 3-week rotation, with a total of nine items (e.g. carrot sticks, broccoli florets, whole pear fruit cups, etc.). The ENE, entitled ‘Paint Your Plate! Create a Masterpiece: Vegetables and Fruit Action Guide for Schools’, was a comprehensive curriculum-based resource for teachers to incorporate into the classroom. Activities were to be used at the school and community level to promote fruit and vegetables, and included various activities for each grade. Schools were encouraged to use the resource kit’s nutritional education materials for morning announcements and school newsletters. Intervention integrity was assessed through a process evaluation, the results of which will be reported in a separate paper(Reference Sangster Bouck, St Onge, He, Beynon, Lemieux, Khoshaba and Stewart11).
Study design and sample size calculation
A non-blinded, cluster-randomised controlled trial (RCT) design was used with schools as the unit of measurement (clusters). Schools were allocated randomly into one of three intervention arms: (i) Intervention I: FFVS+ENE; (ii) Intervention II: FFVS-alone; and (iii) Control group: no intervention. Routine school-based nutrition education activities were carried out according to the grade-level curriculum in the Intervention II and Control groups. Assuming that there would be thirty students in each class and that, based on a similar study’s findings, the intra-class correlation coefficient (ICC) of fruit and vegetable consumption among elementary children in the same school (cluster) is 0·03(Reference Garriguet5), a sample size of 437 students per intervention arm was required to detect an anticipated intervention effect of 0·4 fruit and vegetable serving/d, with a statistical power of 80 % and a two-sided significance level (type-1 error) of 0·05. The present study could not be blinded because the community knew the components of the intervention; thus, researchers were unable to prevent study subjects from knowing what intervention strategies they were receiving.
Subjects
While all students in the intervention schools were exposed to the intervention, impact evaluation data were only collected from students in grades five to eight, due to the required literacy level for filling out the survey.
Sample allocation and sampling scheme
Elementary schools from four school boards in the Porcupine region were invited to participate voluntarily in the NFVPP. All thirty-two schools agreed to participate, however six did not have grades five to eight. These schools were eliminated from the impact evaluation, and the remaining twenty-six schools were included. Using the SPSS for Windows statistical software package version 15·0 (SPSS Inc., Chicago, IL, USA), the eligible schools were allocated randomly into Intervention I (nine schools), Intervention II (nine schools) or the Control group (eight schools). Of the 2254 grade five to eight students in the eligible schools, 1586 participated (70·4 % response rate) at baseline, and 1277 completed the survey at the end of the evaluation (19·5 % dropout rate), for a final completion rate of 56·6 % (Fig. 1).
Study design and sample scheme *Participating subjects; †eligible subjects; NFVPP, Northern Fruit and Vegetable Pilot Programme; JK, junior kindergarten; G, grade

Outcome measures
The primary outcome measure was the difference in children’s fruit and vegetable consumption, in the presence and absence of the intervention. Secondary outcome measures included changes in children’s fruit and vegetable awareness, knowledge and preferences, as well as their willingness and self-efficacy to increase fruit and vegetable consumption, with or without the intervention. The pre-coded 24 h fruit and vegetable recall questionnaire(Reference Haraldsdottir, Thorsdottir, de Almeida, Maes, Perez, Elmadfa and Frost12) asked about fruit and vegetable intake during: morning before school; at school; afternoon after school; at dinner; and evening after dinner. For each interval, participants recorded their juice, fruit and raw vegetable intake. Salad and vegetable soup consumption were only assessed for lunch, afternoon after school, dinner and evening after dinner, while intake of cooked vegetables was assessed for the three after-school intervals only. Amounts were indicated in terms of the number of pieces, slices or glasses consumed, and standards for each were defined. Fruit and vegetable items and standard amounts in the questionnaire were modified to reflect Northern Ontario customs and terminology. Children’s awareness, knowledge and preferences with regard to fruit and vegetable consumption were measured using an instrument adapted from the Pro-Children Questionnaire(Reference De Bourdeaudhuij, Klepp, Due, Rodrigo, de Almeida, Wind, Krolner, Sandvik and Brug13). Both instruments were previously validated, and shown to be sensitive and reliable for measuring intervention effects(Reference Haraldsdottir, Thorsdottir, de Almeida, Maes, Perez, Elmadfa and Frost12, Reference De Bourdeaudhuij, Klepp, Due, Rodrigo, de Almeida, Wind, Krolner, Sandvik and Brug13).
Data were collected at baseline and at the end of the intervention from participants in the three intervention arms. Surveys were administered on Wednesdays, Thursdays and Fridays during the data collection period in order to obtain a weekday 24 h dietary recall that coincided with the Tuesday, Wednesday and Thursday FFVS distribution days; however, schools may have deviated from these set distribution dates due to bad weather. While a full serving was provided to students on the FFVS days, every student may not have eaten the snack provided. The questionnaire was administered to students in their classrooms, and was completed by the children (with assistance from teachers) after the teachers gave brief instructions scripted by the researchers. Students were encouraged to complete the survey without discussion with their peers. All aspects of the evaluation were conducted in English and French.
All quantitative data were analysed using SPSS. Missing values were excluded listwise. The level of significance for all statistical tests was set at 0·05. The ‘intent-to-treat’ analysis principle was followed, and the GLM Univariate procedure was used to determine intervention effects. Because the study design consisted of schools as the unit of measurement (clusters) and students as the unit of analysis, cluster effects were accounted for in the analyses. The models included the random effect of school-within-condition to account for the clustering effect, where outcome measures were the dependent variables, the intervention was the fixed factor and individual-level factors (i.e. the corresponding outcome measures at baseline, gender and age) were covariates. School-level factors (i.e. urban v. rural) and pre-existing fruit and vegetable programmes were included in the models as random factors. Children who had both baseline and endpoint values were included in the analysis for each variable. The intervention’s effect size and se were reported as the differences in outcome measures at endpoint with and without intervention, controlling for baseline values and other confounders.
Primary outcome – fruit and vegetable intake
Data from the 24 h recall were coded manually(Reference Haraldsdottir, Thorsdottir, de Almeida, Maes, Perez, Elmadfa and Frost12). A coding protocol was developed, which categorised fruit, vegetables and 100 % fruit juice by group and/or mixed food item based on the 2004 Dole 5-A-Day Fruit & Vegetable Nutrition Facts Chart(14). Serving sizes defined by this coding protocol were consistent with Canada’s Food Guide to Healthy Eating(4). Means and sd were calculated to describe children’s fruit and vegetable consumption (servings/d). No clear guideline is currently available for classifying outliers in fruit and vegetable intake among adults or children. Fifteen servings per day has been used previously as the cut-off for adults(Reference Michels, Edward, Joshipura, Rosner, Stampfer, Fuchs, Colditz, Speizer and Willett15). Twelve servings was chosen as the cut-off for children in the current study. Students whose daily fruit and vegetable consumption exceeded twelve servings were considered outliers and excluded from the analyses related to fruit and vegetable intake. This included 227 cases at baseline and 223 at endpoint. Among these, eighty-five cases had an intake greater than twelve servings at both baseline and endpoint, which brought the total number of outliers to 365. The average fruit and vegetable intake for these outliers at baseline and endpoint was 19·2 servings (sd 7·9) and 20·4 (sd 8·8), respectively. In addition, 217 cases had a missing value in total fruit and vegetable intake either at baseline or endpoint; therefore, the final sample size for the primary outcome analysis was 695.
Secondary outcomes – psychosocial and behavioural scales
Scales on children’s knowledge, attitude, liking, self-efficacy, intention, willingness, habit, preferences and peer influences towards fruit and vegetables were created based on the Pro-Children Questionnaire(Reference Garriguet5). Potential individual cognitive and behavioural changes beyond these set scales were also explored; the χ 2 test was used to compare, by group, students’ responses to each of the psychosocial and behavioural questions at baseline and endpoint. This test was used because the Stuart–Maxwell test, which is used for paired categorical data that have more than two categories, is not available on SPSS.
Results
Subjects
Table 1 presents the schools’ profiles by intervention arms. In general, school characteristics were similar across the three groups, except that Intervention I schools had more pre-existing fruit and vegetable programmes. This was considered a confounder and controlled for in all analyses to determine intervention effect. Subjects’ profiles were, in general, similar across the three groups (Table 2). Baseline fruit and vegetable intake were not significantly different among the three groups (F = 2·3, P = 0·1). The average intake was 4·6 servings/d, which is comparable to the recent national average daily fruit and vegetable intake among this age group (i.e. 4·5 and 4·4 servings for boys and girls, respectively)(Reference Garriguet16).
School profile by intervention arm (n)

FV, fruit and vegetable.
Subject profile by intervention arm (n)

No statistical significant difference was detected by χ 2 test among the three intervention arms.
Participants’ opinion on receiving free fruit and vegetables
At baseline, over 80 % of students across the three groups liked the idea of receiving free fruit at school (Table 3). Student responses stayed almost the same at endpoint. At baseline, 60 % to 70 % of students liked the idea of receiving free vegetables, and the percentages remained relatively stable at endpoint.
Participants’ opinion on receiving free fruit and vegetables (%)

No statistical significant difference was detected by χ 2 test between baseline and endpoint.
Intervention effect
Primary outcome – fruit and vegetable intake
Table 4 shows intervention effects on fruit and vegetable intake (servings/d). Intervention I and II groups had higher total fruit and vegetable intake than the Control group (0·6 and 0·5 serving/d, respectively), although the differences were not statistically significant. However, Intervention I students consumed statistically more fruit and vegetables at school (0·49 serving/d, P < 0·05) than students in the Control group (Fig. 2). Similarly, Intervention II students consumed 0·42 serving/d (P > 0·05) more at school than Control students; however, this difference was not statistically significant. Only a very slight difference existed between Intervention I and II (Fig. 2).
Intervention effect on fruit and vegetable intake (mean and se)Footnote *

a,b Means with different superscript letters are significantly different by post hoc multiple comparison using the least significant difference (LSD) pairwise multiple comparison.
* Means are adjusted for baseline measures, age and gender as covariates, and school clustering effect, school location (urban v. rural) and presence of existing fruit and vegetable programmes as random factors.
†Subjects with missing values were excluded from the analysis.
Secondary outcomes – psychosocial and behavioural scales
Students’ psychosocial and behavioural scores at endpoint are presented in Table 5. Mean scores on the knowledge, attitude, liking, intention, willingness and peer-influence scales were close to the maximum values, implying that students across the three groups had high knowledge levels, positive attitudes about fruit and vegetables and enjoyed, intended to consume and were willing to try fruit and vegetables. In addition, there was a positive peer influence around fruit and vegetable consumption. Students from all three groups had moderate levels of self-efficacy and habits to consume fruit and vegetables. The preference scores on the twenty fruit and twenty-three vegetables listed were relatively low. There were no statistically significant differences among the three groups for all scores, except that Intervention I and II seemed to have slightly higher preference scores than the Control group.
Intervention effects on fruit and vegetable intake at school. Adjusted mean differences and standard errors of fruit and vegetable intake at school (serving/school day) between groups, controlling for baseline measure, age and gender as covariates, and school clustering effect, school location (urban v. rural) and presence of existing fruit and vegetable programmes as random factors. *Intervention I mean values were significantly different from those in the Control group: P < 0.05 by post hoc multiple comparison using the least significant difference (LSD) pairwise comparison

Intervention effect on psychosocial variables and behavioral outcomes

Means are adjusted for baseline measures, age and gender as covariates, and school clustering effect and presence of existing fruit and vegetable programmes as random factors.
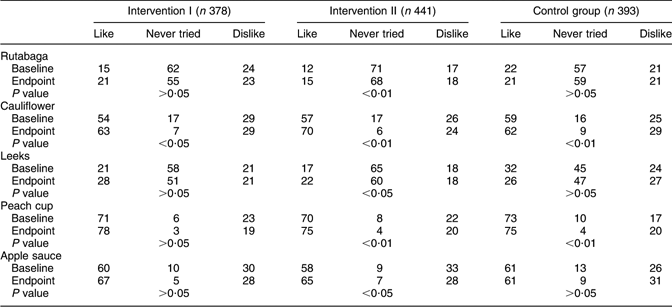
Comparing students’ responses to each of the psychosocial and behavioural questions at baseline and endpoint, it was noted that students’ preferences for certain fruit and vegetables shifted from ‘never tried it’ towards ‘like it’ (Table 6). In Intervention I, the proportion of students who had ‘never tried’ cauliflower decreased from 17 % at baseline to 7 % at endpoint, while the proportion of students who ‘liked’ cauliflower increased from 54 % at baseline and 63 % at endpoint (χ 2 = 24, P < 0·05). Students in Intervention II had statistically significant shifts in their preferences for apple sauce, peach cups, leeks, cauliflower and rutabaga from ‘never tried it’ towards ‘like it’. Although the students in the Control group also showed statistically significant changes in their preferences for peach cups and cauliflower, the shifts were bidirectional (i.e. some ‘never tried’ responses shifted to ‘like it’ and some to ‘dislike it’). In contrast, there was a tendency toward unfavourable changes in self-efficacy, intention and peer influence related to vegetable consumption in Intervention II students at endpoint, but not in Intervention I or Control group students (Fig. 3). The proportion of students in Intervention II who ‘agreed’ to the intention statement, ‘I want to eat vegetables’ decreased from 74 % at baseline to 70 % at endpoint (χ 2 = 8·3, P < 0·05). Similarly, at baseline, 83 % of students felt that ‘If I decided to eat vegetables, I can do it’ (a self-efficacy measure); this percentage decreased to 76 % at endpoint (χ 2 = 9·7, P < 0·05). The proportion of students who perceived that ‘my best friend(s) eat vegetables’, a measure of peer-influence, decreased from 55 % at baseline to 46 % at endpoint (χ 2 = 9·5, P < 0·05).
Psychosocial variable changes in Intervention II – baseline v. endpoint (␣, agree;  , neutral;
 , disagree) *P < 0·05 by χ 2 test

Changes in fruit and vegetable preferences: baseline v. endpoint
Discussion
The NFVPP’s impact was evaluated using a non-blinded, cluster-RCT with validated instruments that are sensitive for assessing intervention effects(Reference Haraldsdottir, Thorsdottir, de Almeida, Maes, Perez, Elmadfa and Frost12, Reference De Bourdeaudhuij, Klepp, Due, Rodrigo, de Almeida, Wind, Krolner, Sandvik and Brug13). Based on our knowledge of the relevant literature, this is the first large-scale Canadian healthy eating promotion initiative to be evaluated using a scientifically rigorous method. Our results indicate that the NFVPP increased fruit and vegetable consumption at school among children in grades five to eight and resulted in favourable preference changes towards certain fruit and vegetables.
Intervention I students consumed significantly more fruit and vegetables at school by 0·49 serving/d, as compared to the Control group. Although not statistically significant in comparison to the Control group, Intervention I and II resulted in increases in subjects’ total daily fruit and vegetable intake by 0·6 and 0·5 serving, respectively. These results are consistent with the ‘5-a-Day Power Plus Program’ in Minnesota, which increased fruit and vegetable consumption at lunch by 0·4 serving/d(Reference Perry, Bishop, Taylor, Murray, Mays, Dudovitz, Smyth and Story17). The school-based intervention in Minnesota employed multiple strategies including behavioural curricula in classrooms, parental involvement, school food service changes and industry support and involvement. The authors concluded that parental involvement is needed to increase fruit and vegetable consumption at home(Reference Perry, Bishop, Taylor, Murray, Mays, Dudovitz, Smyth and Story17). In the NFVPP, the insignificant changes in fruit and vegetable consumption at home may be attributed to minimal parental involvement coupled with the community’s limited access to fresh fruit and vegetables.
An important question to be addressed was ‘did the combination of distributing free fruit and vegetables with enhanced nutrition education result in a greater impact on children’s fruit and vegetable consumption than distributing free fruit and vegetables alone?’ A recent study by Reinaerts et al. examined the effect of a free fruit and vegetable distribution programme compared to a multi-component programme consisting of curriculum and parental involvement on 4–12 year-old children’s fruit and vegetable consumption(Reference Reinaerts, de, Candel and de Vries18). Both programmes increased children’s consumption by 0·2 serving/d, suggesting that merely distributing free fruit and vegetables has potential as a practical population-based strategy to increase children’s fruit and vegetable intake(Reference Reinaerts, de, Candel and de Vries18). Our current evaluation compared the net intervention effect between two interventions. Although no statistical differences were detected between the intervention arms, the combined strategy, but not the FFVS-alone strategy, resulted in significant increases in children’s fruit and vegetable consumption at school. This finding implies that the combined strategy worked better than the single strategy, despite the fact that the ENE component was not implemented fully(Reference Sangster Bouck, St Onge, He, Beynon, Lemieux, Khoshaba and Stewart11).
It is important to consider how the NFVPP results compare to other published research. In a systematic review of eleven fruit and vegetable interventions among elementary-school students, nine had a significant positive effect on fruit and vegetable consumption(Reference Knai, Pomerleau, Lock and McKee19). The review highlighted key features that facilitated the interventions’ success, including: duration of at least 12 months; increased fruit and vegetable exposure in the school community; inclusion of teacher training and integration into the curriculum; leadership and encouragement by peers and school food service staff; and involvement of parents at school and at home(Reference Knai, Pomerleau, Lock and McKee19). The NFVPP possessed a number of these features; however, due to the pilot nature of the programme, the ENE component was not implemented fully, and the restricted variety of fruit and limited capacity to deliver fresh vegetables to schools in remote Northern areas may have further compromised intervention effects(Reference Sangster Bouck, St Onge, He, Beynon, Lemieux, Khoshaba and Stewart11).
Although no differences were detected in any psychosocial or behavioural scores across the three groups, there were favourable preference changes on certain fruit and vegetables with a shift from ‘never tried it’ towards ‘like it’ in Intervention I and II students. This finding echoes that of a fruit and vegetable intervention in Prince Edward Island (Canada) that demonstrated an increase in elementary-school students’ liking of certain fruit and vegetables after a 6-week exposure period(Reference Taylor and Binns20). Another study reported that when children were exposed to sweet peppers for 2 weeks, their ‘liking’ of the vegetable increased significantly as compared to a Control group(Reference Wardle, Herrera, Cooke and Gibson21). The authors suggested that ‘exposure’ has promise as a technique for improving children’s liking of vegetables(Reference Wardle, Herrera, Cooke and Gibson21). In the current context, more children in Intervention I and II ‘liked’ cauliflower after the intervention. Surprisingly, children in Intervention II began liking vegetables (e.g. leeks and rutabaga) that were not offered in the programme. Based on Social Cognitive Theory’s underlying principle of reciprocal determinism, people’s behaviour influences, and is influenced by, personal factors as well as the social and physical environment(Reference Bandura22). Research suggests that children’s dislike of foods can be transformed into liking with repeated tasting or ‘exposure’ to those foods(Reference Drewnowski23). It is speculated that children in the NFVPP became more apt to try and ‘like’ new fruit and vegetables through exposure to fruit and vegetables in school. In addition, research has shown that children’s preferences for, and consumption of, disliked vegetables improved when children had opportunities to observe their peers selecting and eating those foods, and were encouraged by adults to try new foods(Reference Birch24). The current intervention afforded children the opportunity to learn from their peers and be encouraged by teachers in this regard; therefore, it is unclear why this phenomenon was not observed in the Intervention I group. In the Control group, children’s preferences for cauliflower and peach cups shifted significantly, from ‘never tried’ to both ‘liked’ and ‘disliked’. This phenomenon may have come as a result of children’s enhanced willingness to try new foods as they age. Observed differences in children’s preferences must be interpreted with caution, because it cannot be determined whether they were a result of receiving the NFVPP or other events such as history, maturation and testing. Unlike the previous analyses, this type of single group pre–post analysis does not control for these threats to validity. Future research should further examine these trends to determine if preference changes are artefacts or attributable to the intervention.
Avoiding unintended adverse outcomes is critical, especially for population-based interventions. There appears to be minor undesirable intervention outcomes in the NFVPP, consisting of a tendency towards unfavourable changes in self-efficacy, intention and peer influence pertaining to vegetable consumption among students in Intervention II. Such adverse outcomes may be attributed to exposure to poor quality vegetables. However, students in both Intervention I and II were exposed to the same vegetables including those of poor quality(Reference Sangster Bouck, St Onge, He, Beynon, Lemieux, Khoshaba and Stewart11). It is speculated that Intervention I’s ENE component may have prevented these adverse outcomes; however, further research is needed to determine how the unfavourable outcomes may be prevented. These results suggest that in order to minimise unintended adverse outcomes on children’s psychosocial variables and behaviours, future fruit and vegetable programmes need to ensure full implementation of the ENE, increase variety over a longer duration, involve parents and further engage teachers and staff in the implementation process.
The NFVPP used a combined strategy (FFVS + ENE) which demonstrated a favourable intervention effect on children’s fruit and vegetable consumption at school, despite numerous methodological challenges and limitations(Reference Sangster Bouck, St Onge, He, Beynon, Lemieux, Khoshaba and Stewart11). The pre-coded 24 h recall questionnaire is considered to have acceptable validity and reliability, and is suitable for use in reflecting relatively small intervention effect sizes(Reference Haraldsdottir, Thorsdottir, de Almeida, Maes, Perez, Elmadfa and Frost12). Due to the tight timeline for baseline data collection before the launch of this government-funded initiative, the research team was unable to pre-test the European-based instrument among a sample of children in Ontario, Canada. The questionnaire is also relatively complicated to complete, which may have resulted in a substantial proportion of missing and invalid values. Although the overall sample size was close to the 437 subjects per group that was required to detect an intervention effect of 0·4 serving/d (with power of 80 %; type one error of 5 %), the missing/invalid values decreased the sample size. This compromised the statistical power when determining the intervention effects on fruit and vegetable consumption. In addition, while methods for analysing continuous outcomes are well established for cluster-RCT, there is currently a limited capacity for analysing categorical data with commonly used statistical software (e.g. SPSS)(Reference Dobbins and Simpson25). Therefore, results from the pre- and post-changes in categorical variables should be interpreted with caution.
Conclusions and implications
The NFVPP resulted in positive changes in elementary school-aged children’s fruit and vegetable consumption at school, and favourable preference changes for certain fruit and vegetables. Future fruit and vegetable programmes should consider using a combined strategy of both nutrition education and exposure to fruit and vegetables, and improving community access to affordable fresh fruit and vegetables where necessary.
The current study was a pilot project aimed at providing insights to inform effective health promotion programme delivery. Recommendations for the Ontario Ministry of Health Promotion include, but are not limited to: (i) continue the Northern Fruit and Vegetable Programme having addressed issues related to produce quality; (ii) use a combined strategy that offers free fruit and vegetables and enhanced nutrition education in the classroom; (iii) allocate funds to examine, at a population level, the programme’s long-term impact on children’s fruit and vegetable consumption.
Acknowledgements
There is no conflict of interest in this submission. The Ontario Ministry of Health Promotion (MHP) funded the project. The authorship responsibilities are as follows: M.H. and C.B. co-led the research project and made significant intellectual contributions to study design, survey instrument selection, sampling strategy and the analysis and interpretation of data associated with the work contained in the manuscript. L.K. made substantial contributions to the project in her role as the evaluation project coordinator. M.H. drafted the article and C.B. reviewed and revised it for intellectual content. M.S.B., R.S.O., S.S., L.K., B.A.H. and B.C. participated in the process of survey instrument selection, data interpretation, and review and revision of the manuscript for intellectual content. All authors approved the contents of the manuscript. The authors are most appreciative of the support of Ms Roselle Martino, Nutrition Consultant, Chronic Disease Prevention and Health Promotion Branch (MHP) and her ministry colleagues for their support of the PHRED Programme. The authors are grateful to Ms Melissa van Zandvoort, Research Associate, Public Health Research, Education and Development (PHRED) Programme, Middlesex-London Health Unit for revising and formatting the draft manuscript; as well as Ms Nancy Forbes and Ms Susie Noble, Middlesex-London Health Unit, for their continued support throughout the research project. Appreciation is also extended to the Work-Study Programme at Brescia University College for providing salary support to the students who assisted with data entry and verification. The evaluation would not have been possible without the active engagement and commitment of many players. Special thanks go to school principals and teachers for their assistance in the informed consent process and data collection.



