Implications
Evaluating rumen functional and structural characteristics and their associations with feed efficiency is important to understand the biology underlying feed efficiency. Our results revealed feed efficient cattle have greater total bacteria populations, lesser methanogen populations, thicker rumen epithelium and lower rumen pH. This evidence supports that feed efficient cattle have rumen features consonant with improved feed energy utilization. In addition, sampling on-farm and at slaughter influences the relationships of volatile fatty acids and microbiology with feed efficiency. Rumen parameters may serve as proxies for feed efficiency optimizing decision-making in the beef industry.
Introduction
Improvements in beef cattle feed efficiency can benefit the environmental and financial aspects of agricultural systems, as the majority of greenhouse gases from agricultural production are due to cattle enteric emissions (Food and Agriculture Organization, 2014) and feed costs are a major expense of beef cattle farming. However, feed efficiency traits such as residual feed intake (RFI) lack industry practicality. Despite RFI serving as a useful concept to investigate the biology underlying feed efficiency (Montanholi et al., Reference Montanholi, Haas, Swanson, Coomber, Yamashiro and Miller2017; Munro et al., Reference Munro, Schenkel, Physick-Sheard, Fontoura, Miller, Tenessen and Montanoli2017), few have evaluated associations of specific rumen functional and structural parameters with RFI until recently (Hernandez-Sanabria et al., Reference Hernandez-Sanabria, Goonewardene, Wang, Durunna, Moore and Guan2012; Myer et al., Reference Myer, Smith, Wells, Kuehn and Freetly2015; McDonnell et al., Reference McDonnell, Hart, Boland, Kelly, McGee and Kenny2016). Moreover, there are few studies on the effects of sampling routine (i.e. on-farm and at slaughter) on the relationships of biomarkers for feed efficiency (Bourgon et al., Reference Bourgon, Diel de Amorim, Miller and Montanholi2017), which also influence the relationships with ruminal parameters (Warner, Reference Warner1966).
The production of volatile fatty acids (VFA) through microbial fermentation contributes to 75% of energy requirements in ruminants (Bergman, Reference Bergman1990). When considering total VFA concentration, greater VFA molar concentrations have been measured in efficient cattle (Guan et al., Reference Guan, Nkrumah, Basarab and Moore2008). Evidence has also shown that the majority of microbial profiles are similar among efficient cattle (Hernandez-Sanabria et al., Reference Hernandez-Sanabria, Goonewardene, Wang, Durunna, Moore and Guan2012) and specific bacterial species are associated with efficient steers (Guan et al., Reference Guan, Nkrumah, Basarab and Moore2008). In addition, studies have evaluated the adaption of rumen epithelial structure to differing physiological states (Kern et al., Reference Kern, Lindholm-Perry, Freetly, Kuehn, Rule and Ludden2016). Rumen functional parameters collectively contribute to the regulation of rumen pH (RpH) and temperature (RT) by microbial VFA production and epithelial absorption (Gäbel et al., Reference Gäbel, Aschendbach and Müller2002). Despite the physiological mechanisms regulating these ruminal parameters, the disruption of homoeostasis may influence their relationships across distinct phenotypes for feed efficiency differently as observed in other aspects of the bovine biology (Bourgon et al., Reference Bourgon, Diel de Amorim, Miller and Montanholi2017; Munro et al., Reference Munro, Schenkel, Physick-Sheard, Fontoura, Miller, Tenessen and Montanoli2017).
Therefore, it was hypothesized that the variability in rumen metabolism across feed efficiency phenotypes can be characterized through functional and structural aspects measured on-farm and at slaughter. Such characterization may reveal an increased functional workload in the rumen of feed efficient cattle. The objectives of this study were: (1) to characterize rumen functional and structural parameters including microbial and VFA profiles, rumen papillae epithelial and stratum corneum thickness, and RpH and RT in the context of feed efficiency in feedlot cattle and; (2) compare the response of VFA and microbial profile when cattle are sampled on-farm and at slaughter.
Material and methods
Animal husbandry and experimental design
Experimental procedures followed the Canadian Council of Animal Care Guidelines (Canadian Council of Animal Care, 2009). A contemporaneous group of 48 crossbred beef cattle consisting of two subpopulations of 16 steers (32 steers) and one subpopulation of 16 bulls were used. The BW and age (mean±SD) for steers and bulls at the end of the productive performance test were 576±65 kg and 410±16 days and 590±57 kg and 413±10 days, respectively. The overall breed composition across the 48 animals was 39.4% Angus, 44.9% Simmental and 15.7% other European breeds.
Each group of cattle were housed separately in indoor pens bedded with wood shavings and equipped with automated feeding stations (Insentec, BV, Marknesse, The Netherlands) with feed bunks filled at 0830 h daily. The as-fed ingredient composition of the diet fed to all 48 animals was 52.5% high moisture corn, 42.3% haylage, 3.5% soya bean meal and 1.7% premix of which the composition is described by Montanholi et al. (Reference Montanholi, Swanson, Schenkel, McBride, Caldwell and Miller2009). The chemical composition of the diet was 53.8% dry matter (DM), 13.9% CP, 22.2% NDF, 10.9% ADF and 86.0% total digestible nutrients.
Animals underwent a 112-day productive performance test to determine DM intake (DMI), average BW (ABW), and ultrasound measurements for body composition including ribeye area (REA), backfat thickness (BKF) and marbling score (MAR) (Montanholi et al., Reference Montanholi, Swanson, Schenkel, McBride, Caldwell and Miller2009); BW and ultrasound measures were taken before the morning feeding. Upon completing the productive performance evaluation, rumen fluid was collected and RpH and RT data loggers were inserted 5.5±1 days before slaughter. Animals were allowed feed and water until weighing and loading at 0730 h and were transported for ~25 min before slaughter, which was initiated 42 days upon the completion of the performance evaluation. Cattle were transported in groups of six over 8 days of processing, which occurred within a 2.5-h range. At slaughter, rumen fluid, rumen sacs tissues and the whole rumen were collected and rumen data logger was recovered.
Feed to gain and residual feed intake determination
Feeding events were individually summarized on a daily basis, obvious outliers were removed and upper and lower limits for daily feed intake were applied to ensure inclusion of daily feed intakes with >98% probability of belonging to the normal distribution. The resulting individual daily feed intake records were averaged and converted to a DM basis, which was used to calculate feed to gain ratio (FG; DMI/ADG).
Linear regressions on days on test, with observations taken in 28 days intervals throughout the performance test were used to determine individual intercepts and final-test values were calculated by computing the animals intercept and adding the slope for each trait multiplied by 112 days for REA, BKF and MAR; or 56 days for ABW. Using the GLM procedure described by Montanholi et al. (Reference Montanholi, Swanson, Schenkel, McBride, Caldwell and Miller2009), the following regression model was used to calculate RFI:
 $$\eqalignno{ {\rm DMI}\, {\equals}\, & {\rm 15}.{\rm 2}0{\rm 4}{\plus}0.0{\rm 12}\left( {{\rm ABW}} \right){\plus}0.0{\rm 14}\left( {{\rm ADG}} \right){\plus}0.0{\rm 61}\left( {{\rm REA}} \right)\cr & {\plus}0.{\rm 354}\left( {{\rm BKF}} \right){\minus}0.{\rm 917}\left( {{\rm MAR}} \right){\plus}{\rm subpopulation}{\plus}{\rm RFI}$$
The effects of the three subpopulations of cattle, two groups of steers and one group of bulls, were 0.00, −8.14, and −11.38 respectively. The R 2 for this model was 0.74.
Rumen pH and temperature
Data loggers (T9 LRCpH; Dascor, Escondido, CA, USA) for measuring RpH and RT were calibrated at pH 4.0 and 7.0 and programmed to record RpH and RT at 5 min intervals. Animals were restrained and loggers were inserted using oesophageal tubing, with intended delivery to the ventral sac, and recovered at slaughter. Five bulls and three steers (subpopulation 1) with RpH and RT loggers found in the reticulum during slaughter were excluded from the data set. The RpH and RT data set was organized by average percentage time spent per day in acidotic (pH⩽5.6), optimal (5.6<pH<6.0), suboptimal (6.0⩽pH<6.4), high (pH⩾6.4) RpH ranges (Nagaraja and Lechtenberg, Reference Nagaraja and Lechtenberg2007) and average RT within the RpH ranges calculated.
Adjusted RpH and RT feed efficiency group (FEG) means were determined on 5 min intervals fitting repeated measures models in SAS proc Mixed, using the repeated statement with a first order autoregressive co-variance structure. The model for both RpH and RT included the classification effects of FEG, Time, FEG×Time, and the covariates breed composition and on feed intake. Up to quartic regressions were tested for feed intake, showing that a linear and a quadratic regression were significant for RpH and RT, respectively. The covariate feed intake was included and excluded in both models to further examine the biological relationships of RpH and RT with feed intake.
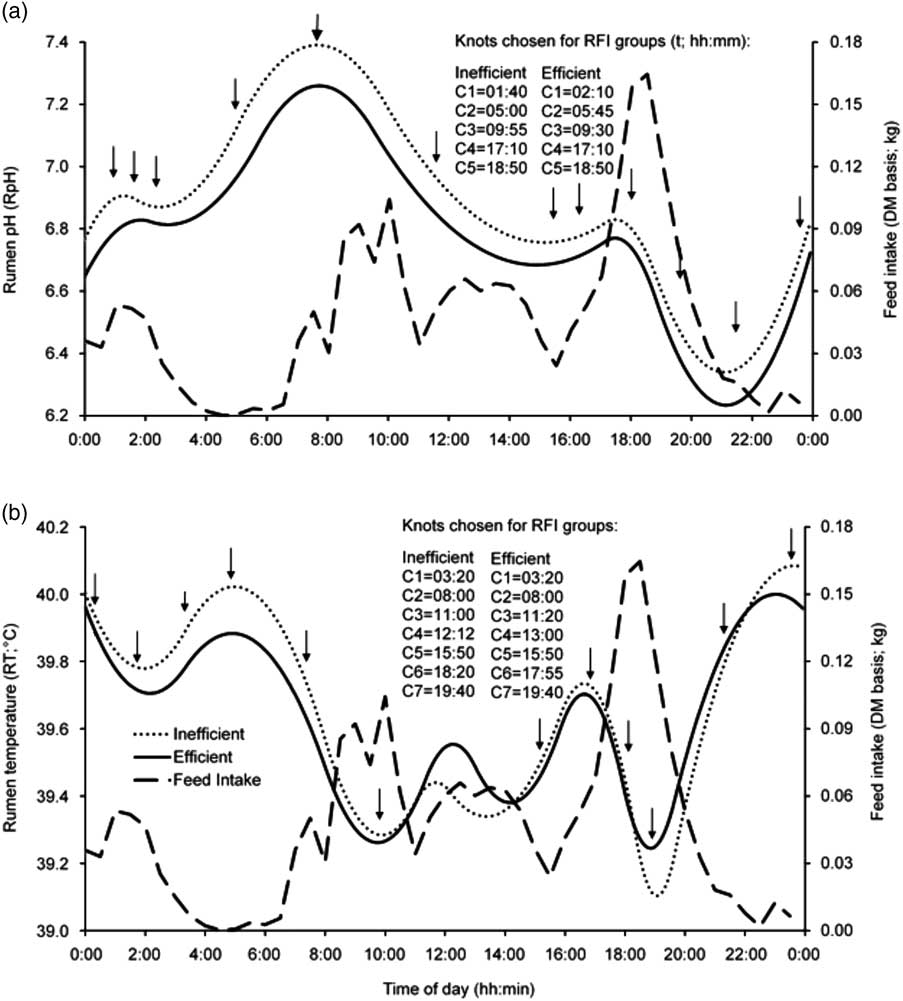
The estimated RpH and RT FEG means for each time point were then used for estimating the shape of the curve of mean RpH and RT over time, using segmented polynomials. Following the same procedure as in Munro et al. (Reference Munro, Schenkel, Physick-Sheard, Fontoura, Miller, Tenessen and Montanoli2017), adjusted RpH and RT means were plotted and knots were selected by visual inspection at the inflection points of the curve (RpH, five knots, RT; seven knots, Figure 1) and used to calculate the time covariates (Z values in the model below) needed for each segmented polynomial. The following polynomials were fit for RpH and RT:
 $$\eqalignno{ {\rm RpH}_{{ij}} \, & {\equals}\, \mu {\plus}{\rm efficiency}_{i} {\plus}\beta _{1} T_{{(i)}} {\plus}\beta _{2} T^{2} _{{(i)}} {\plus}\beta _{3} Z_{{1(i)}} {\plus}\beta _{4} Z_{{2(i)}} \cr & \ \ {\plus}\beta _{5} Z_{{3(i)}} {\plus}\beta _{6} Z_{{4(i)}} {\plus}\beta _{7} Z_{{5(i)}} {\plus}\in_{{ij}} $$
 $$\eqalignno{ {\rm RT}_{{ij}} & \, {\equals}\, \mu {\plus}{\rm efficiency}_{i} {\plus}\beta _{1} T_{{(i)}} {\plus}\beta _{2} T^{2} _{{(i)}} {\plus}\beta _{3} Z_{{1(i)}} {\plus}\beta _{4} Z_{{2(i)}} \cr &\ \ \; {\plus}\beta _{5} Z_{{3(i)}} {\plus}\beta _{6} Z_{{4(i)}} {\plus}\beta _{7} Z_{{5(i)}} {\plus}\beta _{8} Z_{{6(i)}} {\plus}\beta _{9} Z_{{7(i)}} {\plus}\in_{{ij}} $$
where RpH ij and RT ij are the j th mean RpH and RT, recorded at time T (time of measurement, 5 min interval) within the i th FEG; μ is the overall trait mean; efficiency i is the fixed effect of the i th FEG (i=efficient or inefficient) and β 1 to β 9 are fixed regression coefficients on T, T 2 and Z 1(i) to Z 5(i) (RpH) or T, T 2, Z 1(i) to Z 7(i) (RT), within the i th FEG, where Z 1(i) to Z 7(i) were the segmented polynomial covariates calculated following Munro et al. (Reference Munro, Schenkel, Physick-Sheard, Fontoura, Miller, Tenessen and Montanoli2017) to fit six quadratic segments (a Q-Q-Q-Q-Q-Q polynomial) for RpH and eight quadratic segments (a Q-Q-Q-Q-Q-Q-Q-Q polynomial) for RT ; and ϵ ij is the random residual effect. The area under the predicted RpH and RT curves was calculated using an on-line integral calculator (Integral Calculator; David Scherfgen, Bonn, Germany) and the predicted difference between efficiency groups was determined.
Rumen pH (RpH) and temperature (RT) and feed intake circadian representation for efficient (n=24) and inefficient (n=24) cattle. Predicted RpH (a) and RT (b) means of efficient (solid line) and inefficient (dotted line) cattle and feed intake (dry matter basis; kg) (broken line) over the circadian period. Selected knots (Cn) used to generate predicted curves are listed. Vertical arrows marking RpH and RT curves denote time points where efficient and inefficient cattle predictions were compared, which all and none differed for RpH and RT, respectively.

Rumen fluid and tissue sampling
Rumen fluid (100 ml) was collected on-farm using an oro-ruminal probe (FLORA Ruminator; Profs-Products, Guelph, ON, Canada), and within 1.98±0.2 h after slaughter by filtering digesta from the ventral sac using cheese cloth. Samples were submerged into liquid nitrogen and maintained at −80°C until analysis. Tissue samples (4 cm2) were excised from the ventral, ventral blind and dorsal blind sacs and pinned to cardboard for fixation in 10% neutral phosphate buffered formalin. The rumen was then emptied and weighed to determine empty rumen weight and rumen weight as a percent of BW measured before slaughter.
DNA extraction and quantitative PCR to determine microbial populations
Total DNA extraction was performed as described by Guan et al. (Reference Guan, Nkrumah, Basarab and Moore2008). In brief, 1.00 ml rumen fluid was centrifuged (4°C, 19 000×g for 5 min) with 0.5 g of 0.1 mm zirconium–silica beads. Samples were then homogenized using a bead-beating method (4800 r.p.m. for 3 min) (Mini Bead-Beater-8; Biospec, Bartlesville, OK, USA). The DNA was purified and precipitated using tris-acetate-EDTA buffer (10 mM Tris-Cl pH 8.3, 0.1 mM EDTA, 0.04% sodium-azide) within QIAamp Fast DNA Stool Mini Kit (Qiagen, Valencia, CA, USA) and centrifuged (4°C, 16 000×g for 1 min). Concentration and purity of DNA was measured at A260 and A280 nm wavelengths using a spectrophotometer (Nanodrop 116 ND-1000; Nano Drop Technologies, Wilmington, DE, USA). Extracted DNA samples were diluted to 10 ng/µl and used as templates for quantitative PCR (qPCR) reactions using SYBR Green chemistry with StepOnePlus qPCR system (Applied Biosystems, Foster City, CA, USA). The microbial population was determined with copy number per ml rumen fluid by measuring bacterial 16S rRNA gene using primer pair U2-F(5'- ACTCCTACGGGAGGCAG-3')/U2-R(5'-GACTACCAGGGTATCTAATCC-3'), archaeal 16S rRNA gene using primer pair uniMet1-F(5'-CCGGAGATGGAACCTGAGAC-3’)/uniMet1-R(5'-CGGTCTTGCCCAGCTCTTATTC-3'), protozoal 18S rRNA gene using primer pair P-SSU-316F(5-GCTTTCGWTGGTAGTGTATT-3')/P-SSU-316539R(5'-CTTGCCCTCYAATCGTWCT-3'), and fungal internal transcribed spacer DNA using primer pair fungi-F1(5'-GAGGAAGTAAAAGTCGTAACAAGGTTTC-3')/fungi-R1(5'-CAAATTCACAAAGGGTAGGATGATT-3'). The qPCR programme was: 95°C for 10S, followed with 40 cycles of 95°C for 3 s and 60°C for 30 s, fluorescence signal was captured at the end of each cycle. Melting curve was generated for all reactions with 0.3°C intervals between 60°C and 95°C. The standard curve for each individual targeted gene was generated with pure clones for the corresponding microbial fragment respectively, where negative control used nuclease-free water as template. Each reaction was performed in triplicates, and the qPCR amplification efficiencies ranged from 0.90 to 1.05. The microbial gene copy numbers were calculated according to Zhou et al. (Reference Zhou, Hernandez-Sanabria and Guan2009).
Rumen fluid volatile fatty acid profile
Rumen fluid VFA concentrations for acetate, propionate, butyrate, isobutyrate, valerate, isovalerate and caproate were analysed as described by Guan et al. (Reference Guan, Nkrumah, Basarab and Moore2008). In brief, rumen fluid samples were centrifuged (0°C, 13 000×g for 5 min). Using a gas chromatography vial, 25% phosphoric acid and internal standard was added. Samples were run using a chromatographer (Scion 456 GC with PVT injector and FID detector; Bruker, Bremen, Germany) which contained a column (30 m, 0.53 mm diameter, 210°C at 45°C/min; Stabilwax®-DA Columns, Restek, Buckinghamshire, UK) with an injector and detector at 250°C. Then, VFA concentrations were quantified and concentration peaks were integrated for accuracy using chromatogram (Compass Chromatography Data System, Bruker). Rumen fluid samples were analysed in duplicate with repeats if duplicate values were >5% variation. The proportion of individual VFA to the total VFA concentration (µmol/ml; sum of individual VFA) was calculated.
Rumen epithelial and stratum corneum thickness
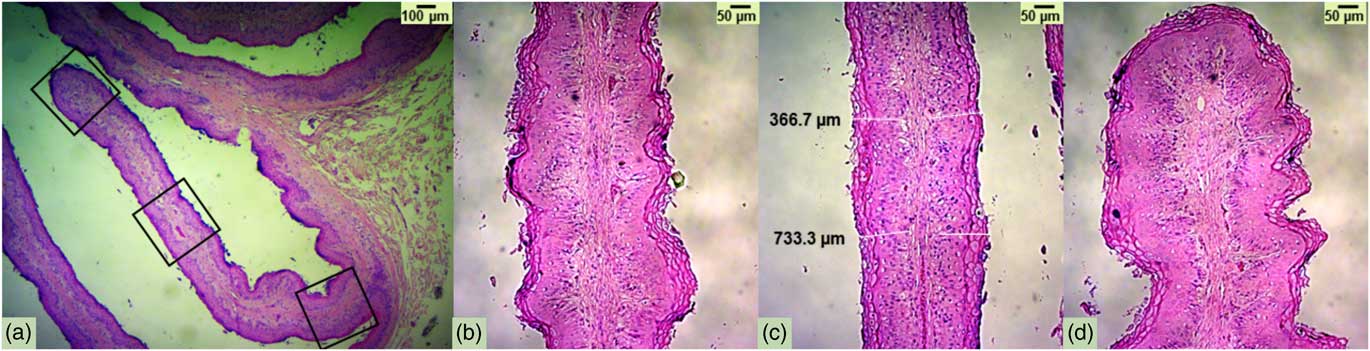
Embedded rumen tissue was sectioned at 5 µm thickness and stained using haematoxylin–eosin. Using a light microscope (Primo Star light microscope, Zeiss, Oberkochen, Germany), microscope image capturing camera (AxioCam ERc 5s; Zeiss) and software (AxioVision Rel. Version 4.8.2.0; Zeiss), eight papillae from each of the three sacs of each animal were micrographed in three histological areas, tip and middle and base (Figure 2). Using an image processing software (ImageJ Pro Software, US National Institutes of Health, Rockville, MD, USA), the parameters measured were distance from connective tissue to outer s. corneum (epithelial thickness) and inner s. corneum to outer s. corneum (s. corneum thickness). A total of four measurements of each parameter were performed on each micrograph consisting of two measurements on left and right sides of the papillae at 366.7 and 733.3 µm from the top of the image towards the centre on an 1100 µm height image (100× magnification). The epithelial thickness and s. corneum thickness values were averaged across the three regions of the papillae, after preliminary statistical analysis indicating a lack of difference between the tip, middle and base regions, in each rumen sac and across the three sacs for individual animals.
Longitudinal rumen papillae micrographs for epithelial and stratum corneum histomorphometry in beef cattle. Base, middle and tip areas (a); base (b); middle showing methodology used to perform epithelial and s. thickness measurements (c); and tip (d).

Statistical analysis
Data were analysed using SAS software v. 9.4 (SAS, Statistical Analysis System Institute, Cary, NC, USA). Using the UNIVARIATE procedure, variables were tested for normality based on the Anderson–Darling test, kurtosis and skewness. Specific measures were transformed to reach normality using natural logarithm (acidotic RpH range, on-farm isovalerate, at slaughter isovalerate and caproate, and all microbiology variables), square root (at slaughter isobutyrate), reciprocal (RpH slope, ventral sac s. corneum thickness and dorsal blind sac epithelial thickness) and squared transformations (feed intake for circadian intake, and ventral blind sac epithelial thickness). Data was back-transformed and presented with 95% confidence intervals (CI).
The GLM SELECT procedure was used for model selection based on Bayesian information criterion values. Adjusted means were then determined and compared, across animals classified by efficiency groups, the 50% most-feed efficient (efficient, with RFI⩽−0.23 kg/day, composed by 17 steers and seven bulls) and 50% least-feed efficient (inefficient, with RFI⩾−0.14, composed by 15 steers and nine bulls), using the selected model and the GLM procedure:
 $${\rm Y}_{{ijkl}} \, {\equals}\, \mu {\plus}{\rm efficiency}_{i} {\plus}{\rm subpopulation}_{j} {\plus}{\rm breed}_{k} {\plus}\epsilon _{{ijkl}} $$
where Y ijkl is the trait of interest measured on the l th animal, belonging to the i th efficiency group, μ is the overall mean for the trait, efficiency j is the fixed effect of the i th efficiency group, subpopulation is the fixed effect of the j th subpopulation, breed is the fixed effect of the k th breed, and ϵ ijkl is the residual random effect associated with the l th animal.
Means at specific time points on the predicted RpH and RT curves were compared using a two-tailed t test. Time point selection was based on the maximum and minimum value of the inflection points, and the calculated mid-points in between. A total of 12 vertical arrows representing RpH and RT pre-, during and post-prandial periods are shown in the Figure 1a and b. Results were considered significant when P⩽0.05, and a trend approaching significance when 0.05⩽P⩽0.10.
Results
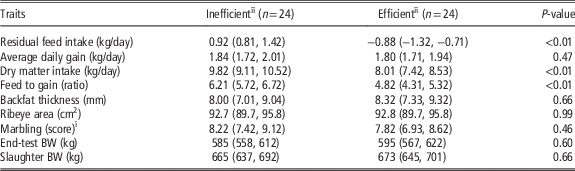
Table 1 shows the productive performance least square means for efficient and inefficient groups. The DMI for efficient cattle was 1.80 kg/day less and FG was 29% lower for efficient compared with inefficient animals, with no differences on BW and composition.
Feed efficiency group least square means for productive performance and ultrasound traits (mean (confidence interval))

i 1=devoid and 11=abundant.
ii Inefficient and efficient: residual feed intake ⩾−0.14 and ⩽−0.23 kg/day, respectively.
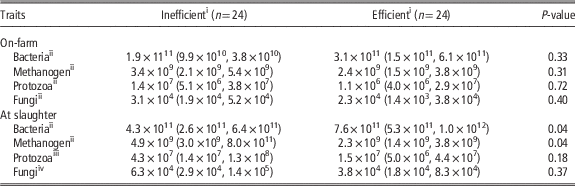
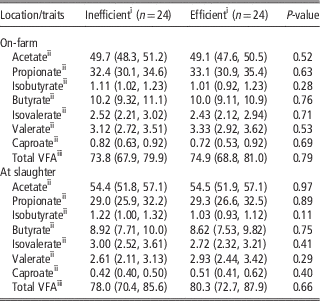
Comparisons of microbial profiles revealed that efficient cattle had greater total bacteria and lower methanogen concentrations compared with inefficient cattle at slaughter, whereas microbial profiles on-farm showed no differences between efficiency groups (Table 2). Likewise, VFA profiles on-farm and at slaughter did not differ between efficiency groups (Table 3).
Feed efficiency group least square means for rumen fluid microbiology assessed on-farm and at slaughter (mean (confidence interval))

i Inefficient and efficient: residual feed intake ⩾−0.14 and ⩽−0.23 kg/day, respectively.
ii Unit=16S rRNA copy number/ml rumen fluid.
iii Unit=18S rRNA copy number/ml rumen fluid.
iv Unit=internal transcribed spacer DNA.
Feed efficiency group least square means for rumen fluid volatile fatty acids (VFA) (mean (confidence interval)) measured on-farm and at slaughter

i Inefficient and efficient: residual feed intake ⩾−0.14 and ⩽−0.23 kg/day, respectively.
ii Unit=percent proportion of the total concentration of VFA.
iii VFA; unit=µmol/ml.
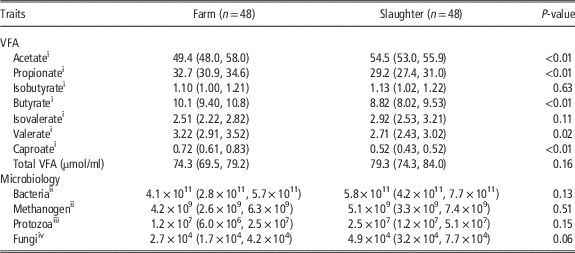
Microbiology and VFA profiles on-farm were compared with those at slaughter in Table 4. Acetate concentration was higher and propionate, butyrate, valerate and caproate concentrations were lower at slaughter compared with on-farm. Microbial profiles indicated a trend for increased (P⩽0.10) fungi at slaughter when compared with on-farm sampling.
Rumen fluid microbial and volatile fatty acid (VFA) profiles least square means collected on-farm and at slaughter (mean (confidence interval))

i Unit=proportion of total VFA.
ii Unit=16S rRNA copy number/ml rumen fluid.
iii Unit=18S rRNA copy number/ml rumen fluid.
iv Unit=internal transcribed spacer DNA.
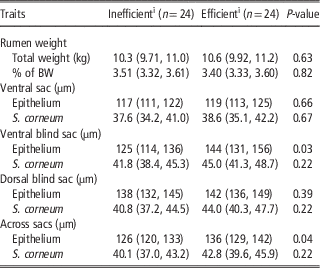
Table 5 presents the FEG least square means for rumen weight and histomorphometry. Although no differences were observed for rumen weight, observations from the micrographs revealed a thicker epithelium in the ventral blind sac and across the three sacs when comparing efficient to inefficient cattle.
Feed efficiency group least square means for rumen weight and thickness measures of the rumen epithelium and stratum corneum (mean (confidence interval))

i Inefficient and efficient: residual feed intake ⩾−0.14 and ⩽−0.23 kg/day, respectively.
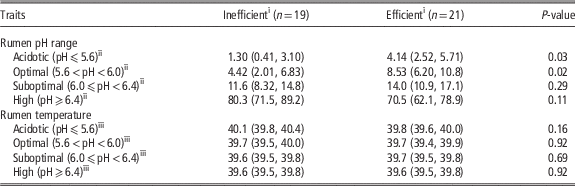
When evaluating the daily time spent in RpH ranges (Table 6), efficient cattle spent more daily time in both acidotic and optimal RpH ranges than inefficient cattle. There were no differences between efficiency groups in average RT across the RpH ranges. Predicted curves of RpH (Figure 1a) and RT (Figure 1b) indicate that RT predicted means of efficient and inefficient groups pre-, during and post-prandial did not differ. Conversely, RpH predicted means were lower for efficient compared with inefficient cattle at every time point selected for comparison. Observations of Figure 1a show a decrease in RpH after major increases in feed intake in the morning and evening, followed by an increase overnight. In addition, RT seemed to decrease during major feeding bouts and increase afterwards (Figure 1b). The difference in area under the RpH curve including and excluding feed intake as a covariate was 0.26% for efficient and 0.07% for inefficient animals. Similarly, the difference in area under the RT curve was 0.03% for efficient and 0.01% for inefficient animals.
Feed efficiency group least square means for rumen pH and temperature variables according to pH range (mean (confidence interval))

i Inefficient and efficient: residual feed intake ⩾−0.14 and ⩽−0.23 kg/day, respectively.
ii Average % time spent per day in rumen pH ranges.
iii Average rumen temperature (oC) during rumen pH ranges.
Discussion
Our study in feedlot cattle evaluated associations of rumen functional parameters with feed efficiency, with some parameters measured on-farm and at slaughter (microbial and VFA profiles). As a result, we identified ruminal function differences between feed efficient and inefficient cattle. These differences are not only important to understand the biology of feed efficiency, but also represent opportunities for developing proxies for feed efficiency and other complex traits related to rumen metabolism. Cattle performance traits revealed less daily DMI without affecting body size or composition when feeding feed efficient cattle. This represents savings of 216 kg/animal of DMI over a standard period of 120 days of feedlot phase, which reinforces the economic and environmental importance of improving feed efficiency. In addition, RFI, FG and DMI results are consistent with previous studies on feedlot cattle (Freetly and Brown-Brandl, Reference Freetly and Brown-Brandl2013; Montanholi et al., Reference Montanholi, Haas, Swanson, Coomber, Yamashiro and Miller2017).
Rumen bacteria are the primary source of VFA production, contributing to the majority of the ruminal degradative activity of feedstuff (Van Soest, Reference Van Soest1982) and were reported to have larger populations in efficient cattle herein when assessed at slaughter. Although our results are limited to total bacteria determination, other investigations also feeding typical feedlot rations (Guan et al., Reference Guan, Nkrumah, Basarab and Moore2008; Myer et al., Reference Myer, Smith, Wells, Kuehn and Freetly2015), agree with our findings and provide information about differences on specific bacteria that exist only in efficient cattle, supporting the association of rumen bacteria with feed efficiency.
The lack of associations between protozoa and fungi with feed efficiency agrees with the findings of Guan et al. (Reference Guan, Nkrumah, Basarab and Moore2008) and Carberry et al. (Reference Carberry, Kenny, McCabe and Waters2010). In the later, researchers observed changes in protozoa population according to dietary energy consumption independently of feed efficiency. Considering that fungi population are known to vary with high-fibrous diets (Wang and McAllister, Reference Wang and McAllister2002), our study and others (Guan et al., Reference Guan, Nkrumah, Basarab and Moore2008; Carberry et al., Reference Carberry, Kenny, McCabe and Waters2010) were not designed to evaluate the biology of the fungal species to large extent due to the limiting content of fibre in the diets. Of interest, we observed a trend for increased fungi population at slaughter in comparison to on-farm, which is probably due to the lack feeding before transportation, resulting in an increased content of fibrous material in the rumen content benefiting the fungi population.
Methanogens produce the undesirable products methane and CO2 (Van Soest, Reference Van Soest1982) which are positively associated with methanogen population size (Popova et al., Reference Popova, Morgavi and Martin2013). Our study revealed lower methanogen population size in efficient cattle at slaughter, whereas Zhou et al. (Reference Zhou, Hernandez-Sanabria and Guan2009) observed no association of methanogen population size with feed efficiency. Although our results suggest that total methanogen population size variation exists across efficiency groups which may impact methane emissions; further insights on microbial population structure is necessary to determine the impact on methane emissions as changes in the population structure of microorganisms can affect methane production (Popova et al., Reference Popova, Morgavi and Martin2013).
Energetic products from microbial fermentation constitute the majority of total metabolic energy available to ruminants (Bergman, Reference Bergman1990). Fitzsimons et al. (Reference Fitzsimons, Kenny, Deighton, Fahey and McGee2013), feeding grass-silage to beef heifers, and McDonnell et al. (Reference McDonnell, Hart, Boland, Kelly, McGee and Kenny2016), feeding corn-silage-based ration also to beef heifers, found no differences in VFA concentrations between efficiency groups which is consistent with the current study. In contrast, higher butyrate and valerate concentrations have been observed in efficient compared with inefficient cattle (Guan et al., Reference Guan, Nkrumah, Basarab and Moore2008). As microbial community adjustments to diets are specific and influence VFA concentration (Tajima et al., Reference Tajima, Aminov, Nagamine, Matsui, Nakamura and Benno2001), further research on VFA profile across a wide range of diets and divergent population of cattle for feed efficiency is needed to understand the association of VFA and microbial profiles with feed efficiency.
Substantial differences in multiple rumen VFA concentrations were found when comparing profiles on-farm and at slaughter. Commonly, cattle undergo extensive saliva polyrrhea during or after transportation stress (Hogan et al., Reference Hogan, Petherick and Phillips2007). Studies have observed increased post-transportation VFA concentrations in cattle and throughout refeeding compared with non-transported cattle after 32 h of fasting (Galyean et al., Reference Galyean, Lee and Hubbert1981). Stress responses may reflect poor VFA transport or absorption rates and increases in rumen fluid volume by saliva inflow in cattle under transport stress and may be responsible for differences in VFA concentrations. In addition, specific bacterial species concentrations vary after transport stress (Xu et al., Reference Xu, Wang, Cong, Zhou, We and Deng2014), and total bacteria and protozoa concentration recovery post-refeeding is slower for post-transport compared with non-transport cattle (Galyean et al., Reference Galyean, Lee and Hubbert1981). These changes on rumen microbiology in response to transportation may also be related to the associations observed of total bacteria and methanogens and feed efficiency in our study.
Acetate concentration was greater at slaughter compared with on-farm which may be due to the lack of morning feeding before slaughter, as cattle had major feeding bouts shortly after re-filling the feeders at 0830 h (Figure 1). Differently from our results, Zhang et al. (Reference Zhang, Albornoz, Aschenback, Barreda and Penner2013) did not observe differences in the acetate concentration in the rumen fluid. However, these authors identified a decline in the absorption of acetate upon limiting feed intake for 5 days. Moderate feed restriction may limit epithelial absorption by reducing acetate-related metabolism, reducing the demand for epithelial transport (Aschenbach et al., Reference Aschenbach, Bilk, Tadesse, Stumpff and Gäbel2009). Therefore, the rumen VFA profiles may be influenced by time of feeding (Warner, Reference Warner1966) and physiological responses related to transport stress (Bourgon et al., Reference Bourgon, Diel de Amorim, Miller and Montanholi2017).
Studies comparing fed and fasting metabolism indicated decreased rumen epithelial thickness in fasted cattle (Lima et al., Reference Lima, Resende-Junior, Costa, Daniel, Teófile and Cardoso2015) also featured at organelle level (Tamate et al., Reference Tamate, Kikuchi and Sakata1975). As feed efficient cattle consume less feed, one could expect rumen functional and structural features more alike to animals experiencing feed restriction. However, there is evidence supporting a more active gastrointestinal tract and liver related to improved feed efficiency. From a molecular perspective, Kern et al. (Reference Kern, Lindholm-Perry, Freetly, Kuehn, Rule and Ludden2016) reported genes associated with feed efficiency, supporting relationships of metabolic activity and rumen epithelium function and structure. The rumen epithelium is abundant in mitochondria (Tamate et al., Reference Tamate, Kikuchi and Sakata1975) powering the epithelial metabolism. Thus, an increase in epithelial thickness suggests greater metabolic and functional activity in the papillae epithelium (Tamate and Fell, Reference Tamate and Fell1977). Similarly to our study, histomorphometrical findings in the small intestine (Montanholi et al., Reference Montanholi, Fontoura, Swanson, Coomber, Yamashiro and Miller2013) and liver (Montanholi et al., Reference Montanholi, Haas, Swanson, Coomber, Yamashiro and Miller2017) support an increased functional workload in relation to superior feed efficiency.
The RpH circadian pattern observed is consistent with continuous RpH measurements in previous studies (Kimura et al., Reference Kimura, Sato, Kato, Ikuta, Yamagishi, Okada, Mizuguchi and Ito2012). The nonsignificant difference in area under the curve for RpH and RT, including and excluding feed intake, supports that circadian RpH and RT differences between efficiency groups are based on variation in metabolism, rather than differences in feed intake between efficient and inefficient cattle. This observation has practical relevance as a possibility to evaluate RpH and RT without recording feed intake at a high frequency.
Studies have shown no differences in RpH between efficiency groups when measured by collecting rumen fluid orally pre- (McDonnell et al., Reference McDonnell, Hart, Boland, Kelly, McGee and Kenny2016) and post-prandial (Fitzsimons et al., Reference Fitzsimons, Kenny, Deighton, Fahey and McGee2013) using an RpH metre. However, Fitzsimons et al. (Reference Fitzsimons, Kenny, Fahey and McGee2014) revealed lower RpH in inefficient cattle from rumen samples post-prandial. In contrast, our study revealed efficient cattle maintained a consistently lower RpH (either at the acidotic or optimal ranges) not only during the post-prandial period, but also before and during major eating bouts compared with inefficient cattle. This observation supports the continuous RpH monitoring, rather than spot sampling, as an indicator for rumen metabolic efficiency. This evidence of direct association between RpH and feed efficiency requires further investigation to understand the biology underlying this lower pH and also potential repercussions on metabolic diseases and individual suitability to distinct feeding regimes.
Despite the similarity of the circadian RT with other studies (Kimura et al., Reference Kimura, Sato, Kato, Ikuta, Yamagishi, Okada, Mizuguchi and Ito2012), this measure failed to discriminate feed efficiency phenotypes. Of general interest, Figure 1b illustrates the post-prandial thermal increment of fermentation and the cooling effect of feeding, which were described previously (Walker and Forrest, Reference Walker and Forrest1964; Van Soest, Reference Van Soest1982). The RT may have other applications within precision livestock farming.
Conclusion
The characterization of rumen parameters has shown efficient cattle have more bacteria and less methanogens at slaughter, increased rumen epithelium thickness, greater capacity to maintain lower RpH throughout the day and no differences in VFAs compared with inefficient cattle. In addition, the independency of the variability on feed intake per se over the circadian period in the determination of RpH, supports the metabolic differences between cattle diverging in feed efficiency. Divergences between assessments made on-farm and at slaughter were observed on rumen microbiota and VFAs profiles. This study has identified potential biomarkers for feed efficiency, which could be applied in precision livestock farming and enable the generation of phenotypes for feed efficiency. Research on dietary manipulation, other animal types and alternative assessments of the ruminal function are warranted.
Acknowledgements
The authors acknowledge the financial support provided by Beef Cattle Research Council, Agriculture and Agri-food Canada, Agriculture Adaptation Council, Beef Farmers of Ontario, and Ontario Ministry of Agriculture, Food, and Rural Affairs.