I. INTRODUCTION
The development of clean and sustainable energy storage and conversion systems is crucial to solve energy and environment issues around the globe. Reference Simon and Gogotsi1 Supercapacitor as a typical device has received great attention since some attractive properties such as high power density, fast charge/discharge (CD) rate, and long cycle life, allow them expansive applications in portable electronic devices and hybrid electric vehicles. Reference Wang and Xia2,Reference Devillers, Jemei, Péra, Bienaimé and Gustin3 So, the controllable fabrication of ideal electrodes with low diffusion resistance of electrolytes, high-rate transportation, and high accessible active area, necessarily becomes a research focus as well as a technological challenge. Reference Lahiff, Woods, Blau, Wallace and Diamond4
Polyaniline (PANI) based on redox pseudocapacitive charge storage mechanism is considered as one of the leading electrode materials because of its versatile and economic preparation method, nontoxic property, high environmental stability, relatively high capacitance, and reversible doping/dedoping process. Reference Stejskal, Sapurina and Trachová5–Reference Ramya, Sivasubramanian and Sangaranarayanan7 Currently, various PANI micro/nanostructures including wires/fibers/tubes/rods/hollow capsules/flowers/tetragonal stars/belts/sheets depending on synthetic means have been reported. Reference Chen, Rakhi and Alshareef8–Reference Zhao, Bai, Hu, Li, Qu, Zhang and Shi18 For instance, cyclodextrin-templated “hairy urchin”-shaped PANI was synthesized by microemulsion polymerization. Reference Prasannan, Truong, Hong, Somanathan, Shown and Imae19 By varying the monomer concentration and the feeding ratio of dichloroacetic acid to aniline, the evolution of PANI shape from one-dimensional (1D) nanotubes to three-dimensional (3D) nanofiber networks was explored. Reference Wang and Lu20 A hybrid asymmetric supercapacitor using polypyrrole and PANI as electrodes exhibited high specific energy and specific power values of 22.87 Wh kg−1 and 570 W kg−1, respectively, at 5 mA cm−2, with better cycling stability. Reference Ghenaatian, Mousavi and Rahmanifar21
Among developed synthetic approaches, Reference Huang and Kaner22–Reference Han, Chu, Yang, Liu and Lv30 reverse microemulsion (water-in-oil, W/O) technique is powerful in controlling the size, morphology, and dispersity of materials. Reference Kumar, Singh, Aggarwal and Kumar27–Reference Han, Chu, Yang, Liu and Lv30 For example, organic dispersible PANI nanoparticles having diameters of 40–60 nm were produced in a dodecylbenzenesulfonic acid/hexane/water reversed micelle system. Reference Han, Kusunose and Sekino31 Fabrication of fibrous PANI via electrochemical polymerization in Trion X-100/n-hexane/n-hexanol/water electrolyte was reported. Reference Hu, Tu, Jiao, Hou, Zhu and Fray32 Nevertheless, microemulsion-mediated solvothermal approach that may lead to the formation of special structure is rarely applied in previous reports on PANI. Accordingly, in the present work we attempt to produce new PANI architectures with this strategy. As expected, unique cluster-connected networks of superfine wires (∼15 nm) were successfully prepared for the first time. Having in mind the importance of the morphology and doping level in governing the electrochemical performance of the sample, the influence of synthetic method and dopant/monomer molar ratio was studied. Besides, the capacitive behavior of the resultant PANI electrode was systematically examined with the aid of various electrochemical techniques.
II. EXPERIMENT
For removing the oxidation impurities, aniline (AN) monomer was purified by distillation. All other chemicals were of analytical grade and used without further treatment. Typically, cetyltrimethylammonium bromide (CTAB, 8.4 g) was ultrasonically dispersed to the mixture of 130 mL cyclohexane and 6.5 mL n-hexanol for 30 min at room temperature, followed by the addition of 1.3 mL AN monomer. After being stirred for 2 h in an ice–water bath, 22 mL precooled aqueous solution of the initiator ammonium persulfate (APS, 2.9 g) and the dopant camphorsulfonic acid (CSA, 6.7 g) was slowly added into the monomer-containing oil phase dropwise under magnetic stirring, producing a reverse microemulsion system that was similar to that described earlier. Reference Cui, Zhou, Shi, Zhong and Mi33 After that, the mixed solution was transferred into two 100 mL stainless Teflon-lined autoclaves (75% filling) and heated for 6 h at 130 °C to yield dark-green precipitates. The resulting PANI was obtained by filtering, washing, and drying under vacuum for 24 h at 60 °C. To investigate the effect of the dopant/monomer molar ratio on PANI morphology and structure, samples with different molar ratios of CSA to AN (2:1, 1:1, 0.5:1, and 0.25:1) were synthesized. Also, contrast experiments were respectively carried out by conventional chemical oxidation method (only reaction temperature was set at about 0 °C, while other synthetic parameters were not changed) and conventional hydrothermal method (only organic solvents were replaced by deionized water) to well understand the formation of special morphology and the correlation between microstructure and performance.
The morphologies of the products were observed on a SUPRA 55VP field-emission scanning electron microscope (FESEM; Carl Zeiss, Oberkochen, Germany) and a HITACHI-600 transmission electron microscope (TEM; Hitachi Co., Tokyo, Japan). Infrared spectrum (IR) was recorded on a BRUKER-EQUINOX-55 spectrometer (Bruker AXS GmbH, Karlsruhe, Germany). X-ray diffraction (XRD) measurement was conducted in the 2θ range of 10–80° on a BRUKER D8 Advance x-ray diffractometer (Bruker AXS GmbH, Karlsruhe, Germany) with a Cu Kα target.
Electrochemical measurements were carried out on a CHI660 electrochemical workstation in a potential range of −0.2 to 0.8 V. A conventional three-electrode system was equipped with the working electrode, platinum counter electrode, and saturated calomel reference electrode in 1 M H2SO4 electrolyte. The working electrode was made as follows. The homogeneous slurry containing PANI, acetylene black, and polytetrafluoroethylene (80:10:10 wt%) in ethanol was prepared by ultrasonic treatment for about 15 min. The slurry was then dried and roll-pressed into a thin sheet. Afterward, the sheet was cut into a small sheet (0.5 cm2) and pressed on carbon paper as a current collector. The loading density of active material (PANI) was about 3.0 mg cm−2.
III. RESULTS AND DISCUSSION
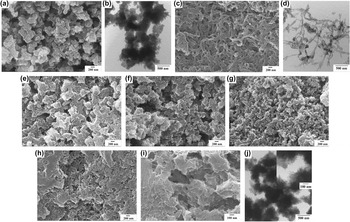
To study the influence of polymerization method on the morphology, typical SEM and TEM micrographs of various PANI prepared by different methods are presented in Fig. 1. Clearly, PANI obtained by conventional chemical oxidation method has an irregular particle-like shape with ∼100–200 nm in diameter [Figs. 1(a) and 1(b)]. For PANI produced by hydrothermal route, a nanofiber-like structure of ∼60 nm in diameter is obtained [Figs. 1(c) and 1(d)]. When using microemulsion-mediated solvothermal approach, the morphology of PANI is quite different from those of the above two samples. As revealed in low- and high-magnified SEM images [Figs. 1(e) and 1(i)], PANI with CSA/AN molar ratio of 2:1 consists of clusters of self-aggregated nanowires (∼15 nm in diameter), and these clusters attach to each other, leading to extended networks with porous structure. The pores between clusters are clearly visible and its size is estimated to be ∼200–500 nm, while the size of those in clusters is difficult to estimate due to the aggregation of many nanowires. TEM images [Fig. 1(j) and its inset] are basically consistent with the results of SEM images. The formation of regular clusters is probably due to the presence of spatially constrained microreactors resulted from the W/O system. Such a successive assembly with attractive features such as nanosize effect, porosity, and three-dimensional conductive channels may endow PANI with relatively good electrochemical performance during doping/dedoping processes. By reducing the CSA/AN molar ratio from 2:1 to 0.25:1, the size of the clusters decreases [Figs. 1(e)–1(h)], resulting in heavy aggregation of PANI clusters [Fig. 1(h)]. This tendency might be attributed to the decline of steric hindrance between PANI chains presumably caused by the decrease in the amount of CSA doped in the PANI chains.
(a) SEM and (b) TEM images of PANI synthesized by conventional chemical oxidation method with the CSA/AN molar ratio of 2:1. (c) SEM and (d) TEM images of PANI synthesized by hydrothermal method with the CSA/AN molar ratio of 2:1. (e–i) SEM and (j) TEM images of PANI synthesized by microemulsion-mediated solvothermal method with different CSA/AN molar ratios: (e, i, j) 2:1; (f) 1:1; (g) 0.5:1; and (h) 0.25:1. The inset is the magnified TEM image of PANI with a CSA/AN ratio of 2:1.

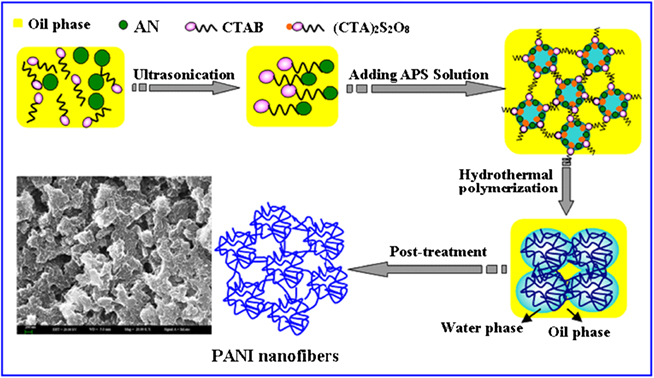
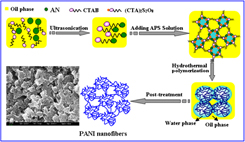
A probable formation mechanism for the favored cluster-linked configuration is depicted in Fig. 2. Firstly, the surfactant CTAB and the monomer AN are ultrasonically dispersed into the mixture of cyclohexane and n-hexanol for about 30 min and then magnetically stirred for 2 h in an ice–water bath, generating a uniform oil system with AN adsorbed on CTAB chains. Next, the precooled initiator (APS) aqueous solution is added into the aniline-containing oil phase to form a homogeneous and stable W/O system in an ice–water bath, where dispersive water phase and continuous oil phase are linked by polar and nonpolar sides of the surfactant (CTAB) molecules toward inside and outside, respectively. In a short time, white (CTA)2S2O8 precipitates form in the oil–water interface, accompanied by the migration of AN from organic phase to the interface. Then, the mixture solution is heated in the autoclave for 6 h at 130 °C. Under solvothermal condition, AN is firstly polymerized into oligomeric aniline intermediates in the initiator-containing interface, and then these oligomers continue to polymerize toward water phase. That is to say, homogeneously dispersed water droplets functioned as microreactors provide some space for chemical polymerization of AN and further growth of CSA-protonated PANI. In general, the surfactant concentration higher than critical micelle concentration (cmc, 0.87 mM) would favorably generate fiber-like or wire-like PANI during polymerization process. Reference Wang, Zhong, Ning, Wang and Yang34,Reference Fu, Xiao, Yao and Yang35 As a result, in a kinetically stable system with a certain degree of pressure, PANI nanowires form and aggregate into clusters within the confined space, and further develop into a unique cluster-linked porous morphology.
Proposed mechanism to fabricate interconnected clusters assembled from nanowires.

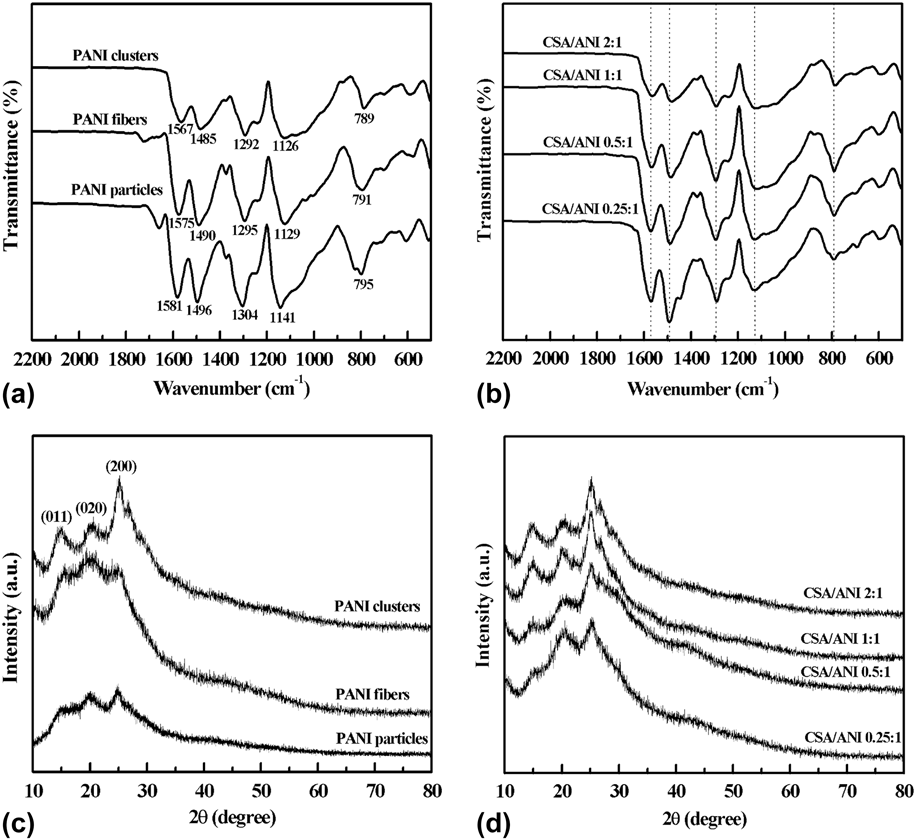
Typical IR spectra of PANI synthesized by different methods are firstly displayed to investigate their molecular structures. As shown in Fig. 3(a), all samples exhibit similar absorption bands of doped PANI, such as the C=C stretching of quinoid ring (Q) (1567–1581 cm−1), the C=C stretching of benzenoid (B) ring (1485–1496 cm−1), C–N stretching of the secondary aromatic amine (1292–1304 cm−1), and N=Q=N stretching (1126–1141 cm−1). Besides, the bands for –SO3H group of CSA are observed at ∼1034 and ∼590 cm−1, Reference Weng, Lin, Chen and Zhou36–Reference Wu, Chen, Zhu, Yao and Guo38 respectively, confirming the successful doping of CSA into PANI chains. On the other hand, compared with those of PANI fibers and particles, main absorption bands of PANI clusters shift toward low wavenumber direction (red shift), implying that PANI clusters with the CSA/AN molar ratio of 2:1 may possess relatively high electrical conductivity. Reference Stejskal, Sapurina, Trchová, Prokeš, Křivka and Tobolková39 IR spectra of PANI with different CSA/AN molar ratios are further presented in Fig. 3(b). Although these samples show similar characteristic bands, their Q/B intensity ratios (R) have some slight change. Generally, R value can be used to estimate the oxidation level of PANI, and a value of 1.0 means that the as-made PANI has an emeraldine structure with relatively high conductivity. Reference Huang, Wen and Gopalan40 In various PANI obtained, as the molar ratio increases from 0.25:1 to 2:1, the Q/B intensity ratio (R) increases from 0.87 to 0.97, implying that PANI with the molar ratio of 2:1 is near a half-oxidized state (conductive emeraldine form). The crystallinity of PANI made by different methods is checked by XRD pattern. Figure 3(c) shows that all samples exhibit three reflection peaks at 15.1°, 20.3°, and 25.7°, corresponding to the repeat unit of PANI chain, the periodicity parallel and perpendicular to the polymer chain, respectively. The peaks of PANI clusters are stronger and sharper than those of PANI fibers and particles, suggesting that PANI produced by microemulsion-mediated solvothermal method has obvious crystalline character and high doping level. Reference Abdiryim, Zhang and Jamal41 Further, XRD patterns of PANI with different CSA/AN molar ratios are presented in Fig. 3(d). With the increase of the molar ratio from 0.5:1 to 1:1, the crystalline peaks of PANI are more prominent. However, by continuously increasing the ratio up to 2:1, no obvious change in crystallinity occurs. Thus, PANI samples with CSA/AN molar ratios of both 2:1 and 1:1 are deduced to have more ordered structure and thus exhibit higher crystallinity, which is probably attributed to the orientation of the dopant in the side of PANI chain. Reference Lużny and Bańka42
(a) IR spectra and (c) XRD patterns of PANI clusters, fibers, and particles synthesized by conventional chemical oxidation method, conventional hydrothermal method, and microemulsion-mediated solvothermal method. In the reaction system, the CSA/AN molar ratio for these samples is 2:1. (b) IR spectra and (d) XRD patterns of PANI clusters with the CSA/AN molar ratio varying from 2:1 to 0.25:1.

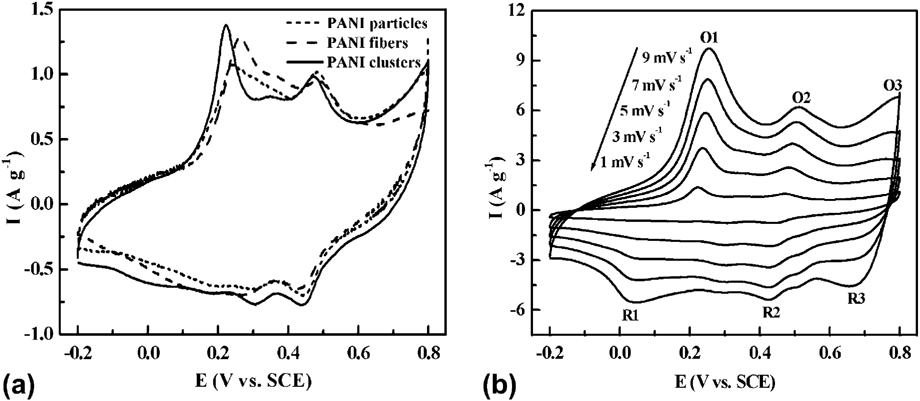
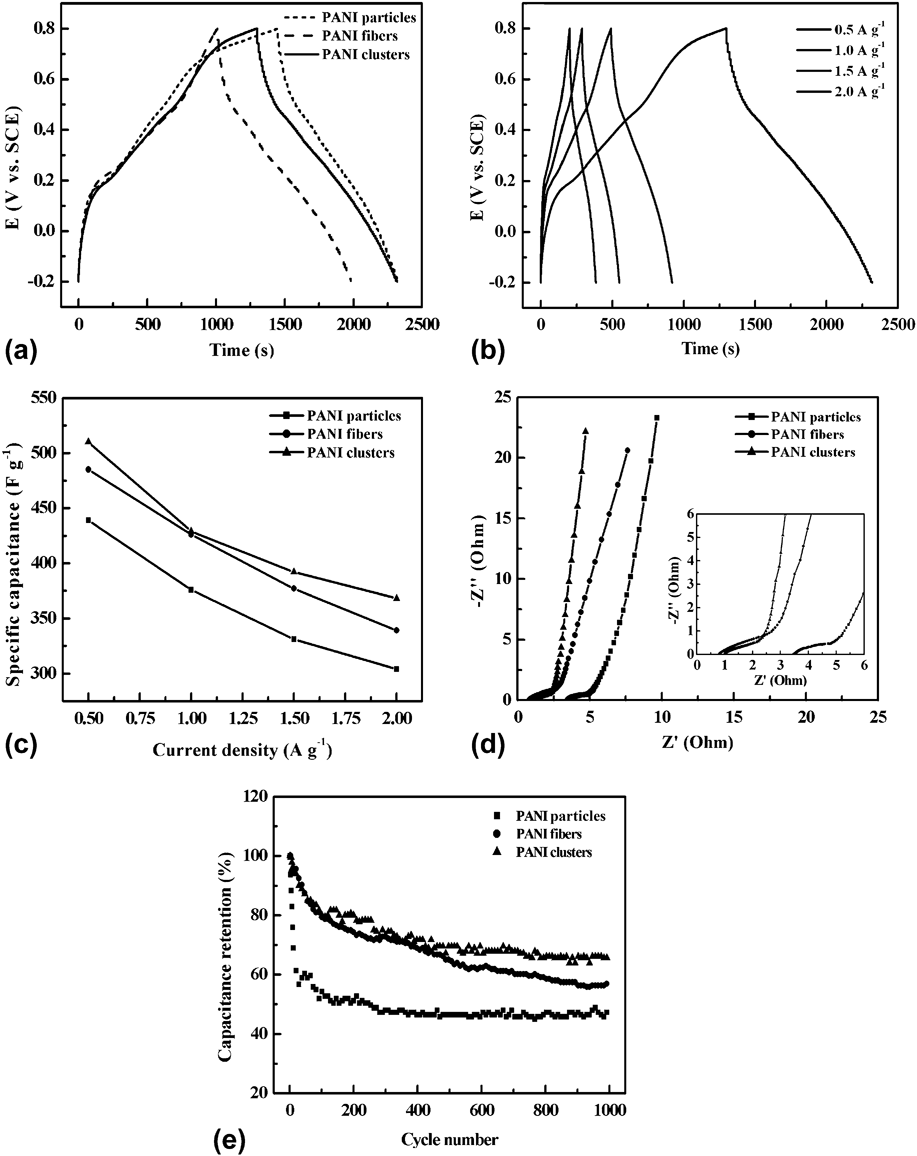
The electrochemical evaluation of PANI obtained by different methods is performed by cyclic voltammetry (CV), CD, electrochemical impedance, and cycling stability tests in 1 M H2SO4 electrolyte between −0.2 and 0.8 V [Figs. 4 and 5]. Figure 4(a) displays CV curves of PANI clusters, fibers, and particles at a sweep rate of 1 mV s−1. These samples have non-rectangular CV curves with obvious redox peaks, and PANI clusters deliver the highest peak current and the largest CV area. The results clearly indicate that all PANI samples have a typical pseudocapacitive character, and PANI clusters may possess higher redox switching rate and higher specific capacitance than PANI fibers and particles. CV curves of PANI clusters at different sweep rates are displayed to understand the reaction mechanism of PANI during electrochemical process. In Fig. 4(b), as the sweep rate increases, no obvious distortion is seen in CV curves with three redox couples (P1/Q1, P2/Q2, and P3/Q3), indicative of good electrochemical reversibility of PANI clusters. Moreover, the increase of sweep rate leads to the obvious increase in peak current. For example, the peak currents at P1 are 1.47, 3.82, 5.90, 7.86, and 9.74 A at scan rates of 1, 3, 5, 7, and 9 mV s−1. Thus, PANI clusters are suggested to have relatively good rate performance. As for redox reaction mechanism of PANI, it can be explained by the following electrochemical processes. The first redox process occurs at 255/35 mV (P1/Q1 peaks), corresponding to the transition between fully reduced leucoemeraldine (LEB, semiconductive state) and partially oxidized emeraldine (EB, conductive state). The second process around 512/425 mV (P2/Q2 peaks) is associated with the degradation of PANI salts. Reference Abdiryim, Zhang and Jamal41,Reference Duić, Mandić and Kovač43 The third process (P3/Q3 peaks at 790/682 mV) is due to the transition between the emeraldine and fully oxidized pernigraniline (PEB, deprotonated, state).
(a) CV curves of PANI clusters, fibers, and particles at a sweep rate of 1 mV s−1 in 1 M H2SO4 electrolyte. (b) CV curves of PANI clusters at different sweep rates.

(a) Galvanostatic charge–discharge curves of PANI clusters, fibers, and particles at a current density of 0.5 A g−1 in 1 M H2SO4 electrolyte. (b) Galvanostatic charge–discharge curves of PANI clusters at different current densities. (c) Specific capacitances of three samples at different current densities. (d) The Nyquist plots of three samples at the open circuit condition in the frequency range from 105 to 10−2 Hz. The inset is an enlarged view of the Nyquist curves. (e) Cycling performance of three samples at 2 A g−1 over 1000 cycles.

Figure 5(a) depicts galvanostatic CD curves of PANI clusters, fibers, and particles at a current density of 0.5 A g−1. Their specific capacitances can be calculated from discharge curves using the following equation:
 $${C_{\rm{m}}} = {C \over m} = {{I \times \Delta t} \over {\Delta V \times m}}\quad ,$$
where C m, I/m, Δt, and ΔV represent the specific capacitance (F g−1), the CD current density (A g−1), the discharge time (s), and the potential window (V), respectively. The C m values of PANI clusters, fibers, and particles are 510, 485, and 439 F g−1 at a current density of 0.5 A g−1. For PANI clusters, its improved specific capacitance may be attributed to unique hierarchical structure and high doping extent, which allows relatively high transport rate of ions and electrons in the electrode. Galvanostatic CD curves of PANI clusters at various current densities are displayed in Fig. 5(b). With the increase in current density, the discharge time reduced, implying a decline in specific capacitance. The decline may be attributed to the incomplete utilization of active materials resulted from electrolyte ions mainly reaching the outer surface of the electrode instead of immigrating into its interior at high current density. Reference Cao, Yang, Wang, Yan, Yao, Ma, Wang, Zhang and Liu44 The relationship between specific capacitance and current density is shown in Fig. 5(c). Specific capacitances of all electrodes exhibit a decline tendency with increasing current density. When the current density reaches 2 A g−1, C m values of PANI clusters, fibers, and particles remain 368, 339, and 304 F g−1, respectively. Accordingly, the electrode made of PANI clusters has relatively good rate capability.
Nyquist plots of three electrodes in the frequency range of 105 to 10−2 Hz are depicted in Fig. 5(d). All plots consist of a single depressed semicircle in the high-frequency region and a near straight line in the low-frequency region. The diameter of the semicircle reflects the charge-transfer resistance (R ct). R ct values of PANI clusters, fibers, and particles are estimated to be 1.20, 1.46, and 1.28 Ω, respectively. Their corresponding internal resistance (R s) values can be observed in high frequency intercept of the real axis [the inset of Fig. 5(d)], which are 1.02, 0.82, and 3.51 Ω. In the low-frequency region, a line near vertical to the real axis usually indicates that this electrode has good capacitive behavior. By comparison, PANI clusters have good capacitive performance with low R ct and R s values.
The cycling performance of three electrodes at 2 A g−1 over 1000 cycles is presented in Fig. 5(e). The capacitance retention of PANI clusters is 66% after 1000 cycles, which is higher than those of PANI fibers (57%) and particles (46%), respectively. Structural benefits may be responsible for the enhanced electrochemical stability of PANI clusters. The comparison with the results of pure PANI reported elsewhere Reference Jiang, Ma and Li45–Reference Li, Raji, Fei, Yang, Samuel and Tour48 further illustrates that PANI clusters have relatively good cycling stability.
IV. CONCLUSIONS
This work highlights that microemulsion-mediated solvothermal method can achieve the fabrication of PANI as an unusual 3D hierarchical network structure with interconnected clusters assembled from nanowires. To understand the formation of this structure, a probable mechanism is pointed out. Electrochemical tests demonstrate that PANI clusters can achieve high specific capacitance (510 F g−1 at 0.5 A g−1), good rate capability, and enhanced cycling stability (66% over 1000 cycles) as compared to PANI fibers and particles, indicating the potential of PANI clusters in supercapacitors. Furthermore, this space-confined polymerization approach may find the applications in the fabrication of other functional PANI-based nanocomposites with improved performance, which will be our future work.
ACKNOWLEDGMENTS
Financial support from the Scientific Research Program of the Higher Education Institution of XinJiang (No. XJEDU2012I05), and National Natural Science Foundation of China (No. 21363023 and No. U1203292) is acknowledged.