1. Introduction
The complexities of the climate–economy interrelationship have made it difficult to assess the impacts of climate change. Economic impacts of climate change occur through affecting the productivity of the factors of production. Although the link between temperature and productivity is mentioned in the classic writings of Montesquieu (Reference Montesquieu1750), Marshall (Reference Marshall1890) and Huntington (Reference Huntington1915), among others, it is less discussed in the literature on the impacts of climate change (Dell et al., Reference Dell, Jones and Olken2012). The present paper is intended to address this gap by measuring the relationship between climate change, measured as an average temperature over the last 30 years, and the cumulative total factor productivity (TFP) of 88 countries between 1994 and 2008.Footnote 1
The costs of carbon abatement and the impact of abatement on productivity are likely to vary across countries due to: differences in technology, which influences the productivity of inputs; differences in resource availability that influence the mix of energy, capital and labor used by these countries; and differences in public policies/pressures to improve environmental quality. This study intends to quantify these costs of abatement and impacts on productivity by measuring productivity under different scenarios such that: carbon emissions are not regulated (i.e., strong disposability of CO2 emissions); and these emissions are regulated (i.e., weak disposability of CO2 emissions). The paper will provide insight into the extent to which diffusion of technological progress and innovations can be relied upon to mitigate carbon emissions and on the validity of concerns about the economic impact of carbon abatement (Kumar and Khanna, Reference Kumar and Khanna2009).
Moreover, it is thought that institutions determine incentive structure in an economy and shape the direction of economic growth (North Reference North1991). In the empirical literature on economic growth, Acemoglu et al. (Reference Acemoglu, Johnson and Robinson2001, Reference Acemoglu, Johnson, Robinson and Thaicharoen2003) and Acemoglu and Johnson (Reference Acemoglu and Johnson2005) find that the growth rate is higher in those countries that have better institutions, measured in terms of property and contracting rights. Institutions determine choices and provide incentives, and are therefore important in lowering the vagaries of climate change measured in terms of climate change impacts and mitigation costs. This paper intends to address this question by measuring the relationship between productivity measures, adjusted for the regulation of carbon emissions, and institutions, together with climate change variables.
We find that productivity growth is occurring in both developed and developing countries, and the divergence in productivity growth helps to explain the growing inequalities across countries. Although there is higher potential for reduction of CO2 emissions in developing countries at a lower cost, the cost to reduce emissions lowers the growth potential of these countries in terms of lost productivity growth. Under strong disposability, better property rights help lower the impacts of climate change on developing countries by improving the process of technological adoption. Climate change lowers the productivity growth in developing countries by lowering the process of technological adoption, and better property and contracting rights result in higher productivity.
The paper is organized as follows: section 2 provides a brief sketch of the related literature on productivity measurement, climate change impacts and the role of institutions. This section also describes the empirical strategy followed in the paper. Section 3 presents the productivity results. Section 4 presents the regression results related to the impacts of climatic and institutional factors on the productivity measures. Concluding remarks are provided in section 5.
2. Background and empirical strategy
There are three areas of literature related to the present paper: literature on the measurement of efficiency and productivity under strong and weak disposability of CO2 emissions; literature on the impacts of climate change on economic activities; and literature on the role of institutions in economic growth and sustainable development.
There are several studies on the measurement of efficiency and productivity changes at micro and macro levels that produce desirable and undesirable outputs simultaneously during the production process. Some of these studies have treated the undesirable outputs as inputs,Footnote 2 whereas others have treated them as a synthetic output such as pollution abatement (e.g., Gollop and Roberts Reference Gollop and Roberts1983). Murty and Russell (Reference Murty and Russell2002) noted that the treatment of undesirable outputs as inputs is inconsistent with the material balance approach. The approach adopted by Gollop and Roberts to treat the reduction in undesirable output as desirable output creates a different nonlinear transformation of the original variable in the absence of base-constrained emission rates (Atkinson and Dorfman, Reference Atkinson and Dorfman2005). To overcome this problem, Pittman (Reference Pittman1983) proposed that desirable and undesirable outputs should be treated non-symmetrically. Following Chung et al. (Reference Chung, Färe and Grosskopf1997), we use the directional output distance function to calculate production relationships involving desirable and undesirable outputs while treating them asymmetrically.Footnote 3 We also refer to Halkos and Tzeremes (Reference Halkos and Tzeremes2013b), who investigated the CO2 emissions governance relationship in a nonparametric context.
This analysis was undertaken for a set of 88 countries including 26 developed countries and 62 developing countries for the period 1994–2008. In the absence of direct data on the costs of carbon abatement, we relied on a distance function approach. This approach recognizes pollution as an undesirable output that is not freely disposable; rather, it is weakly disposable; that is, some productive resources have to be given up in order to reduce the level of pollutants. The extent to which a country would need to sacrifice its desirable output to reduce pollution represents its opportunity cost of pollution reduction, referred to here as environmental efficiency (EE). Countries that are less constrained are considered to be more environmentally efficient because they have chosen a more appropriate mix of desirable outputs, undesirable outputs and inputs.
Studies on the economic impacts of climate change can be put into three categories: sectoral studies, studies using integrated assessment models (IAM), and econometric studies trying to establish a direct link between income and climate change variables. Sectoral studies examine climate's role in specific sectors, primarily agriculture (Mendelsohn et al., Reference Mendelsohn, Nordhaus and Shaw1994; Schlenker et al., Reference Schlenker, Hanemann and Fisher2006; Deschênes and Greenstone, Reference Deschênes and Greenstone2007; Maddison et al., Reference Maddison, Manley and Kurukulasuriya2007) and health (Bosello et al., Reference Bosello, Roson and Tol2006), and then attempt to construct an overall prediction of climate change impacts by aggregating these sectors. Faced with these different sectoral channels, the IAM approach takes some of these channels, specifies their effects and then adds them up (e.g., Mendelsohn et al., Reference Mendelsohn, Morrison, Schlesinger and Andronova2000; Nordhaus and Boyer, Reference Nordhaus and Boyer2000; Tol, Reference Tol2002; Nordhaus, Reference Nordhaus2010). The IAM approach is based on many assumptions about which effects to include, how each of these effects operates and how to add them up. Dell et al. (Reference Dell, Jones and Olken2012) and Horowitz (Reference Horowitz2009) take a direct approach, measuring the impact of temperature and precipitation on the national income. They econometrically estimate a reduced-form equation measuring a relationship between income and temperature. In these two studies, the difference lies in the measurement of the temperature variable. Dell et al. (Reference Dell, Jones and Olken2012) examine annual variation in temperature in the second half of the 21st century, whereas Horowitz takes a monthly average temperature over 1960–2005 to measure the impact of climate change on income. This paper econometrically estimates a reduced-form equation measuring the relationship between temperature measured as an average of data from 1980 through 2008 and various measures of productivity and its components under different scenarios.
There are important ongoing debates in the growth empirics literature on whether geography is the main determinant of economic growth or whether it is institutions that determine the growth trajectory of the country. Attempts to resolve this debate have centered on the use of linear cross-country regressions where the dependent variable is GDP per capita while proxies for institutional quality, macroeconomic policies and geographic endowments form the set of explanatory variables. Acemoglu et al. (Reference Acemoglu, Johnson and Robinson2001), Easterly and Levine (Reference Easterly and Levine2003) and Rodrik et al. (Reference Rodrik, Subramanian and Trebbi2004) conclude that institutions rather than its geography determine the growth trajectory in a country, whereas Sachs (Reference Sachs2003) and Nordhaus (Reference Nordhaus2006) argue that geography is the main determinant of the growth rate in a country.
Institutions are the ‘rules of the game’ that shape political, economic and social interaction in a society and establish the incentive structure in an economy (North, Reference North1991). Property right regimes, in particular, are important factors in institutional analysis (North, Reference North1990). However, it takes resources to define and protect property rights and to enforce agreements. Property rights determine who can participate in decision making and ultimately use resources. For example, a subsidy or tax cannot be defined independently of property rights. Thus, well-defined property rights could lead to efficient resource use (Bromley, Reference Bromley1995). Our empirical strategy is to use regression analyses to measure the impacts of institutions on productivity and its components under strong and weak disposability in the presence of climatic factors. These regressions provide an understanding of the role of institutions in mitigating the impacts of climate change and emissions mitigation strategies.
3. Carbon-sensitive efficiency and productivity growth
We obtained normalized data on five variables, namely GDP, CO2, labor, capital stock and commercial energy consumption for 88 countries,Footnote 4 a mix of developed and developing countries, for the period 1994–2008,Footnote 5 in order to measure efficiency and productivity growth. Out of these five variables, the first two (GDP and CO2) are considered as proxies of good and bad outputs, respectively, and the remaining three are used as inputs. Data on the GDP, CO2, labor force and capital stock were collected from Extended Penn Tables (Version 4) and energy consumption from the World Development Indicators (WDI, World Bank). GDP and capital stock are measured in 2005 US dollars, whereas CO2 and energy consumption are measured in thousand metric tons. The labor force data comprise millions of workers. This is part of a larger database called the World Resource Table (WRT) (see Kanie and Managi, Reference Kanie and Managi2014; Miyama and Managi, Reference Miyama and Managi2014; Yang et al., Reference Yang, Managi and Sato2014).
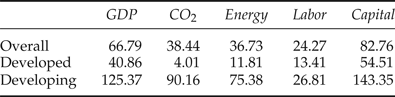
The cumulative growth rates of all variables used in the study for both groups, i.e., developed and developing countries, are presented in table 1. The growth rate of all variables during the study period was higher in developing countries relative to developed countries. Note that the growth rate of CO2 emissions was substantially lower than that of energy consumption in the developed countries, but the opposite is the case in developing countries. This phenomenon implies that in the developed countries energy consumption has decoupled from CO2 emissions. This situation, in turn, implies that most carbon-mitigating technological progress is concentrated in the developed world, which corroborates the fact that approximately 80 per cent of all clean energy innovations are concentrated in just six developed countries: the United States, Japan, Germany, Korea, France and the UK (Jishnu, Reference Jishnu2011).
Growth rates of key variables in 2008 over 1994

Among the large, populous countries, the highest cumulative growth in GDP was achieved by China, Vietnam, India and South Africa. Zimbabwe experienced a decline in GDP and CO2 emissions during this period, which can be attributed not only to a decline in capital stock and the consumption of energy, but also to a decline in the quantum of labor. Although the highest growth rate of CO2 emissions was observed in Namibia, China and India are among the developing countries and Norway is in the developed countries that experienced the highest growth rates in carbon emissions. Note that Singapore experienced a decline in CO2 emissions and energy consumption, although GDP, capital stock and labor force were growing during this period in the country. This reflects the decoupling of growth from energy consumption as well a clean technological growth. A similar type of growth trajectory is visible in the UK, Sweden, Denmark, Bulgaria and Romania, but at a lesser intensity. In the United States, the cumulative growth rate of CO2 emissions and energy consumption was 4.49 and 11.89 per cent, respectively.Footnote 6
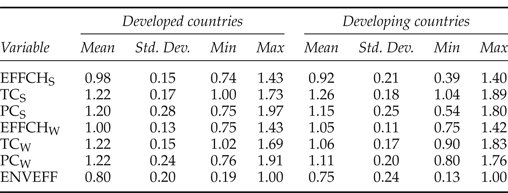
Managi (Reference Managi2011) discusses the various measures of efficiency and productivity under strong and weak disposability conditions (see Chung et al., Reference Chung, Färe and Grosskopf1997, in detail). The methodology constructs a best practice frontier from the data.Footnote 7 Note that we estimate the directional distance function under constant returns to scale as, from an ecological perspective, economic activity is commonly characterized by constant returns to scale (Picazo-Tadeo et al., Reference Picazo-Tadeo, Beltrá-Esteve and Gómez-Limón2012; Halkos and Tzeremes Reference Halkos and Tzeremes2013b).Footnote 8 Table 2a sums up the main results which describe the cumulative performance of each group.Footnote 9 Recall that index values greater (less) than one denote improvements (deterioration) in the relevant performance.Footnote 10
Descriptive statistics of various measures of productivity in 2008 over 1994

Descriptive statistics of variables used in regressions

3.1. Conventional productivity growth
Technology in any given period is represented as an output directional distance function, which measures the level of inefficiency. Recall that the zero value of a directional distance function implies that a country is operating at the production frontier. The value of the directional output distance function in 1996 was zero for 12 countries, namely Australia, Costa Rica, Greece, Ireland, Italy, Luxembourg, Malta, Norway, Sudan, Switzerland, the UK and the United States; in 2008 the number of countries having a directional distance function value equal to zero was only seven, namely Greece, Ireland, Luxembourg, Malta, Peru, Singapore and the United States, implying that these countries were using the best combination of inputs and outputs. Here, Greece, Malta and the United States are on the frontier in both years. Note that in both years even some of the developing countries are on the frontier. This implies that these countries are being stymied not by a lack of resources but rather the inefficient use of resources, or this may be happening because we used the DEA method, which fails to identify the true frontier at a low level of resources (see Kumar and Russell, Reference Kumar and Russell2002; Managi et al., Reference Managi, Opaluch, Jin and Grigalunas2004).
Next, we calculated Malmquist–Luenberger (ML) productivity indexes as well as the efficiency change and technical change components for each country in our sample (see Managi et al., Reference Managi, Opaluch, Jin and Grigalunas2005, for methodology). Instead of presenting the disaggregated results for each country and year, we discussed the summary of the cumulative performance of each country over the entire 1994–2008 time period.Footnote 11 The cumulative ML index value of 1.16 indicates that the cumulative productivity (CP) growth for the sample countries was 16 per cent. On average, this growth was due to technical change; the world witnessed an average technical progress of 25 per cent over the study period (table 2a). This cumulative progress in TFP is 20 per cent for developed countries, whereas in developing countries it increased by 15 per cent. From these overall averages of progress in TFP changes in countries it may be argued that all effective GDP growth in the post-1994 period was due to input accumulation and technological changes. The figures on the standard deviation of the indexes show that there is much diversity among the developed countries relative to developing countries with respect to changes in TFP and its components.
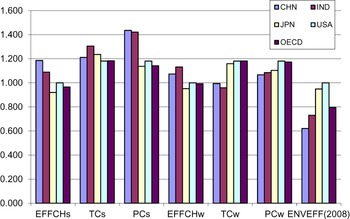
Figure 1 provides the productivity growth in major economies including the United States, Japan, the group of OECD countries, China and India. This figure shows that developing economies such as China and India observed high productivity growth relative to the United States, Japan and the OECD countries. In both China and India, productivity growth was the product of the catch-up effect and technological progress. However, in China the catch-up effect is stronger than technological progress, while the opposite is the case for India. In the United States, all growth in productivity (approximately 18 per cent) is attributed to technological progress, and throughout the study period the United States was on the production frontier.
Cumulative productivity change in some major economies

3.2. Carbon-sensitive productivity growth
Under weak disposability of CO2 emissions, we find that 14 countries were at the frontier in 1996. These 14 countries include the 12 countries that were on the frontier under strong disposability in addition to Guatemala and Haiti. In 2008, 13 countries were on the frontier. Australia, Costa Rica, Haiti, Italy, Norway, Sudan and the UK were replaced by El Salvador, Peru, Singapore, Sweden and Zambia. On average, inefficiency scores are higher when CO2 emissions are strongly disposable in comparison to the cases when this pollutant is weakly disposable (see table 2a). It reveals the potential to increase the production of desirable output and reduce the undesirable outputs with the given bundle of inputs. The measure of inefficiency under weak disposability of pollutants can alternatively be interpreted as a potential win-win opportunity to reduce pollutants while increasing GDP, given a country's distance from the best practice frontier. This win-win opportunity for CO2 is higher for developing countries than for developed countries.
The estimates of carbon efficiency as EEFootnote 12 represented as the ratio of production inefficiency under weak disposability to strong disposability of CO2 emissions show that most countries observe a value less than one, i.e., there are carbon inefficiencies. The results imply that, on average, most of these countries have carbon-binding production technologies. For example, in 2008 the average scores were 0.75 and 0.80 for the developing and developed countries, respectively. In the case of major economies, the United States observed non-binding production technology whereas China had the most binding production technology, followed by India. This implies that major economies such as China and India can reduce CO2 emissions at a lower cost than the United States, Japan or the OECD group, but if emissions regulation conditions are imposed without any compensation these developing economies also lose the most in terms of lost GDP (see figure 1, last panel).
When countries’ efficiency scores differ under the assumption of weak disposability and strong disposability of CO2, they suffer costs associated with emissions reduction technology. That is, if these countries were to reduce their emissions, they would have to sacrifice their GDP. Once this inefficiency is translated into loss of desirable output, the results indicate that developing countries such as Zimbabwe, Ethiopia, Mozambique, Togo, Tanzania, Zambia, Kenya, Nepal, etc. would have to lose most of their GDP to expenses relating to production technologies. As a whole, countries in our sample would lose 23 per cent of their GDP in 2008 on average because of carbon-binding production technology. The relative output loss because of the imposition of costly abatements for developing countries is higher than the overall average of the entire sample.
Again, we observe that all countries have lower growth in TFP when CO2 is considered to be an undesirable output in comparison to conventional TFP growth. This finding corroborates Kumar and Khanna (Reference Kumar and Khanna2009); they find similar results for the period 1971–1992 when there was no binding on the carbon emissions of any country. Kopp (Reference Kopp1998) finds that between 1970 and 1990 developed countries experienced technical progress in a way that economizes on CO2 emissions, but developing countries did not. This variation in findings may be due to differences in estimation methods and in the group of countries. The ratio of TFP measures under weak and strong disposability conditions can be interpreted as the intertemporal efficiency showing how well environmentally friendly technologies and managements are utilized (e.g., Jaffe et al., Reference Jaffe, Newell, Stavins, Mäler and Vincent2003; Kumar and Managi, Reference Kumar and Managi2010).
The cumulative change in the productivity index when CO2 was weakly disposable was 14 per cent. This cumulative TFP measure was the sum of a positive change in innovation of 10 per cent and a positive efficiency change of 4 per cent. In developed countries it was technological changes that governed the change in overall productivity index in most of the countries, whereas in the developing countries carbon-sensitive productivity growth is governed by the diffusion in technologies, i.e., the catch-up effect was dominating.
Figure 1 also shows the carbon-sensitive productivity growth for major economies. Note that all these economies experience lower TFP growth when the carbon emissions are binding, but the decline in TFP growth is substantial in the case of China and India. Under this scenario, the United States observed the highest productivity growth, which is entirely attributed to technological progress. Moreover, when the disposal of carbon emissions is binding, all productivity growth in China and India is due to technological diffusion rather than technological progress; the growth of technological diffusion in India is higher than that in China. This corroborates the fact that most green technological progress has remained confined to developed countries (Jishnu, Reference Jishnu2011).
4. Impact of climate change and institutions on productivity growth
The main objective of this study is to investigate the impact of climate change on productivity growth and determine how better institutions help in alleviating the impacts. The discussion in the preceding section shows that productivity differs across nations but the studies investigating the cause of difference in productivity growth across nations generally have ignored climate as one of the major determinants of productivity growth. Modern theories of economic growth recognize the fact that differences across nations in per capita income are due to productivity differences, but they assume that per capita income or the growth rate of per capita income is the function of conventional factor accumulation (such as capital per worker) in addition to technologies. In the last decade, studies show that, starting with Hall and Jones (Reference Hall and Jones1999), economists have begun to consider institutions and governance together with geographic factors as the determinants of differences in per capita income or productivity across nations. In a recent study, Nordhaus (Reference Nordhaus2006) recognized that climatic factors matter most in determining the growth of a nation's per capita income.
To examine the relationship between productivity and its determinants, our study considers variables such as level of productivity in the initial year, average temperature in a country over the period 1980–2008, soil quality in a country, average protection against appropriation of property rights (AVEXPRO) and the Simeon extended index of formalism (SDFORMALISM). The source of data on soil quality is the Nordhaus G-Econ project. A low value of the index of soil quality implies high water level. We have included soil quality as a proxy for other geographic control variables such as location.
There could be many other determinants of productivity growth, but the other explanatory variables could be influenced by temperature and institutions or uncorrelated with included variables. If the excluded variables are related to the included variables, then they should not be considered as regressors; if they are not related to included variables, then the excluded variables have no impact on the accuracy of results in measuring climatic and institutional variables roles (Horowitz, Reference Horowitz2009).Footnote 13
The convergence theory could be restated in the relationship between productivity and lagged technical inefficiency. This relationship would predict that those countries near the production frontier would see a lower level of productivity growth than those farther away. Therefore, the positive relationship between productivity level and lagged productivity level would indicate the presence of the convergence hypothesis (Kumar, Reference Kumar2006). A positive relation between CP and initial productivity shows divergence across countries and a negative relation between CP components and initial inefficiency indicates divergence across countries.
As our interest was in measuring the impact of climate on productivity, a measure of long-run average temperature was the most useful single climate variable. Dell et al. (Reference Dell, Jones and Olken2012) used population-weighted average yearly temperatures to measure the relationship between per capita income and temperature. Yearly temperatures can be a measure of weather changes rather than climate change; however, weather changes are a manifestation of climate change, and population-weighted averages have some element of endogeneity also. Horowitz (Reference Horowitz2009) used long-run average temperature, based on monthly average temperature data from 1960 through 2005, in the capital city as reported by the UN's World Meteorological Organization. On the Horowitz measure, a question remains as to what extent the capital city is representative of the conditions under which economic activities in a country take place. Nordhaus (Reference Nordhaus2006) used the geographic average of temperature, but his unit of observation was a 1° latitude/longitude cell, instead of excluding countries and cells without economic data. If one is interested in using country-level data, then a country's temperature averaged over the entire country will include economically irrelevant areas. We used the temperature data from the Nordhaus G-Econ project.Footnote 14 The Nordhaus G-Econ project provides temperature data at 1° latitude/longitude cell averaged over the period of 1980–2008. To have country-level data, we excluded the cells without economic data.
Similarly, to examine the relationship between productivity growth and institutions, we regressed conventional productivity growth or carbon-sensitive measures of productivity growth and its components against AVEXPRO and SDFORMALISM. Data of AVEXPRO and SDFORMALISM was obtained from Acemoglu and Johnson (Reference Acemoglu and Johnson2005). AVEXPRO is considered to be a measure of property rights and SDFORMALISM measures the degree of complexity in a country for carrying out economic contracts.Footnote 15 A higher value of AVEXPRO implies greater protection against the appropriation of property rights, and a higher value of SDFORMALISM indicates a system that is more complicated for carrying out economic contracts. Various studies by Acemoglu and his colleagues show that the AVEXPRO is positively associated with the growth of per capita income in a country, whereas a higher value of SDFORMALISM lowers the growth of financial transactions in a country.
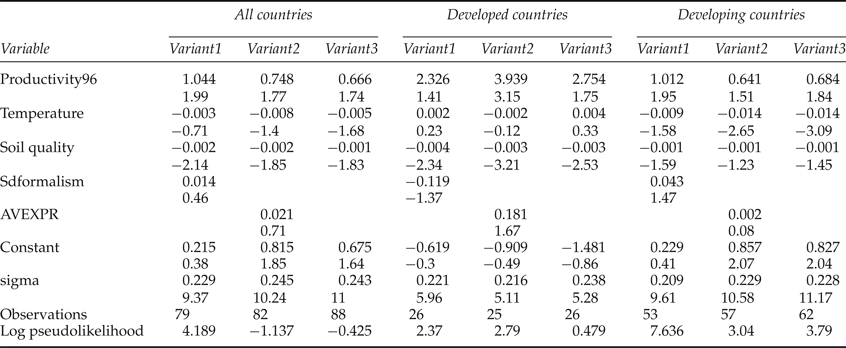
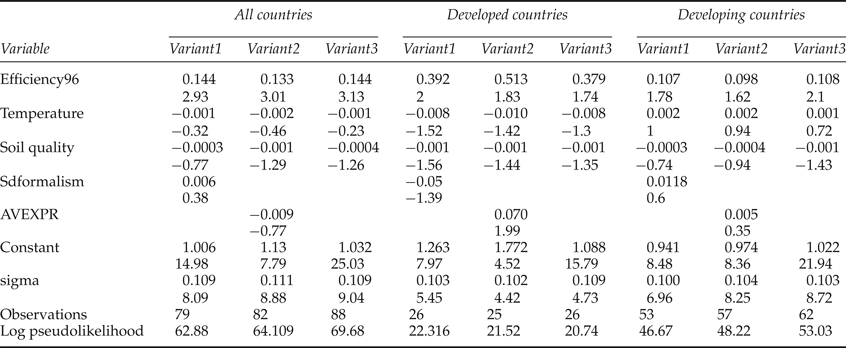
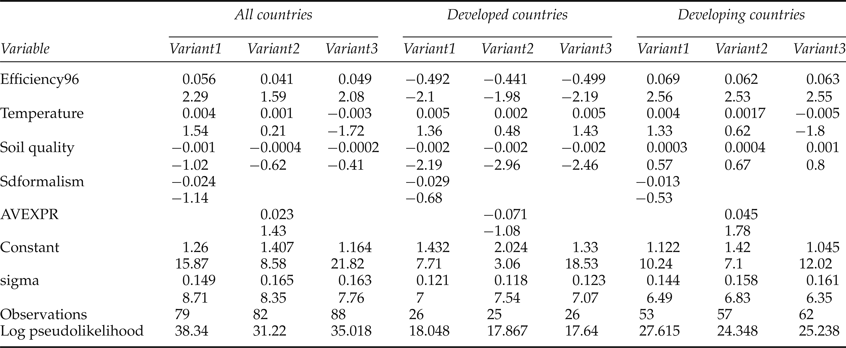
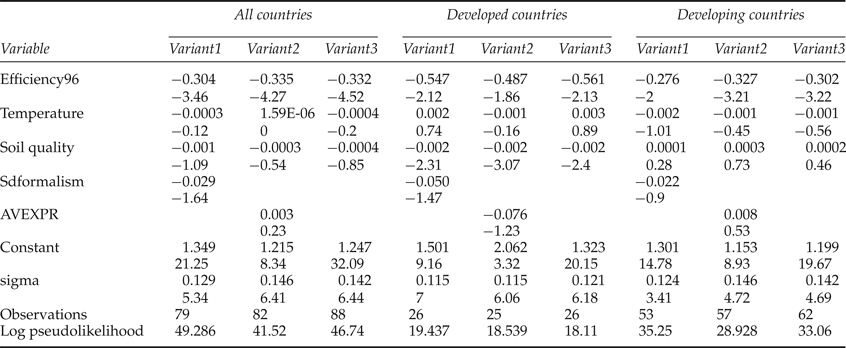
Table 2b provides the descriptive statistics of the determinants of productivity and its components for both developed and developing countries. In developed countries, the average temperature is approximately 10°C, whereas in the developing countries group the temperature is approximately 21°C – more than their counterpart group. Similarly, in the developed countries the index value of soil quality is 48.5, although in the developing countries group the average value of soil quality index is approximately 80. Note that with respect to both climatic factors there is higher variability in the developed country group relative to the developing countries group. The opposite is the situation with respect to institutional variables in developed and developing countries. In the developing countries the value of AVEXPRO is substantially low and SDFORMALISM is higher relative to the developed countries group, and there is high variability with respect to these variables in developing countries in comparison to developed countries. Given the high difference in the averages and variability among the determinants of productivity across these two groups of countries, we run separate regressions of each of the groups as well as a regression for all observations for CP growth and its components under both scenarios. Generally the regressions are run using a Tobit model that recognizes the censored nature of productivity and its determinants that, by definition, are constrained to zero towards the left. Simar and Wilson (Reference Simar and Wilson1999) show that productivity and its component scores are correlated with the explanatory variables, and the estimates obtained using the Tobit model will be inconsistent and biased. We used the approach proposed in Simar and Wilson (Reference Simar and Wilson2007) with a truncated regression. We assumed that the distribution of error term is truncated normal with zero mean (before truncation), unknown variance, and (left) truncation point determined by the condition u i ≥1−α (determinants) – qiβ−v i . We computed the bootstrapped standard errors for the estimates of parameters. The regression results are presented in tables 3–5.
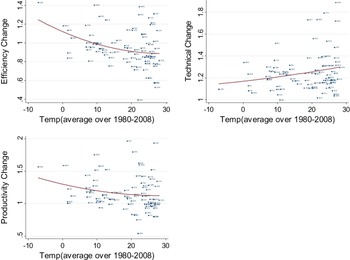
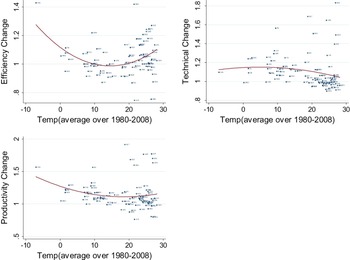
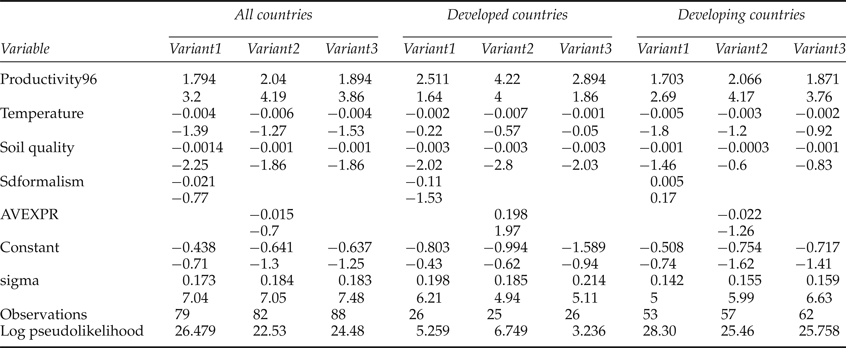
Tables 3a and 3b provide the parameter estimates of productivity determinants under strong and weak scenarios, respectively. We found a positive association between CP and its initial level, which helps to explain the growing inequality between countries. Divergence is happening even within the developing countries under both scenarios. Soil quality levels impact productivity growth positively in developed countries, whereas temperature levels affect developing countries negatively. A negative association between temperature level and CP level for the sample of developing countries under strong disposability indicates that climate change impacts are more pronounced in developing countries. That is, high-temperature countries tend to have lower productivity growth and low-temperature countries have higher productivity growth. This relationship has been known since at least the 18th century (Montesquieu, Reference Montesquieu1750), and has been further established using national data by Dell et al. (Reference Dell, Jones and Olken2012) and Horowitz (Reference Horowitz2009) and sub-national data by Nordhaus (Reference Nordhaus2006) in the context of the income–temperature relationship. There are, of course, many possible reasons why hotter countries have lower productivity growth, such as climate's effects on disease, agriculture, capital depreciation, worker productivity or human behavior, say in the form of culture or institutions. Nordhaus (Reference Nordhaus1993) discusses a wide range of pathways for how temperature has been viewed as a factor in economic activity, particularly at the individual level, as when worker or student performance is affected by ambient temperature. Moreover, note that the negative relationship between temperature and conventional productivity is governed by the negative relationship between catch-up effect and temperature, although conventional technological progress is positively associated with temperature (figure 2). The negative relationship between temperature and carbon-sensitive productivity is the function of both the negative relationships between temperature and technological diffusion and temperature and technological progress (figure 3), although we observe a positive relationship between temperature and technological diffusion when the average temperature is more than 20°C.
Relationship between temperature and productivity change under strong disposability of CO2 emissions

Relationship between temperature and productivity change under weak disposability of CO2 emissions

Determinants of productivity change under strong disposability of CO2 emissions

Note: Values in second row represent t-statistics.
Determinants of productivity change under weak disposability of CO2 emissions

Note: Values in second row represent t-statistics.
Truncated regression results show that better property rights and less complex systems help in increasing the productivity level of developed countries under both scenarios (table 3a, variant2 and table 3b, variant1 and variant2). This implies that the country that has better protection against expropriation against property will do better in terms of productivity growth, and complex systems lower productivity growth. This finding corroborates the results of various studies performed by Acemoglu and his colleagues and Hall and Jones (Reference Hall and Jones1999), although they find a relationship between the growth rate of an economy and institutions.
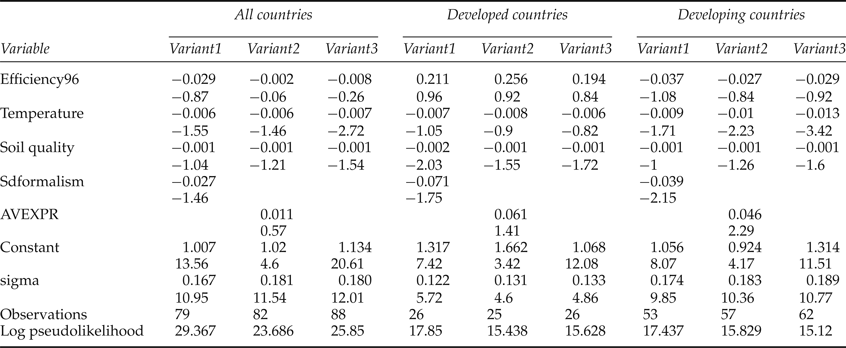
Table 4 presents the regression results for the determinants of efficiency change (catch-up effect). Under strong disposability, neither divergence nor convergence is observed in either of the groups. However, if the disposal of emissions is restricted, then there is convergence in technological adoption across countries and within the groups of developed and developing countries. When the disposal of CO2 emissions is free, temperature increases lower technological diffusion in developing countries, but better property rights help to lower the impact of climate change and spread diffusion. Soil quality is not related to technological diffusion. Less complex systems improve diffusion in developed countries (table 4a, variant1). The process of diffusion is negatively affected in developed countries due to climate change under weak disposability of the emissions. However, better property rights in developed countries helps to improve the process of technological diffusion (table 4a, variant2).
Determinants of efficiency change under strong disposability of CO2 emissions

Note: Values in second row represent t-statistics.
Determinants of efficiency change under weak disposability of CO2 emissions

Note: Values in second row represent t-statistics.
Tables 5a and 5b provide the regression results for the determinants of technological change. Under strong disposability, there is divergence in innovation in developed countries but convergence in developing countries. However, if disposal is costly, divergence in innovation is common in both groups. Better property rights help to improve innovations in developed countries under weak disposability (table 5b, variant2) and in developing countries under strong disposability (table 5a, variant2). However, innovations are not related to temperature changes under either scenario.
Determinants of technical change under strong disposability of CO2 emissions

Note: Values in second row represent t-statistics.
Determinants of technical change under weak disposability of CO2 emissions

Note: Values in second row represents t-statistics.
5. Conclusions
Temperature and institutions determine choices and provide incentives; therefore, they are important in lowering the vagaries of climate change measured in terms of climate change impacts on productivity. Their relationships to productivity are analyzed in the literature (Montesquieu Reference Montesquieu1750; Acemoglu and Johnson, Reference Acemoglu and Johnson2005). However, they are less discussed in the literature on the impacts of climate change (Dell et al., Reference Dell, Jones and Olken2012). This paper intends to measure the relationships with productivity measures adjusted for the regulation of carbon emissions and institutions together with climate change variables.
In this study, productivity growth has been found both in developed and developing countries; however, differences in productivity growth have increased between these groups of countries over a period of time. When CO2 is considered, there is higher potential for reduction of CO2 emissions in developing countries at lower cost. However, the costly disposable of emissions lowers their growth potential in terms of loss in productivity. Under scenarios where carbon emissions are not regulated, better property rights help in lowering the impacts on climate change through improving the process of technological adoption in developing countries. Climate change reduces productivity growth in developing countries by lowering the process of technological adoption, and better property and contracting rights result in higher productivity.
In addition, we find a potential win-win opportunity to reduce CO2 while increasing GDP, given that a country's distance from the best practice frontier is higher for developing countries than for developed countries. The countries in our sample would lose 23 per cent of GDP in 2008 on average. This is because of carbon-binding production technology. The relative output loss from the imposition of costly abatements for developing countries is higher than the overall average of the entire sample.