I. INTRODUCTION
Oxide-supported metal thin film nanocomposites (NCs), where metal nanoparticles serve as the dopant, constitute a class of functional materials, which have attracted much attention, in recent years, due to their technologically important properties and ensuing potential application in many industrial processes including energy-intensive chemical processes.Reference Liu, Xing, Xue, Wu and Fang1,Reference Gual, Godard, Castillon, Ferre and Claver2 In the latter case, zinc oxide doped with the hexagonal close-packed (hcp) Co phase is of particular interest as a model nanocatalyst in many important chemical processes such as Fischer–Tropsch synthesis,Reference Liu, Xing, Xue, Wu and Fang1–Reference Wang, Ning, Hu and Li3 photocatalysis,Reference Poongodi, Anandan, Kumarn and Jayavel4 steam reforming,Reference Llorca, Homs and de la Piscina5 and hydrogen production.Reference Jaramillo, Baeck, Shwarsctein, Choi, Stucky and McFarl6 While nanoparticles have an exceptionally large surface area-to-volume ratio relatively to bulk material counterparts, the properties of nanocatalysts depend on size, structure, and the presence of the metal in elemental form.Reference Gual, Godard, Castillon, Ferre and Claver2 Achieving desirable features in a nanocatalyst, viz., selectivity and activity, depends on the ability to control its morphology, surface composition, and crystal structure, and on how the parameters of the fabrication method affect those properties.Reference Mondloch, Bayram and Finke7 The microstructure of cobalt-doped ZnO (CZO) films, while temperature-dependent, is affected by the doping level of cobalt in ZnO. The properties of CZO are practically similar to those of zinc oxide for a Co doping level of up to 10–12 wt%.Reference Juang, Chu, Weng and Tyan8,Reference Park, Kim, Jang and Ryu9 For higher values of Co doping, secondary phases such as elemental cobalt and cobalt oxides have been observed in CZO films.Reference Park, Kim, Jang and Ryu9
Since morphological and structural changes in thin films are dependent on the precursor source and deposition method, in the past few decades, CZO NCs have been synthesized by various physical and chemical deposition techniques such as molecular beam epitaxy,Reference Liu, Yang, Wei, Pan, Yuan and Cheng10 sputtering,Reference Song, Pan, Liu, Li, Zeng, Yan, He and Pan11 sol–gel,Reference Park, Kim, Jang and Ryu9 ultrasonic spray,Reference Benramache, Benhaoua and Chabane12 pulsed laser deposition,Reference Negi, Roy, Loukya, Dileep, Shetty, Kumar, Kumar and Datta13 inductively coupled plasma enhanced physical vapor deposition,Reference Liu, Shi, Chen, Zhang, Song, Wang and Yao14 electrodeposition,Reference Wang, Zhong, Lu, Lv, Wang and Zhang15 and chemical vapor deposition.Reference Zukova, Teiserskis, Kazlauskiene, Gunko and Dijken16 Pulsed electron beam ablation (PEBA) is a simple and relatively novel technique for thin film deposition and has proven to be an efficient technique for the deposition of high quality thin films of simple as well as complex oxides.Reference Mathis and Christen17–Reference Pattini, Annoni, Bissoli, Bronzoni, Garcia, Gilioli and Rampino21 Potential advantages of PEBA include high energy conversion efficiency (∼30% electric to electric), high fluence, low capital and maintenance costs, enhanced film thickness control, environmentally benign as no toxic gases are involved, and scalability for enhanced throughputs.Reference Graziosi, Prezioso, Gambardella, Kitts, Rakshit, Riminucci, Bergenti, Borgatti, Pernechele, Solzi, Pullini, Mataix and Dediu18,Reference Kovaleski, Gilgenbach, Ang, Lau and Lash22,Reference Strikovski, Kim, Kolagani, Dhanaraj, Byrappa, Prasad and Dudley23 More ample details on PEBA can be found elsewhere.Reference Ali, Henda and Fagerberg24 Among the critical parameters of PEBA, which include beam accelerating voltage, beam fluence, target–substrate distance, nature of process gas and its pressure, and substrate temperature, the pulsed electron beam repetition rate, or beam frequency, is an important factor that can affect the structural and morphological properties of deposited films. Beam frequency can have a strong bearing on ablation threshold and ensuing plasma dynamics,Reference Moholkar, Shinde, Babar, Sim, Kwon, Rajpure, Patil, Bhosale and Kim25 which, in turn, affects the incident energy and particle fluxes on the substrate surface, particle deposition rate, particle nucleation on the surface, adatom diffusion, and coalescence of clusters of atoms.Reference Zhang and Chu26,Reference Fuenzalida27 During the pulse, atoms impinging on the substrate are deposited, and, during the time between successive pulses, atoms rearrange in a process that is akin to annealing.Reference Zhang and Chu26 The formation of nanoparticulates in the gas phase is a characteristic of PEBA and will further affect the surface morphology of the films.Reference Mathis and Christen17 The beam frequency also plays a key role in controlling film thickness, and, accordingly, film properties.Reference Myoung, Yoon, Lee, Yun, Baf and Lee28
In this study, the effect of pulsed electron beam frequency on the growth of CZO thin films from a single target is investigated. Of particular interest are properties, viz., size of nanoparticles (6–30 nm), presence of cobalt in metallic form, and cobalt crystal phase (hcp structure), for CZO thin films to have the potential as model nanocatalysts.Reference Gual, Godard, Castillon, Ferre and Claver2,Reference Karaca, Safonova, Chambrey, Fongarland, Roussel, Constant, Lacroix and Khodakov29 Recently, we have investigated the effects of Co loading in the target material, deposition temperature, and discharge voltage on similar properties of CZO.Reference Ali, Henda and Fagerberg24,Reference Ali, Pinto, Henda and Fagerberg30,Reference Ali, Morrow, Henda and Fagerberg31 Characterization of the films is carried out via scanning electron microscopy (SEM), energy-dispersive X-ray spectroscopy (EDX), visible reflectance spectroscopy (VRS), atomic force microscopy (AFM), X-ray photoelectron spectroscopy (XPS), and X-ray diffraction (XRD). The results are discussed in terms of changes in film morphology, chemical state and composition, and crystal structure induced by electron beam repetition rate.
II. EXPERIMENTAL
A PEBA system (PEBS-20, Neocera Inc., Beltsville, Maryland) based on the channel spark discharge has been used to deposit CZO thin films on Si(100) substrates (University Wafer, Boston, Massachusetts) 10 × 10 × 1 mm in size. During the transient stage of the discharge, a short pulse of electrons (∼100 ns) is produced under a low-pressure background gas. The resulting plasma is confined in the ceramic capillary tube, with an inner diameter of several millimeters, owing to a magnetic self-pinched force induced by high currents.Reference Nistor, Mihut, Millon, Cachoncinlle, Hebertd and Perriered20 Once the self-pinched electron beam hits the target surface, the ablation process is triggered, resulting in a dense, highly ionized vertical plasma plume, which eventually leads to the growth of a thin film on the substrate. Prior to deposition, the chamber was pre-evacuated down to ∼1 × 10⁻⁶ torr. The substrates were cleaned before deposition in ultrasonic baths of acetone and methanol followed by rinsing in deionized water. The films were grown from a single Co0.2Zn0.8O target (SINTEF, Trondheim, Norway) at various beam frequencies of 1 Hz, 2 Hz, 4 Hz, and 8 Hz. All other process parameters have been kept constant, viz., deposition temperature (450 °C), accelerating voltage (16 kV), target-to-substrate distance (5 cm), background gas (Ar) pressure (∼3 mtorr), target-to-capillary tube distance (2.5 mm), capillary tube diameter (3 mm), and number of pulses (3000). During deposition, the electron beam was incident on the target surface at an angle of 45°, and the target and substrate have been rastered and rotated to ensure homogeneous ablation and uniform film growth.
The surface morphology of the films has been analyzed by AFM (Anasys Instruments, Santa Barbara, California) and SEM (FEI Quanta FEG 250, FEI, Hillsboro, Oregon). The AFM was operated in the contact mode with a scan speed of 0.2–0.5 Hz, whereas the SEM, equipped with EDX, was operated under high vacuum at 10 kV. The film thickness has been examined by SEM as well as VRS (M-Probe Series, Semiconsoft, Southborough, Massachusetts). In VRS, the spectroscopic reflectance signal of the sample is collected and normalized using calibration data. The signal is compared to simulated data, which are calculated based on spectral optical constants of the sample, using a modified Marquardt–Levenberg minimization scheme to infer film thickness. The chemical analysis of the films has been undertaken by EDX, and the determination of chemical bonding near the film surface has been performed by XPS (ThermoFisher Scientific, U.K.) at a take-off angle of 90° relative to the surface. A monochromated Al K-Alpha X-ray source (with a photon energy of 1486.6 eV) has been used in the analysis. XPS Co 2p 3/2 spectra have been acquired in low pass energy mode, i.e., high energy resolution, with a high point density on the energy axis (0.1 eV). The enhanced energy resolution is required to better conclude on the chemical state information of CZO films. The structural properties of CZO films have been studied using a high resolution bench top XRD (Rigaku MiniFlex 600, Rigaku, Woodlands, Texas). Radiation produced by the copper anode X-ray source includes Cu Kα1 and Cu Kα2 having wavelengths of 1.54056 Å and 1.54439 Å, respectively. The system was operated at 40 kV, 13 mA, step size of 2θ = 0.02°, and scan speed of 1°/min to carry out the measurements. The theta/2-theta Brag Brentano configuration has been used to generate 30°–80° diffractograms.
III. RESULTS AND DISCUSSION
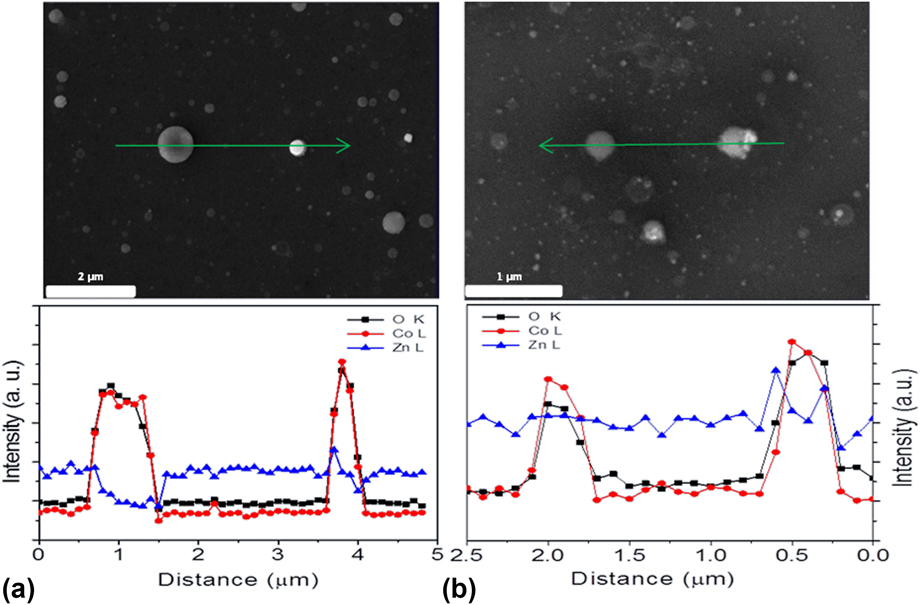
The compositional analysis, using EDX, of the films deposited at various beam frequencies is presented in Fig. 1. The line scan analysis (along arrow line in the SEM image), shown at the bottom of the respective SEM image, reveals the presence of O, Co, and Zn in the films and that the films consist of globules that are rich in Co and O. The more whitish the color of the globule is, the higher the cobalt concentration is relatively to oxygen concentration as shown in Figs. 1(a) and 1(b). Point analysis performed by SEM-EDX confirms that deposition is nearly congruent (20 ± 5%).
Typical EDX line scan analysis of the films deposited at a beam frequency of (a) 1 Hz and (b) 8 Hz.

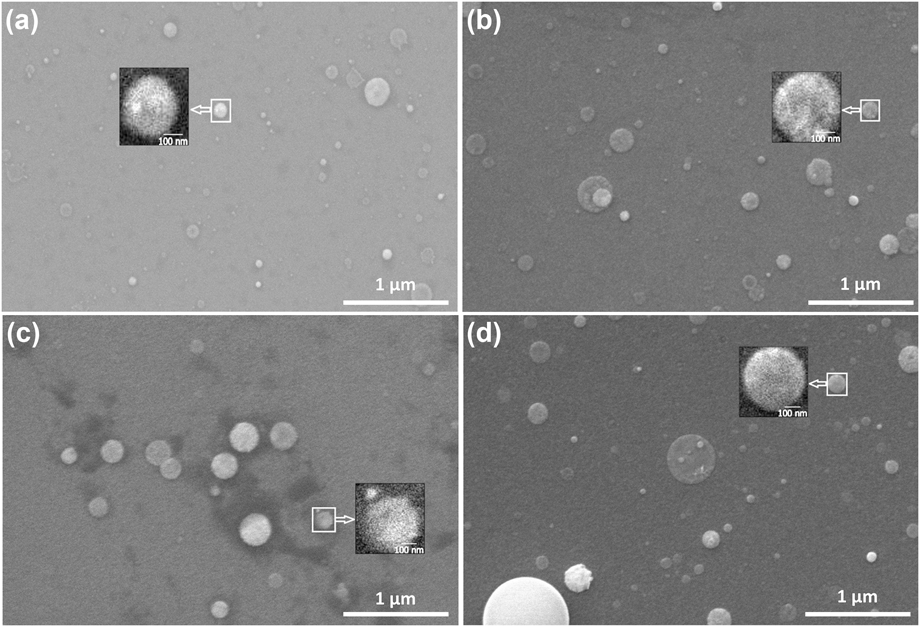
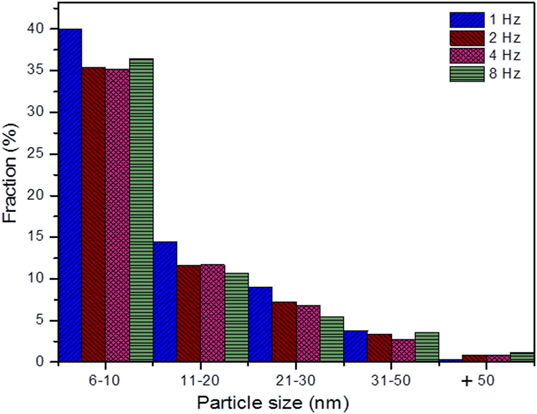
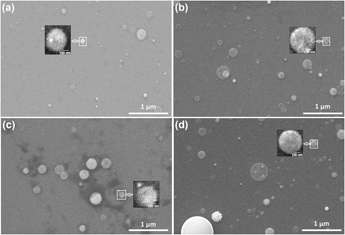
Figure 2 shows the surface morphology of CZO films grown on Si(100) at different beam frequencies as per SEM analysis. It can be observed that the films exhibit well-isolated globules on the top of a smooth surface, as shown in Figs. 2(a)–2(d). The growth of CZO films seems to follow the Stranski–Krastanov (S–K) growth model, i.e., layer plus islands. This is the case when the depositing atoms preferentially bond to the substrate relatively to bonding to one another and provided that surface diffusion is slow. The beam frequency significantly affects the globule size of the deposited films. The data reveal that the average globules size is nearly 45 nm (1 Hz), 103 nm (2 Hz), 166 nm (4 Hz), and 115 nm (8 Hz), and the average globule density (relative to the same film area) is nearly 128 (1 Hz), 51 (2 Hz), 20 (4 Hz), and 60 (8 Hz) on silicon. The observed dependence of globule size (and density) on beam frequency can be explained by considering the processes of nucleation, surface diffusion of adatoms, and metal clustering by coalescence.Reference Ohring32 As the beam frequency is increased from 1 to 4 Hz, the number of atoms arriving onto the substrate surface increases, which eventually coalesce to form large-size globules by ripening of the smaller globules with the addition of more atoms either from the vapor phase (plasma) or by surface diffusion of neighboring atoms.Reference Semaltianos33 For very high beam frequencies (i.e., very high deposition rates, as explained later), viz., larger than 4 Hz, the adatoms can interact strongly with each other by chemisorption with very little surface migration, which leads to a decrease in globule size.Reference Semaltianos33 Therefore, 4 Hz seems to be a critical beam frequency as it corresponds to the maximum globule size and minimum globule density. A closer inspection of SEM images, as depicted in the zoomed-in square area in Fig. 2, reveals that the globules are grown out of many primitive nanoparticulates. A typical nanoparticle size distribution is shown in Fig. 3. The particle size has been directly measured on SEM images shown in Figs. 2(a)–2(d). The data show that the beam frequency has no significant effect on particle size distribution with the most frequent particle size lying in the range of 6–10 nm for 1 Hz (9.4 nm), 2 Hz (9.6 nm), 4 Hz (9.4 nm), and 8 Hz (8.7 nm).
SEM surface images of CZO films deposited on Si(100) substrates at (a) 1 Hz, (b) 2 Hz, (c) 4 Hz, and (d) 8 Hz. The square area is zoomed in and shown in the inset.

Particle size distribution in the deposited films as a function of pulse frequency.

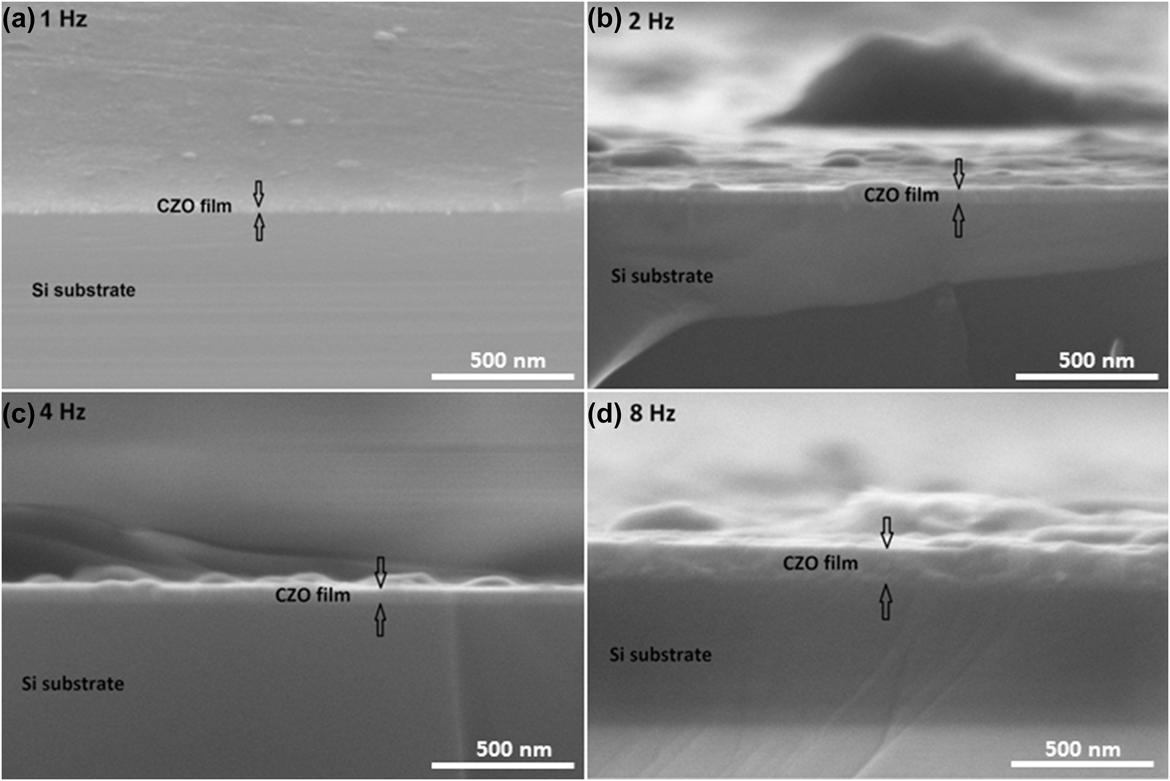
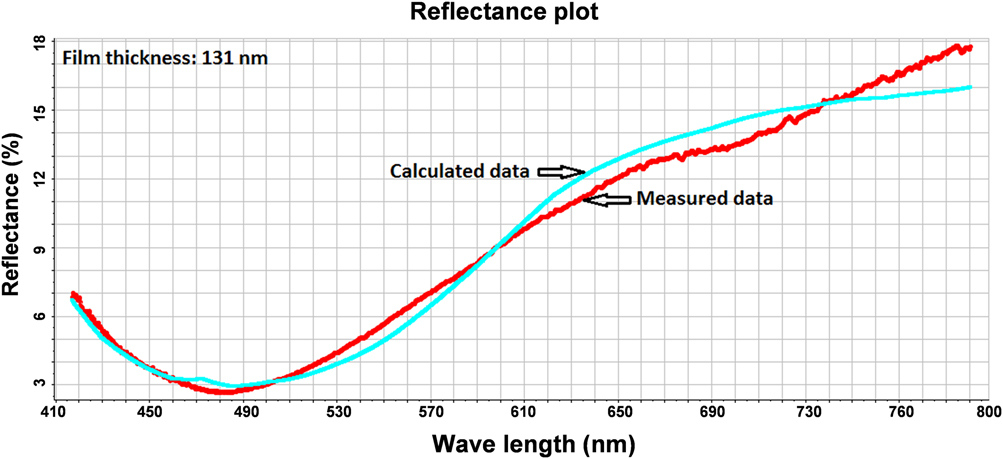
Figures 4(a)–4(d) show transversal cross-sectional SEM images of the deposited films on Si(100). As can be observed, the beam frequency affects the average film thickness, which increases as the beam frequency is increased, viz., 26 nm (1 Hz), 59 nm (2 Hz), 67 nm (4 Hz), and 130 nm (8 Hz). Figure 5 depicts typical thickness measurement data, using VRS, of film deposited on Si at a frequency of 8 Hz. The red curve is the measured reflectance response of the film, whereas the blue curve is the calculated counterpart. The thickness is indirectly measured through the minimization of the difference between measured and calculated reflectance responses of the film by means of a modified Marquardt–Levenberg scheme. The estimated thickness (131 nm), as per VRS, is in good accordance with the average thickness (∼130 nm) measured from SEM analysis, as shown in Fig. 4(d). The film thickness has been averaged over 10 different points along SEM transversal cross section for each sample. It is worth noting that the change in film thickness with beam frequency is not due to deposition time, which is practically the same, but rather to thermal dynamics of the target. The same number of pulses (3000), among other process parameters (except the frequency), has been used for all experimental runs. As such, the “overall” deposition time is inversely proportional to frequency. However, since deposition is pulsed, the target should be ablated over the duration of a pulse and not during the time between two successive pulses, i.e., during the dying-out period. The increase in film thickness with beam frequency can be explained in terms of the time interval between two successive pulses hitting the target surface. At a high pulse frequency, the time interval between two pulses is shorter than at low pulse frequency, and, accordingly, the target is cooled down, between two consecutive pulses, less than at low frequency (where the time between two energy pulses is larger). In this case, i.e., at high frequency, heat accumulation in the target is increased resulting in lower ablation threshold at the next pulse. Accordingly, target heating by the next pulse starts at a higher temperature at a high repetition rate. Higher target ablation rate, higher deposition rate, and thicker films will ensue at a high beam frequency.Reference Vanalakar, Mali, Agwane, Kamble, Kim, Patil, Kim and Kim34
SEM cross-sectional images of CZO films grown on Si at (a) 1 Hz, (b) 2 Hz, (c) 4 Hz, and (d) 8 Hz.

VRS measurements of the film deposited on Si at 8 Hz.

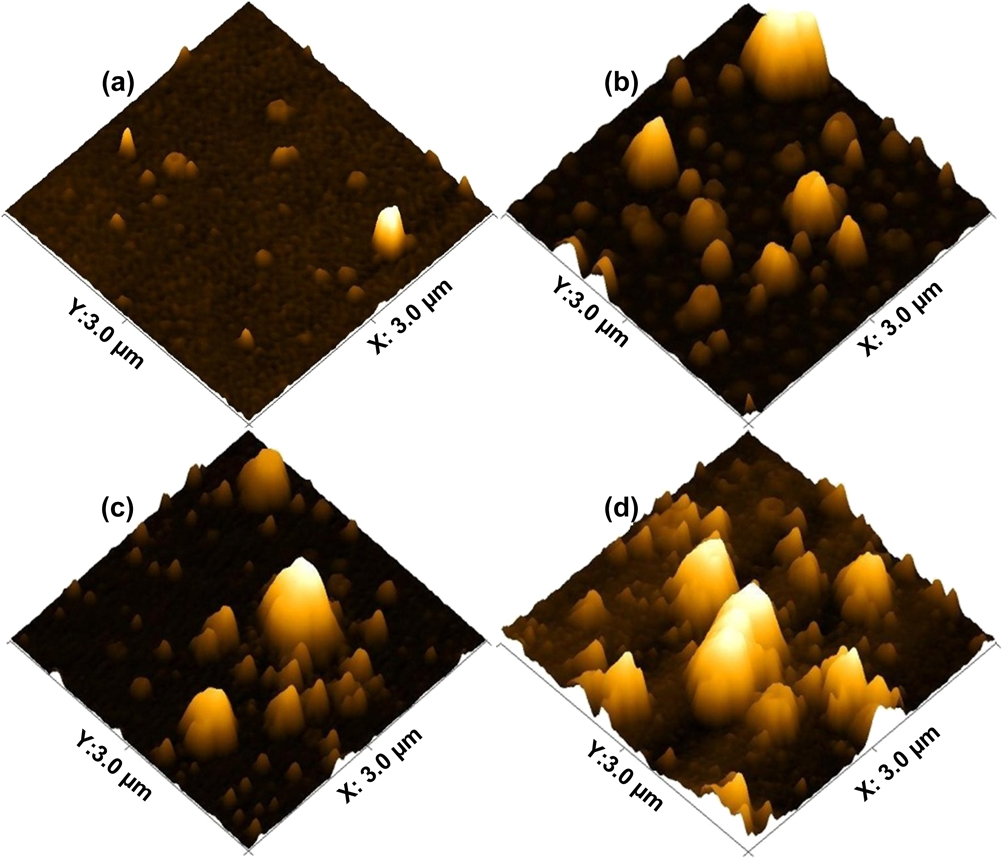
Figure 6 depicts AFM topographic images of the films deposited on silicon substrates. Film roughness, based on the arithmetic average value determined from AFM measurements, has been assessed as a function of beam frequency. The data reveal that as the frequency is increased, film roughness increases, i.e., nearly 1 nm (1 Hz), 8 nm (2 Hz), 8 nm (4 Hz), and 10 nm (8 Hz). At high beam frequency, i.e., high deposition rate, the density of nuclei on the substrate is higher, and the number of nuclei that coalesce to form large-size globules is higher resulting in higher film roughness.Reference Semaltianos33 Film roughening has also been reported to be caused by statistical fluctuations of the vapor flux impinging on the substrate during deposition.Reference Zangwill35 This phenomenon is likely to yield high film roughness with the increase in film thickness.
Topographs of films deposited on Si(100) at (a) 1 Hz, (b) 2 Hz, (c) 4 Hz, and (d) 8 Hz.

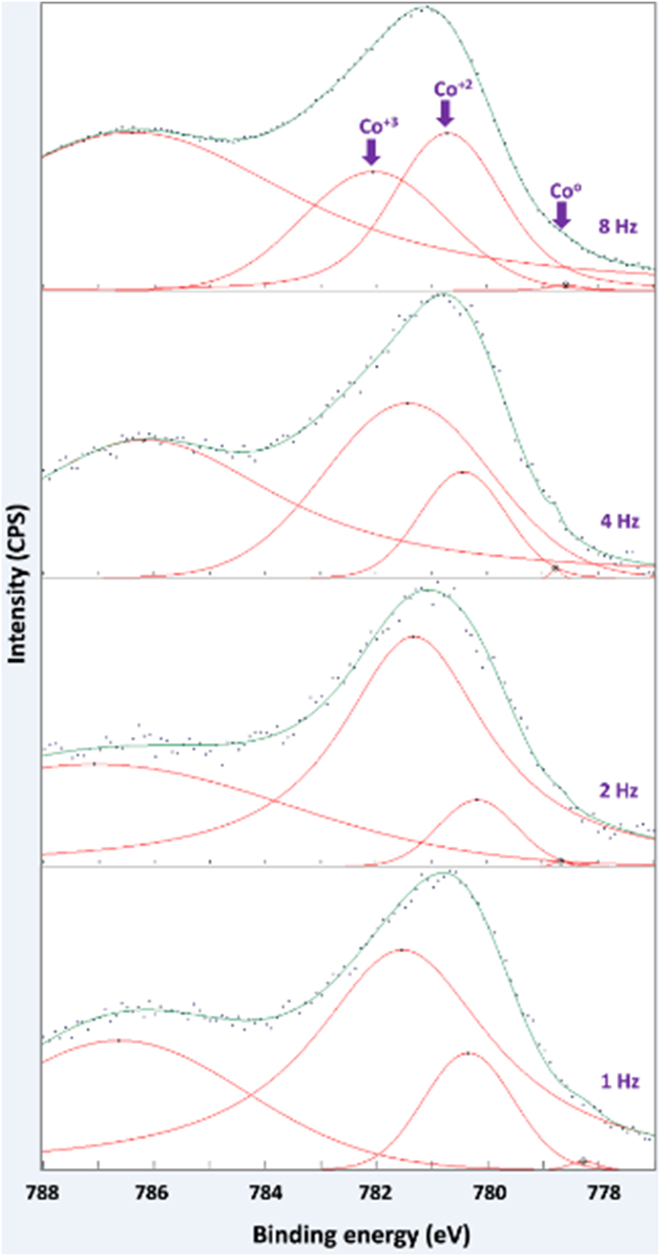
The near-surface chemical bonding in the films has been analyzed using XPS. Figure 7 depicts narrow scan XPS spectra of Co 2p 3/2 peaks and their deconvolutions as a function of beam frequency. The data, as per Fig. 6, reveal that the peaks are well-fitted with the reported values of binding energies for cobalt oxides and Co0. The obtained XPS spectra peaks have been fitted by one or more pseudo-Voigt functions. The binding energy peak at 780.5 eV is assigned to the Co+2 valance state,Reference Ivill, Peartonm, Rawal, Leu, Sadik, Das, Hebard, Chisholm, Budai and Norton36 and the small shoulder (peak) located at around 778–779 eV is attributed to metallic Co (Co0).Reference Peng, Liew, Song, An, Teo and Chong37,Reference Tortosa, Mollar, Manjón, Marí and Royo38 The peak at around 782.8–783.3 eV is attributed to the Co+3 oxidation state.Reference Zhou, Zhang, Wang, Wei, Tang, Shi and Xiong39,Reference de Lima Alves, Amorim, Torres, Bezerra, de Medeiros, Gastelois, Outon and de Almeida Macedo40 The intensity ratio of Co+2 and Co+3 signals in the films changes because of the possibility of oxidation of Co+2 to Co+3. The exact nature of the cobalt defect in the structure cannot be unequivocally determined with XPS measurements.Reference Zhou, Zhang, Wang, Wei, Tang, Shi and Xiong39 The data indicate that a substantial portion of Co atoms are present in the films in +2 and +3 valance states. The co-existence of +2 and +3 of Co valance states suggests the presence of CoO and Co2O3 phases in CZO films near the film surface.Reference Vadiyar, Kolekar, Chang, Kashalec and Ghulec41 The beam frequency does not seem to strongly affect Co concentration in the films but rather only marginally.
Typical XPS narrow scan spectra of Co 2p 3/2 peaks of the films deposited at various beam frequencies on Si(100).

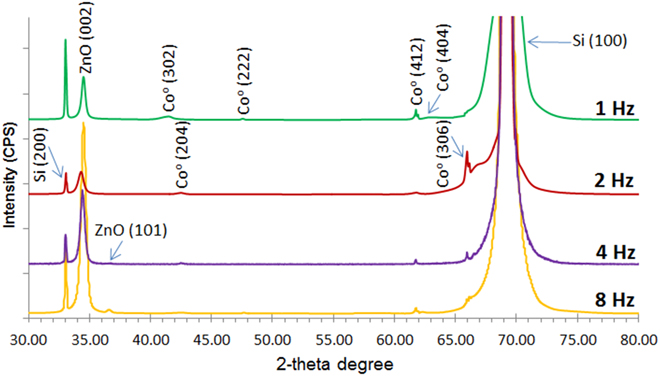
Figure 8 shows XRD patterns of the film deposited on Si(100) at beam frequencies of 1, 2, 4, and 8 Hz. The characteristic peak of ZnO hexagonal wurtzite structure (002) can be observed at 2θ ∼ 34.43° for the film deposited at 1 and 2 Hz, and the film deposited at a beam frequency of 4 and 8 Hz exhibits an additional peak (101) for ZnO at 2θ ∼ 36.26° (PDF card No. 01-070-8070). One can notice that the film deposited at beam frequencies of 4 and 8 Hz have higher and sharper diffraction peaks at ∼34.43°, indicating an improvement in the (002) plane intensity relatively to the film deposited at low beam frequencies, viz., 1 and 2 Hz. Thus, at higher beam frequencies (4 Hz, 8 Hz), the sharper diffraction and higher intensity of the peak (002) correspond to higher degree of crystallinity in CZO films.Reference Moholkar, Shinde, Babar, Sim, Kwon, Rajpure, Patil, Bhosale and Kim25,Reference Shewalea and Yua42 This is in agreement with reported observations,Reference Fuenzalida27 whereby film crystallinity appears to improve as film thickness increases, which is the case as beam frequency is increased. The beam frequency does not appear to affect metallic cobalt content in the films, which is in accordance with the findings of XPS measurements. The data, see Fig. 7, reveal four diffraction peaks attributed to metallic Co at around 2θ = 41.6°, 47.1°, 61.7°, and 62.6°. The presence of these peaks, viz., (302), (222), (412), and (404), agrees best with what is anticipated for hcp metallic Co (PDF card No. 01-070-2633).Reference Ali, Pinto, Henda and Fagerberg30,Reference Ali, Morrow, Henda and Fagerberg31 Diffraction peaks of the CoO phase, which correspond to 2θ = 34.1° (111), 68.31° (311), and 71.8° (222) (PDF card No. 01-075-0419), are not readily visible in the diffraction patterns shown in Fig. 7. The most likely reason for this is that these peaks overlap with some of the strong peaks attributed to ZnO, viz., plane (002), and Si, viz., plane (400). The crystallite size of Co and ZnO has been estimated from the XRD pattern using the Debye–Scherer’s formula. The data reveal that the average crystallite size of ZnO is nearly 25.71 nm (1 Hz), 16.97 nm (2 Hz), 16.52 nm (4 Hz), and 21.40 nm (8 Hz), whereas metallic Co exhibits an average crystallite size of nearly 36.62 nm (1 Hz), 25.79 (2 Hz), 9.41 (4 Hz), and 41.20 nm (8 Hz).
XRD patterns of films deposited on Si at beam frequencies of 1 Hz, 2 Hz, 4 Hz, and 8 Hz.

IV. CONCLUSIONS
CZO film NCs have been deposited on Si(100) by PEBA with an emphasis on the role of pulse frequency on the morphological, chemical, and structural properties for the films to have the potential as model nanocatalysts. The findings reveal that, overall, beam frequency can substantially affect the structural and morphological characteristics of the deposited films. From the SEM analysis, the film thickness increases as the beam frequency is increased, which has been explained in terms of changes in the ablation threshold of the target. The beam frequency of 4 Hz seems to be a critical value as it corresponds to the maximum (minimum) globule size (density), which has been elucidated in terms of the processes of nucleation, surface diffusion of adatoms, and metal clustering by coalescence. The reduced globule size in films deposited at lower beam frequency results in smoother films, as per quantitative AFM characterization, and the data reveal that the average film roughness increases with beam frequency as a consequence of high deposition rate and potential fluctuations in the vapor flux impinging on the substrate. The nanoparticle size does not seem to be appreciably influenced by the pulse frequency with the bulk of the particle size in the 6–10 nm range. Both XPS and XRD analyses confirm the existence of metallic Co in the deposited films and that beam frequency does not appear to substantially affect metallic Co content in the films. The experimental data hint at the potential of the deposited films as a model nanocatalyst in many reactive processes.
ACKNOWLEDGMENTS
A.A. is indebted to Ontario Ministry of Training, Colleges and Universities for providing an Ontario Graduate Scholarship (OGS). R.H. is thankful to the Canada Foundation for Innovation (CFI) and Natural Sciences and Engineering Research Council of Canada (NSERC) for the financial support.