1 Introduction
The behaviours of micro-organisms at interfaces play important roles in various biological, medical and engineering phenomena. For example, biofilm formation is initiated by the adhesion of cells at interfaces (van Loosdrecht et al. Reference van Loosdrecht, Lyklema, Norde and Zehnder1990; O’Toole, Kaplan & Kolter Reference O’Toole, Kaplan and Kolter2000; Lynch, Lappin-Scott & Costerton Reference Lynch, Lappin-Scott and Costerton2003). Biofilms on catheters can become reservoirs for systemic infection, and are therefore harmful (Kolter & Greenberg Reference Kolter and Greenberg2006). In a sewage treatment plant, on the other hand, biofilms are useful for extracting and digesting organic compounds (Wagner & Loy Reference Wagner and Loy2002; Reboleiro-Rivas et al. Reference Reboleiro-Rivas, Martín-Pascual, Juárez-Jiménez, Poyatos, Vílchez-Vargas, Vlaeminck, Rodelas and González-López2015). In biomining, micro-organisms are utilized for extraction of metals from ores or other solid materials (Rea, Zammit & Reith Reference Rea, Zammit and Reith2016; Banerjee et al. Reference Banerjee, Burrell, Reed, West and Banta2017). Moreover, accumulation of micro-organisms on surfaces may induce biofouling, which causes problems for pipelines, reservoirs, and ships (Flemming Reference Flemming2002; Lindholdt et al. Reference Lindholdt, Dam-Johansen, Olsen, Yebra and Kiil2015; Bucs et al. Reference Bucs, Farhat, Kruithof, Picioreanu, van Loosdrecht and Vrouwenvelder2018). Considering their widely recognized roles in nature and industrial applications, it is important to clarify the behaviours of micro-organisms at interfaces (van Loosdrecht et al. Reference van Loosdrecht, Lyklema, Norde and Zehnder2003).
The accumulation of bacteria on solid walls has been extensively investigated (Harshey Reference Harshey2003; Berke et al. Reference Berke, Turner, Horward and Lauga2008; Li & Tang Reference Li and Tang2009; Klapper & Dockery Reference Klapper and Dockery2010; Drescher et al. Reference Drescher, Dunkel, Cisneros, Ganguly and Goldstein2011; Ezhilan & Saintillan Reference Ezhilan and Saintillan2015). In flow environments, bacteria are reduced from low shear regions due to their trapping in high shear regions. The trapping mechanism can be explained by a competition between flow-induced cell alignment and a cell’s preference towards randomness in swimming orientation. Such shear-modulated trapping promotes an accumulation of cells near a wall (Rusconi, Guasto & Stocker Reference Rusconi, Guasto and Stocker2014; Barry et al. Reference Barry, Rusconi, Guasto and Stocker2015; Bearon & Hazel Reference Bearon and Hazel2015; Elgeti & Gompper Reference Elgeti and Gompper2015). When bacteria come close to a solid wall, they become entrapped within its vicinity, being drawn in according to a circular trajectory (Frymier et al. Reference Frymier, Ford, Berg and Cummings1995). The mechanism of this entrapment can be explained by hydrodynamic and steric effects (Lauga et al. Reference Lauga, Diluzio, Whitesides and Stone2006; Giacche, Ishikawa & Yamaguchi Reference Giacche, Ishikawa and Yamaguchi2010; Shum, Gaffney & Smith Reference Shum, Gaffney and Smith2010). An accumulation of cells near a solid wall can also be observed in the case of spermatozoa (Rothschild Reference Rothschild1963). Smith et al. (Reference Smith, Gaffney, Blake and Kirkman-Brown2009) reported that hydrodynamic interactions can trap spermatozoa in a stable orbit near a wall. Riedel, Kruse & Howard (Reference Riedel, Kruse and Howard2005) reported that the spermatozoa of sea urchins self-organize at high density into an array of vortices near a wall boundary. When subject to an imposed shearing flow, spermatozoa near a solid wall tend to swim upstream against the background flow, in a process known as rheotaxis (Kantsler et al. Reference Kantsler, Dunkel, Blayney and Goldstein2014); the mechanism for the same may be understood in terms of hydrodynamic and steric effects (Ishimoto & Gaffney Reference Ishimoto and Gaffney2015; Tung et al. Reference Tung, Ardon, Roy, Koch, Suarez and Wu2015; Omori & Ishikawa Reference Omori and Ishikawa2016). These previous studies illustrate the considerable influence of a wall boundary on the behaviours of cells.
The aforementioned studies illustrate considerable influence of rigid walls on the behaviour of cells, and thus, highlight the significance of boundaries on the swimmer dynamics. Now, another type of interface of interest is the water–air interface, i.e. a free surface. Schafer, Harms & Zehnder (Reference Schafer, Harms and Zehnder1998) showed that bacteria can also accumulate at the water–air interface. They speculated that a colloid-chemical approach combining DLVO (Derjaguin–Landau–Verwey–Overbeek) interactions and hydrophobic interactions may be appropriate to explain the bacterial accumulation at the water–air interface. The interaction of bacteria with hydrophobic interfaces can be modified by adding a surfactant, which may prevent biofilm formation (Glassman Reference Glassman1948; Neu Reference Neu1996).
An important implication of understanding the interaction of swimmers at a water–air interface is, for instance, on the survival of ciliates. Kristiansen et al. (Reference Kristiansen, Hagemeister, Grave and Hellung-Larsen1996) highlighted the importance of the water–air interface in the growth rate of Tetrahymena. They showed that the ratio of surface area to depth of the culture vessel considerably affected the survival rate of Tetrahymena. More recently, it was reported that Tetrahymena thermophila tended to become entrapped at a water–air interface, while they could escape from a water–solid interface (Ferracci et al. Reference Ferracci, Ueno, Numayama-Tsuruta, Imai, Yamaguchi and Ishikawa2013). While the escape mechanism can be explained by lubrication forces (Ishikawa Reference Ishikawa2019), the entrapment mechanism remains unclear. Ohmura et al. (Reference Ohmura, Nishigami, Taniguchi, Nonaka, Manabe, Ishikawa and Ichikawa2018) reported that Tetrahymena pyriformis was entrapped even by a water–solid interface, by stopping the ciliary beat at the interface. Drescher et al. (Reference Drescher, Leptos, Tuval, Ishikawa, Pedley and Goldstein2009) showed that green alga Volvox accumulated at a water–solid interface on top of a chamber because of the bottom-heaviness of the cells. The accumulated cells interacted hydrodynamically.
Inspired by the experimental observations, there have been a number of analytical investigations of the behaviours of ciliates at the water–air interface (Spagnolie & Lauga Reference Spagnolie and Lauga2012; Ishimoto & Gaffney Reference Ishimoto and Gaffney2013; Wang & Ardekani Reference Wang and Ardekani2013) as well as at the water–solid interface (Llopis & Pagonabarra Reference Llopis and Pagonabarra2010; Crowdy & Samson Reference Crowdy and Samson2011; Spagnolie & Lauga Reference Spagnolie and Lauga2012; Crowdy Reference Crowdy2013; Ishimoto & Gaffney Reference Ishimoto and Gaffney2013; Li & Ardekani Reference Li and Ardekani2014; Zottl & Stark Reference Zottl and Stark2014; Schaar, Zottl & Stark Reference Schaar, Zottl and Stark2015; Wysocki, Elgeti & Gompper Reference Wysocki, Elgeti and Gompper2015). These studies have clarified both the individual and collective behaviours of cells, and have provided a basis for understanding the behaviours of ciliates at interfaces. However, although some earlier studies have reported a stable trajectory of a model ciliate at the water–solid interface, none have been able to explain the entrapment phenomenon. Lubrication theory may suggest that a spherical squirmer can be stable at the water–air interface when the cell is directed vertically upwards (Ishikawa Reference Ishikawa2019). In Ferracci et al. (Reference Ferracci, Ueno, Numayama-Tsuruta, Imai, Yamaguchi and Ishikawa2013), nevertheless, the cell swam along the water–air interface with an inclination angle. Thus, the experimental observations of Ferracci et al. (Reference Ferracci, Ueno, Numayama-Tsuruta, Imai, Yamaguchi and Ishikawa2013) have not been fully clarified. Moreover, the effects of cell shape have not been fully addressed. Therefore, additional studies are required to further our understanding.
In this study, we numerically investigate the behaviour of a ciliate at water–air and water–solid interfaces. In § 2, we discuss the problem settings, models and basic equations. The model cell is assumed to propel itself by generating homogeneous tangential stress above the cell body, with no slip velocity on the cell surface. Prescribing stresses instead of velocities is more realistic, especially when the cell comes close to interfaces, because it permits no slip on the cell surface. Besides, the effect of non-spheroidal cell shape is investigated in this study, though former studies assumed a spherical or spheroidal cell shape. In § 3, we show that two major shape parameters, i.e. fore-and-aft asymmetry and a constriction, dominate the entrapment phenomenon at interfaces. In § 4, the mechanism of entrapment is discussed. In § 5, we present experimental observations of T. thermophila entrapped on the surface of an air bubble, and qualitatively discuss the shape of entrapped cells. Finally, in § 6, concluding remarks are presented, along with a brief comparison to former studies.
2 Basic equations and numerical methods
2.1 A ciliate model
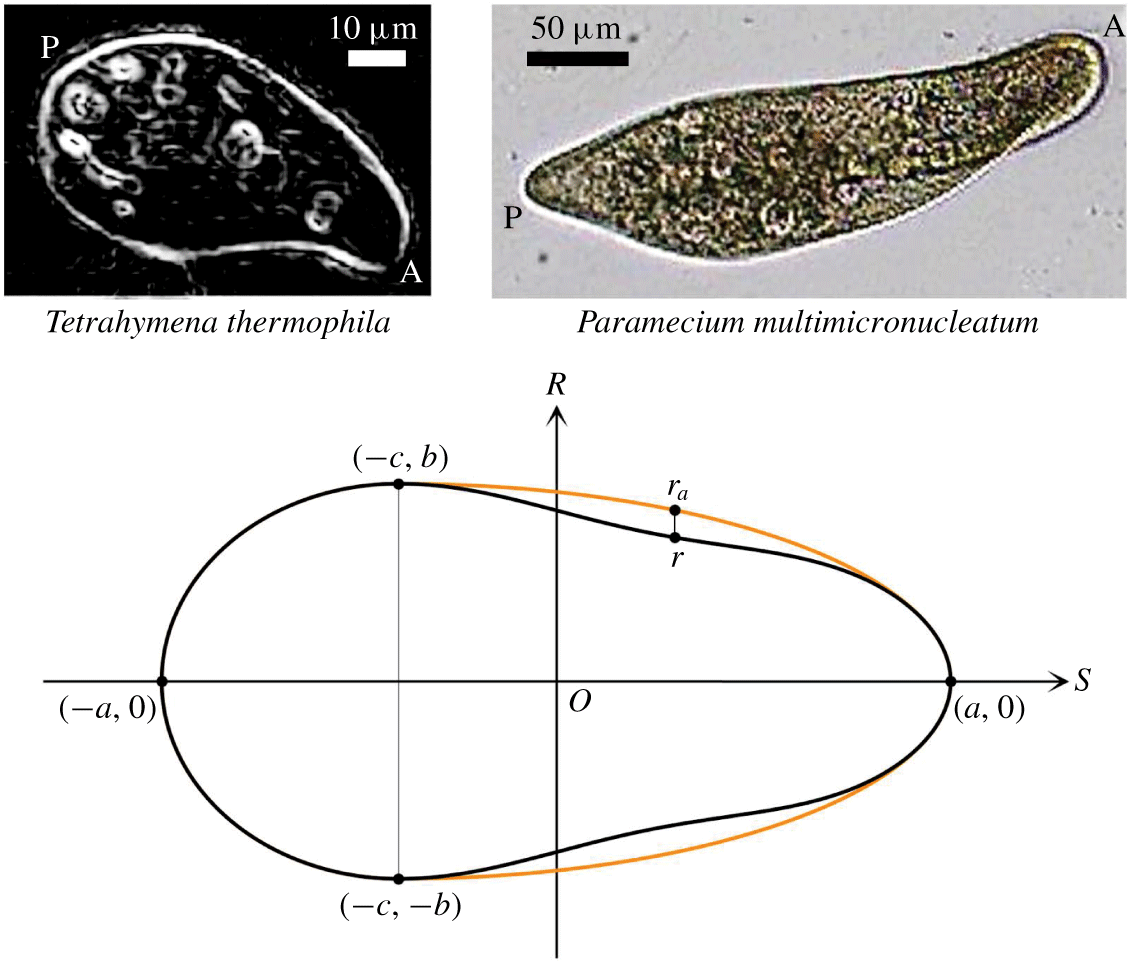
As shown in figure 1, the cell body is assumed to have fore-and-aft asymmetry and a constriction in the fore part of the body. The orientation of the cell is obtained in the  $S$-direction, and the cell shape is assumed to be axisymmetrical to the
 $S$-axis. Here,
 $a$ is the half-body length and
 $b$ is the length of the semi-minor axis. At
 $S=-c$, where
 $c\geqslant 0$, the cell body has the maximum radius
 $b$. The aspect ratio of the cell is defined as
 $\unicode[STIX]{x1D6FC}=a/b$. The strength of the fore-and-aft asymmetry is expressed by
 $\unicode[STIX]{x1D6FD}=c/a$.
Shape of a cell body with fore-and-aft asymmetry and constriction. Here,  $2a$ is the body length and
 $b$ is the radius of the semi-minor axis. At
 $S=-c$ (
 $c\geqslant 0$), the cell body has the maximum radius
 $b$. The aspect ratio of the cell is defined as
 $\unicode[STIX]{x1D6FC}=a/b$. The strength of the fore-and-aft asymmetry is expressed by
 $\unicode[STIX]{x1D6FD}=c/a$. The amplitude of the constriction is given by
 $\unicode[STIX]{x1D6FE}$. As a reference, the cell shape of T. thermophila is shown at top left (edges are enhanced), and that of Paramecium multimicronucleatum is shown at top right. In the images A and P indicate anterior and posterior sides, respectively.

Let  $(s,r)$ be the point on the surface of the cell body in the cylindrical coordinates
 $(S,R)$. When
 $s\leqslant -c$, the cell body is expressed by a spheroid, given by
 $$\begin{eqnarray}\frac{(s+c)^{2}}{(a-c)^{2}}+\frac{r^{2}}{b^{2}}=1.\end{eqnarray}$$
When  $s>-c$, the cell body is expressed by a spheroid with a constriction, given by
 $$\begin{eqnarray}\frac{(s+c)^{2}}{(a+c)^{2}}+\frac{r_{a}^{2}}{b^{2}}=1\quad \text{and}\quad r=r_{a}\left[1-\unicode[STIX]{x1D6FE}\left\{1-\cos \left(2\unicode[STIX]{x03C0}\frac{s+c}{a+c}\right)\right\}\right],\end{eqnarray}$$
where  $\unicode[STIX]{x1D6FE}$ defines the amplitude of the constriction. In figure 1, the cell body without the constriction is drawn as an orange curve, while that with the constriction is drawn as a black curve. In the present study, we vary three shape parameters,
 $\unicode[STIX]{x1D6FC}$,
 $\unicode[STIX]{x1D6FD}$ and
 $\unicode[STIX]{x1D6FE}$, to investigate the effects of shape on the behaviours of a cell near an interface. These parameters are selected to represent a wide variety of ciliates in nature (Brennen & Winet Reference Brennen and Winet1977). As a reference, the cell shapes of T. thermophila and Paramecium multimicronucleatum are shown in figure 1 as well.
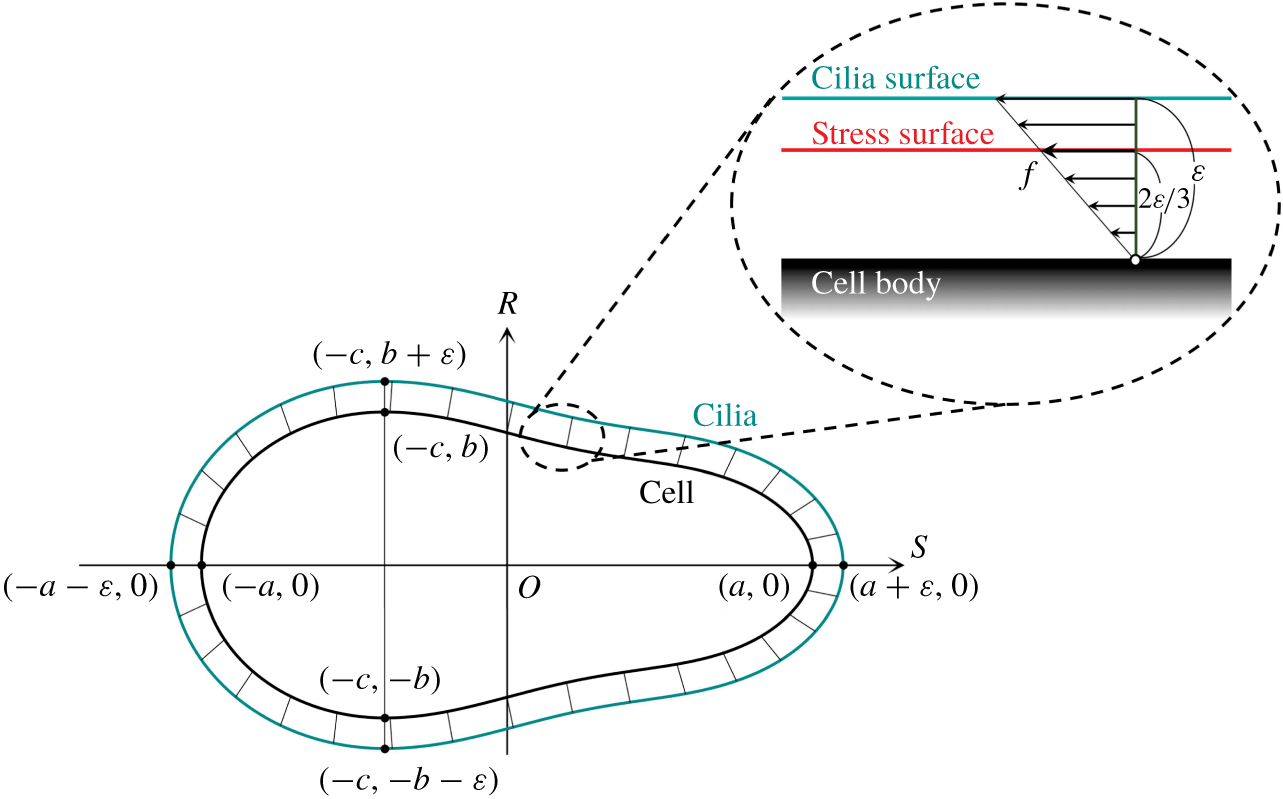
Schematics of the cell model. The cilia surface represents the tips of the cilia, and is placed  $\unicode[STIX]{x1D700}$ above the cell surface. The repulsive force between the cell and interface is generated when the cilia surface is deformed by collision with the interface. The stress surface represents the thrust generated by the ciliary beat, which is placed
 $2\unicode[STIX]{x1D700}/3$ above the cell surface.

The cell body is assumed to be rigid, and there is a no-slip boundary condition on its surface. In the case of a real ciliate, hundreds of hair-like slender organelles, called cilia, extend from the surface of the cell body (Brennen & Winet Reference Brennen and Winet1977). To express the cilia, we generate two additional surfaces: (a) a cilia surface, and (b) a stress surface. The cilia surface expresses the tips of cilia, which are located  $\unicode[STIX]{x1D700}$ above the cell surface, as shown in figure 2, where
 $\unicode[STIX]{x1D700}$ represents the length of a cilium. A repulsive force between the cell body and the interface is generated when the cilia surface is deformed by the collision with the interface. We assume that the deformation of cilia is elastic, and the compressed cilium generates a repulsive force proportional to the displacement, like a spring. The repulsive force density
 $\boldsymbol{p}^{rep}$, i.e. the repulsive force per unit area, acting at a material point
 $\boldsymbol{x}_{b}$ on the cell body surface, is given by
 $$\begin{eqnarray}\boldsymbol{p}^{rep}=kH(\ell -\unicode[STIX]{x1D700})\boldsymbol{n},\quad H(y)=\left\{\begin{array}{@{}l@{}}0\,(y\geqslant 0),\\ y\,(y<0),\end{array}\right.\end{eqnarray}$$
where  $k$ defines the stiffness of the cilia surface, and
 $\boldsymbol{n}$ is the outwards normal vector at
 $\boldsymbol{x}_{b}$. Here,
 $\ell$ is the thickness of the cilia surface after contraction, which is equivalent to the distance between
 $\boldsymbol{x}_{b}$ and the interface in the
 $\boldsymbol{n}$ direction. The function
 $H$ ensures that the force cannot be attractive. We used a large value of
 $k$ to keep the deformation sufficiently small, such that the compression length of the cilia surface satisfies the equation
 $\unicode[STIX]{x1D700}-\ell <0.01a$ throughout this study.
The stress surface expresses the thrust generated by the ciliary beat. For simplicity, we assume that the thrust stress is time invariant and homogeneous on the stress surface. The stress surface is placed at  $2\unicode[STIX]{x1D700}/3$ above the cell surface, as shown in the inset of figure 2. If the thrust force generated by a cilium increases linearly from the base to the tip, the centre of the thrust force acts at
 $2\unicode[STIX]{x1D700}/3$ above the base, where we can neglect the contribution from the torque. The stress acting on the stress surface, i.e. the force density, is assumed to have strength
 $f$ and act in the tangential direction along the meridian line. Though the unique tangential direction may not be defined at the anterior/posterior ends, stress at these points does not contribute to the velocity field, given that the area of these points is infinitely small.
A swimmer can be characterized as a pusher, a puller or a neutral swimmer based on the force dipole. A puller generates the thrust force in front of the body, whereas a pusher generates the thrust force behind the body. When the cell shape is spherical or spheroidal, our ciliate model does not generate any force dipole, and the cell becomes a neutral swimmer. When the cell body has the fore-and-aft asymmetry, the dipole becomes non-zero, and the cells become weak pullers. Details of the pusher/puller characteristics are provided in appendix A.
2.2 Basic equations
We assume that the inertial effect is negligible around a swimming ciliate, and the flow field is governed by the Stokes equation. Stokes flow can be expressed by a boundary integral equation, as follows:
 $$\begin{eqnarray}\boldsymbol{u}(\boldsymbol{x})=-\frac{1}{8\unicode[STIX]{x03C0}\unicode[STIX]{x1D707}}\int \boldsymbol{J}(\boldsymbol{x},\boldsymbol{x}_{b})\boldsymbol{\cdot }\boldsymbol{q}(\boldsymbol{x}_{b})\,\text{d}A_{body}+\frac{1}{8\unicode[STIX]{x03C0}\unicode[STIX]{x1D707}}\int \boldsymbol{J}(\boldsymbol{x},\boldsymbol{x}_{s})\boldsymbol{\cdot }\boldsymbol{f}(\boldsymbol{x}_{s})\,\text{d}A_{str},\end{eqnarray}$$
where  $\boldsymbol{u}$ is the velocity,
 $\unicode[STIX]{x1D707}$ is the viscosity,
 $\boldsymbol{q}$ is the traction vector on the cell body surface and
 $\boldsymbol{f}$ is the thrust vector on the stress surface. Here,
 $\boldsymbol{x}_{b}$ represents a material point on the cell body surface
 $A_{body}$, and
 $\boldsymbol{x}_{s}$ represents a material point on the stress surface
 $A_{str}$. Here,
 $\boldsymbol{J}$ is Green’s function for a half-space bounded by an infinite flat interface.
In this study, interfaces are placed at  $z=0$. The water–air interface is modelled as a stress-free surface, whereas the water–solid interface is modelled as a no-slip surface, i.e. a zero-velocity surface. Green’s functions for the free surface
 $\boldsymbol{J}^{\,f}$ are as follows (Blake Reference Blake1975):
 $$\begin{eqnarray}J_{ij}^{f}=J_{ij}^{\infty }+J_{ij}^{m},\end{eqnarray}$$
 $$\begin{eqnarray}\text{with}\quad J_{ij}^{\infty }=\frac{\unicode[STIX]{x1D6FF}_{ij}}{r}+\frac{r_{i}r_{j}}{r^{3}},\quad \text{and}\quad J_{ij}^{m}=\frac{\unicode[STIX]{x1D6FF}_{ij}}{R}+\frac{R_{i}R_{j}}{R^{3}},\end{eqnarray}$$
where  $\unicode[STIX]{x1D6FF}$ is the Kronecker delta,
 $\boldsymbol{r}$ is a vector pointing from the source point
 $\boldsymbol{s}$ to the observation point
 $\boldsymbol{x}$, and
 $\boldsymbol{R}$ is a vector pointing from the mirror source point
 $\boldsymbol{s}^{m}$ to the observation point
 $\boldsymbol{x}$. The mirror source point
 $\boldsymbol{s}^{m}$ has the same
 $x$ and
 $y$ components as
 $\boldsymbol{s}$, while the
 $z$ component has the opposite sign. The water–air interface is assumed flat throughout the study. By comparing the order of magnitude of thrust and interfacial forces during collision of Tetrahymena with a water–air interface (cf. figure 14), it can be inferred whether the ciliary force deforms the interface. Tetrahymena has a body length of approximately
 $65~\unicode[STIX]{x03BC}\text{m}$, and its swimming velocity is approximately
 $200~\unicode[STIX]{x03BC}\text{m}~\text{s}^{-1}$. The thrust force
 $F_{t}$ can be estimated by using the Stokes drag law as
 $F_{t}\approx 10^{-10}~\text{N}$. Pressure difference
 $\unicode[STIX]{x0394}p$ across a curved water–air interface, on the other hand, is given by the Young–Laplace equation. By using a surface tension of
 $0.07~\text{N}~\text{m}^{-1}$ and a radius of
 $32.5~\unicode[STIX]{x03BC}\text{m}$, the interfacial force
 $F_{p}$ due to the pressure difference can be estimated as
 $F_{i}\approx 10^{-5}~\text{N}$. Since
 $F_{i}$ is five orders of magnitude larger than
 $F_{t}$, the ciliary force cannot appreciably deform the interface.
Green’s functions for the no-slip surface  $\boldsymbol{J}^{n}$ is given as follows (Blake Reference Blake1975):
 $$\begin{eqnarray}J_{ij}^{n}=J_{ij}^{\infty }-J_{ij}^{m}+2|z|J_{ij}^{sd}+2z^{2}J_{ij}^{d},\end{eqnarray}$$
where  $|z|$ is the distance between the source point and the wall. The Stokes doublet
 $\boldsymbol{J}^{sd}$ and potential dipole
 $\boldsymbol{J}^{d}$ are given by
 $$\begin{eqnarray}\displaystyle & \displaystyle J_{ij}^{sd}=(\unicode[STIX]{x1D6FF}_{j\unicode[STIX]{x1D6FC}}\unicode[STIX]{x1D6FF}_{\unicode[STIX]{x1D6FC}l}-\unicode[STIX]{x1D6FF}_{j3}\unicode[STIX]{x1D6FF}_{3l})\left(\frac{\unicode[STIX]{x1D6FF}_{i3}R_{l}-\unicode[STIX]{x1D6FF}_{il}R_{3}-\unicode[STIX]{x1D6FF}_{3l}R_{i}}{R^{3}}+3\frac{R_{i}R_{l}R_{3}}{R^{5}}\right), & \displaystyle\end{eqnarray}$$
 $$\begin{eqnarray}\displaystyle & \displaystyle J_{ij}^{d}=(\unicode[STIX]{x1D6FF}_{j\unicode[STIX]{x1D6FC}}\unicode[STIX]{x1D6FF}_{\unicode[STIX]{x1D6FC}l}-\unicode[STIX]{x1D6FF}_{j3}\unicode[STIX]{x1D6FF}_{3l})\left(\frac{\unicode[STIX]{x1D6FF}_{il}}{R^{3}}-3\frac{R_{i}R_{l}}{R^{5}}\right). & \displaystyle\end{eqnarray}$$
As the cell body is rigid and the body surface has no slip, the following velocity boundary condition must be satisfied:
 $$\begin{eqnarray}\boldsymbol{u}(\boldsymbol{x}_{b})=\boldsymbol{U}+\unicode[STIX]{x1D734}\wedge (\boldsymbol{x}_{b}-\boldsymbol{x}_{g}),\end{eqnarray}$$
where  $\boldsymbol{U}$ and
 $\unicode[STIX]{x1D734}$ are the translational and rotational velocities, respectively, and
 $\boldsymbol{x}_{g}$ is the centroid of the cell body.
We assume that the cell body is neutrally buoyant and the centre of gravity coincides with the centre of geometry. Then, the force condition on the cell body is given by
 $$\begin{eqnarray}\int \boldsymbol{q}(\boldsymbol{x}_{b})\,\text{d}A_{body}-\int \boldsymbol{f}(\boldsymbol{x}_{s})\,\text{d}A_{str}+\int \boldsymbol{p}^{rep}(\boldsymbol{x}_{b})\,\text{d}A_{body}=0.\end{eqnarray}$$
The first term indicates the viscous drag, the second term indicates the reaction force from the stress surface, and the third term indicates the repulsive force from the interface. In a similar manner, the torque condition is given by
 $$\begin{eqnarray}\displaystyle \int (\boldsymbol{x}_{b}-\boldsymbol{x}_{g}) & \wedge & \displaystyle \boldsymbol{q}(\boldsymbol{x}_{b})\,\text{d}A_{body}-\int (\boldsymbol{x}_{s}-\boldsymbol{x}_{g})\wedge \boldsymbol{f}(\boldsymbol{x}_{s})\,\text{d}A_{str}\nonumber\\ \displaystyle & & \displaystyle +\int (\boldsymbol{x}_{b}-\boldsymbol{x}_{g})\wedge \boldsymbol{p}^{rep}(\boldsymbol{x}_{b})\,\text{d}A_{body}=0.\end{eqnarray}$$
2.3 Numerical methods
The numerical methods used in this study are similar to those in our previous study (Ishikawa, Simmonds & Pedley Reference Ishikawa, Simmonds and Pedley2006), so they are explained only briefly here. The governing equations are discretized by a boundary element method (Youngren & Acrivos Reference Youngren and Acrivos1975). By combining the boundary integral equation, the velocity boundary condition, and the force and torque conditions, a set of linear algebraic equations can be generated, which can be solved by the lower–upper (known as LU) decomposition method. The cell body surface and the stress surface are discretized by 512 triangular elements. Numerical integration is performed using four-point Gaussian polynomials, and the singularity is solved numerically (Pozrikidis Reference Pozrikidis1992). Time marching is performed using a second-order Runge–Kutta method.
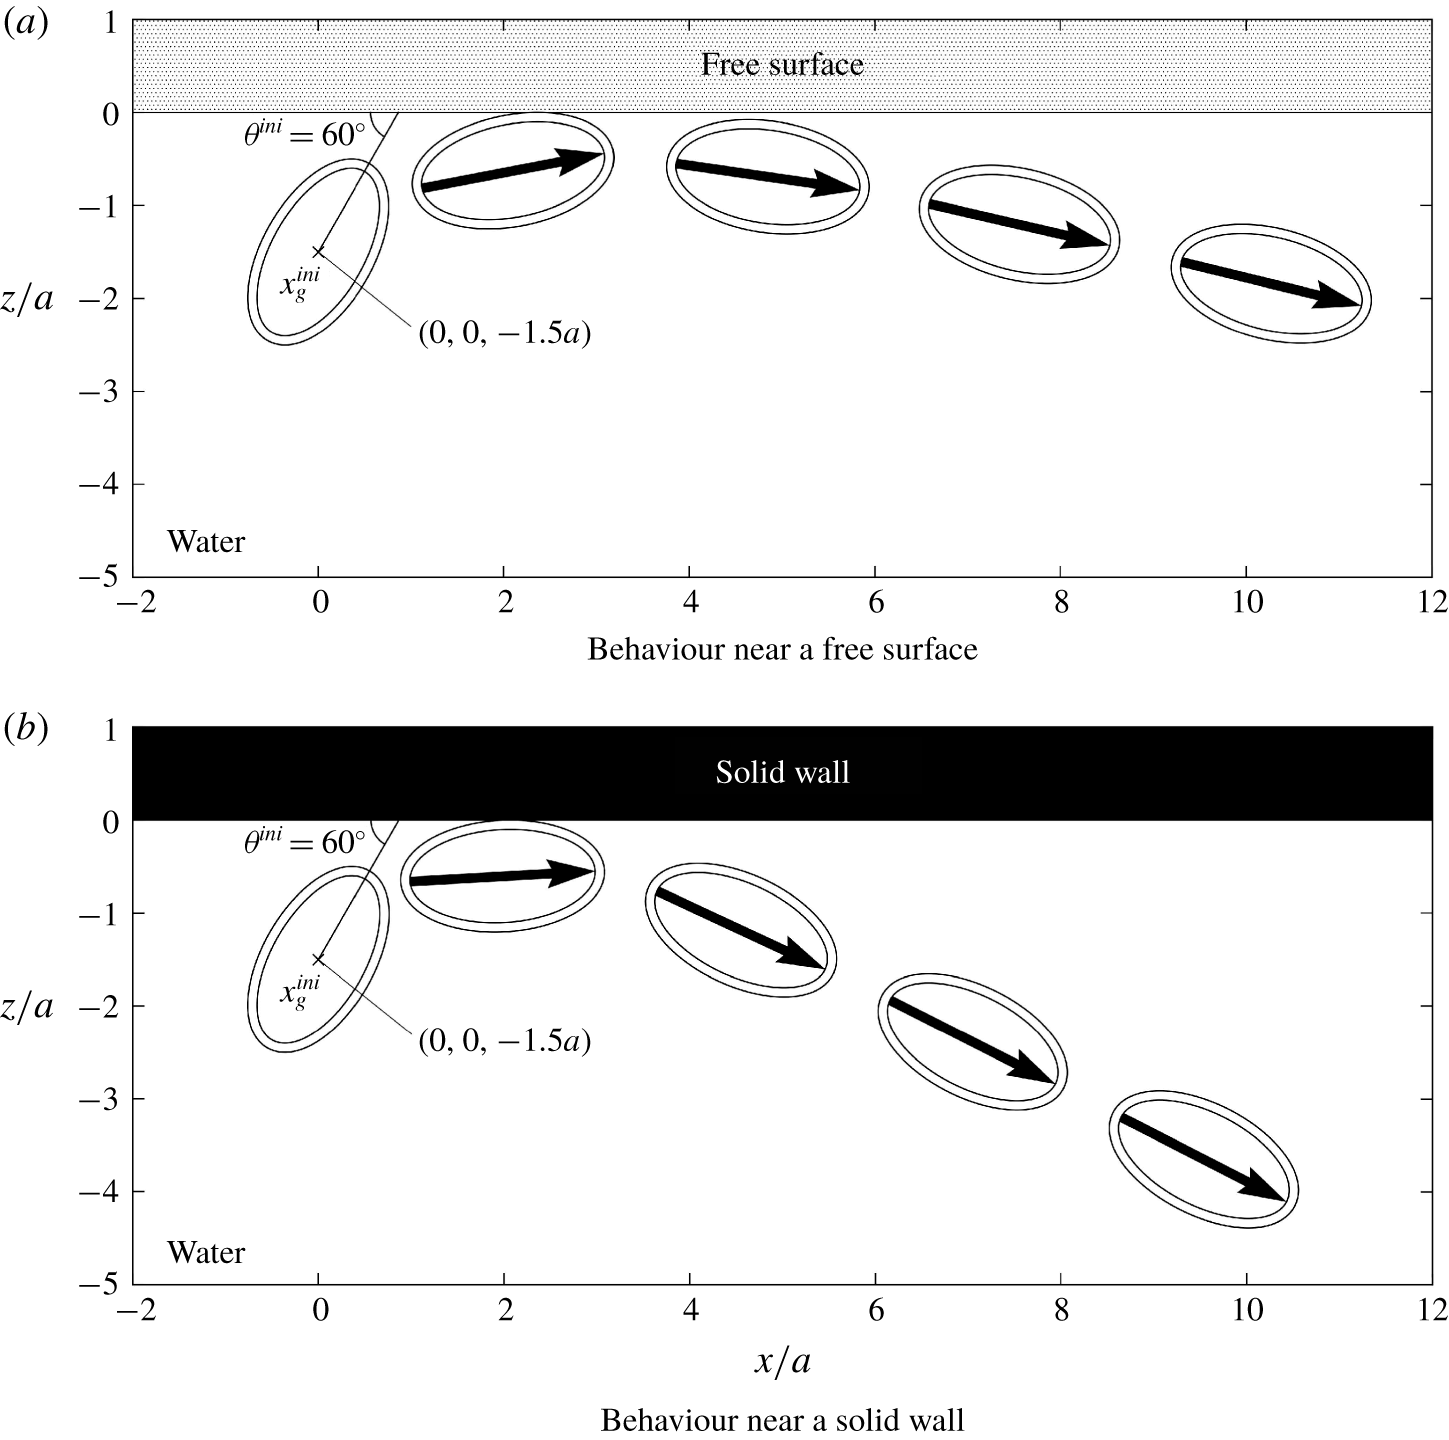
Position and orientation of a prolate spheroidal cell ( $\unicode[STIX]{x1D6FC}=2.0$,
 $\unicode[STIX]{x1D6FD}=0$,
 $\unicode[STIX]{x1D6FE}=0$) swimming near the interfaces. The interface is placed at
 $z=0$, and the cell is drawn with
 $2.8a/U_{0}$ time interval. The outer surface indicates the cilia surface, while the inner surface indicates the cell body surface. The large arrow indicates the cell’s orientation.

Initially, the centroid of the cell body is placed at  $\boldsymbol{x}_{g}=(0,0,-1.5a)$, as shown in figure 3, where the
 $x$-axis is horizontal and the
 $z$-axis is vertically upwards. The interface is placed at
 $z=0$. The orientation vector of the cell
 $\boldsymbol{e}$ is initially set as
 $\boldsymbol{e}=(\cos \unicode[STIX]{x1D703}^{ini},0,\sin \unicode[STIX]{x1D703}^{ini})$, where
 $\unicode[STIX]{x1D703}^{ini}$ is the initial orientation angle, defined as shown in figure 3. We dynamically simulate the behaviour of a cell until it is entrapped by or swims away from the interface. Three shape parameters, i.e. the aspect ratio
 $\unicode[STIX]{x1D6FC}$, the strength of fore-and-aft asymmetry
 $\unicode[STIX]{x1D6FD}$ and the amplitude of the constriction
 $\unicode[STIX]{x1D6FE}$, are varied in the range:
 $1\leqslant \unicode[STIX]{x1D6FC}\leqslant 3$,
 $0\leqslant \unicode[STIX]{x1D6FD}\leqslant 0.8$ and
 $0\leqslant \unicode[STIX]{x1D6FE}\leqslant 0.16$. The parameter range covers a wide variety of cell shapes, including those of Tetrahymena and Paramecium. The length scale of a cilium
 $\unicode[STIX]{x1D700}$ is set as
 $0.1a$ throughout this study to mimic Tetrahymena.
3 Behaviours at interfaces
3.1 Entrapment of an asymmetrical cell
We firstly investigate the swimming behaviour of a prolate spheroid with aspect ratio  $\unicode[STIX]{x1D6FC}=2.0$, which has neither fore-and-aft asymmetry nor the constriction. The cell is initially placed at
 $x_{g}=(0,0,-1.5a)$ with orientation angle
 $\unicode[STIX]{x1D703}^{ini}=60^{\circ }$. The subsequent position and orientation of the cell are shown in figure 3. As the orientation vector is initially placed in the
 $x{-}z$ plane, the trajectory remains in the
 $x{-}z$ plane due to the symmetry of the problem. The cell firstly collides with, and then swims parallel to and eventually away from, the interface. The basic tendencies are similar between the free surface and the solid wall, although the final orientation has a greater angle from the interface in the case of the solid wall than in the case of the free surface. We do not observe entrapment of the prolate spheroid at either interface.
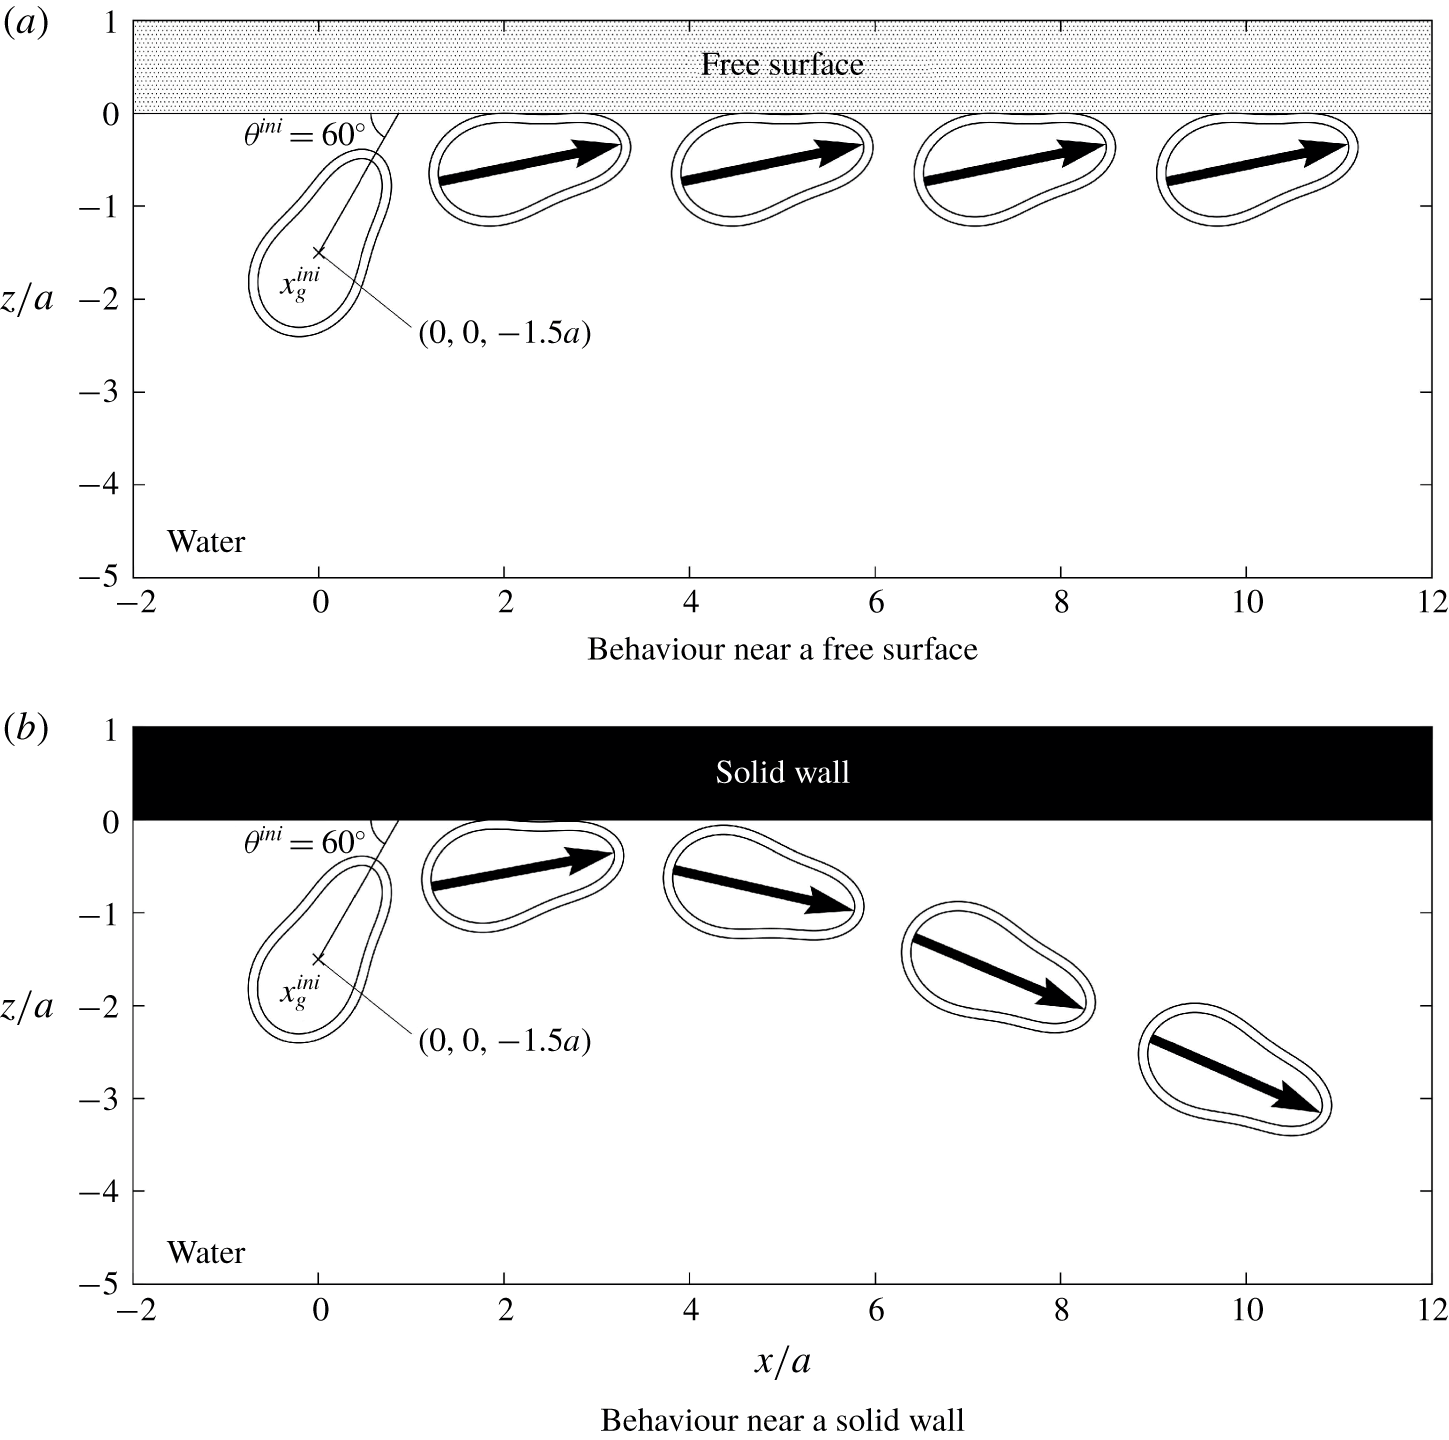
We then investigate the swimming behaviour of an asymmetrical cell with the constriction ( $\unicode[STIX]{x1D6FC}=2.0$,
 $\unicode[STIX]{x1D6FD}=0.4$,
 $\unicode[STIX]{x1D6FE}=0.08$). The variation in the cell’s position and its orientation with time are shown in figure 4. In the case of the free surface, the asymmetrical cell remains close to the interface, and maintains the same orientation after colliding with it. In the case of the solid wall, on the other hand, the asymmetrical cell swims away from the interface, similar to the case of a prolate spheroid (figure 3b). The behaviours of the asymmetrical cell are different between the free surface and solid wall.
Position and orientation of an asymmetrical cell with constriction ( $\unicode[STIX]{x1D6FC}=2.0$,
 $\unicode[STIX]{x1D6FD}=0.4$,
 $\unicode[STIX]{x1D6FE}=0.08$) swimming near the interfaces. The interface is placed at
 $z=0$, and the cell is drawn with
 $2.8a/U_{0}$ time interval. The outer surface indicates the cilia surface, while the inner surface indicates the cell body surface. The large arrow indicates the cell’s orientation.

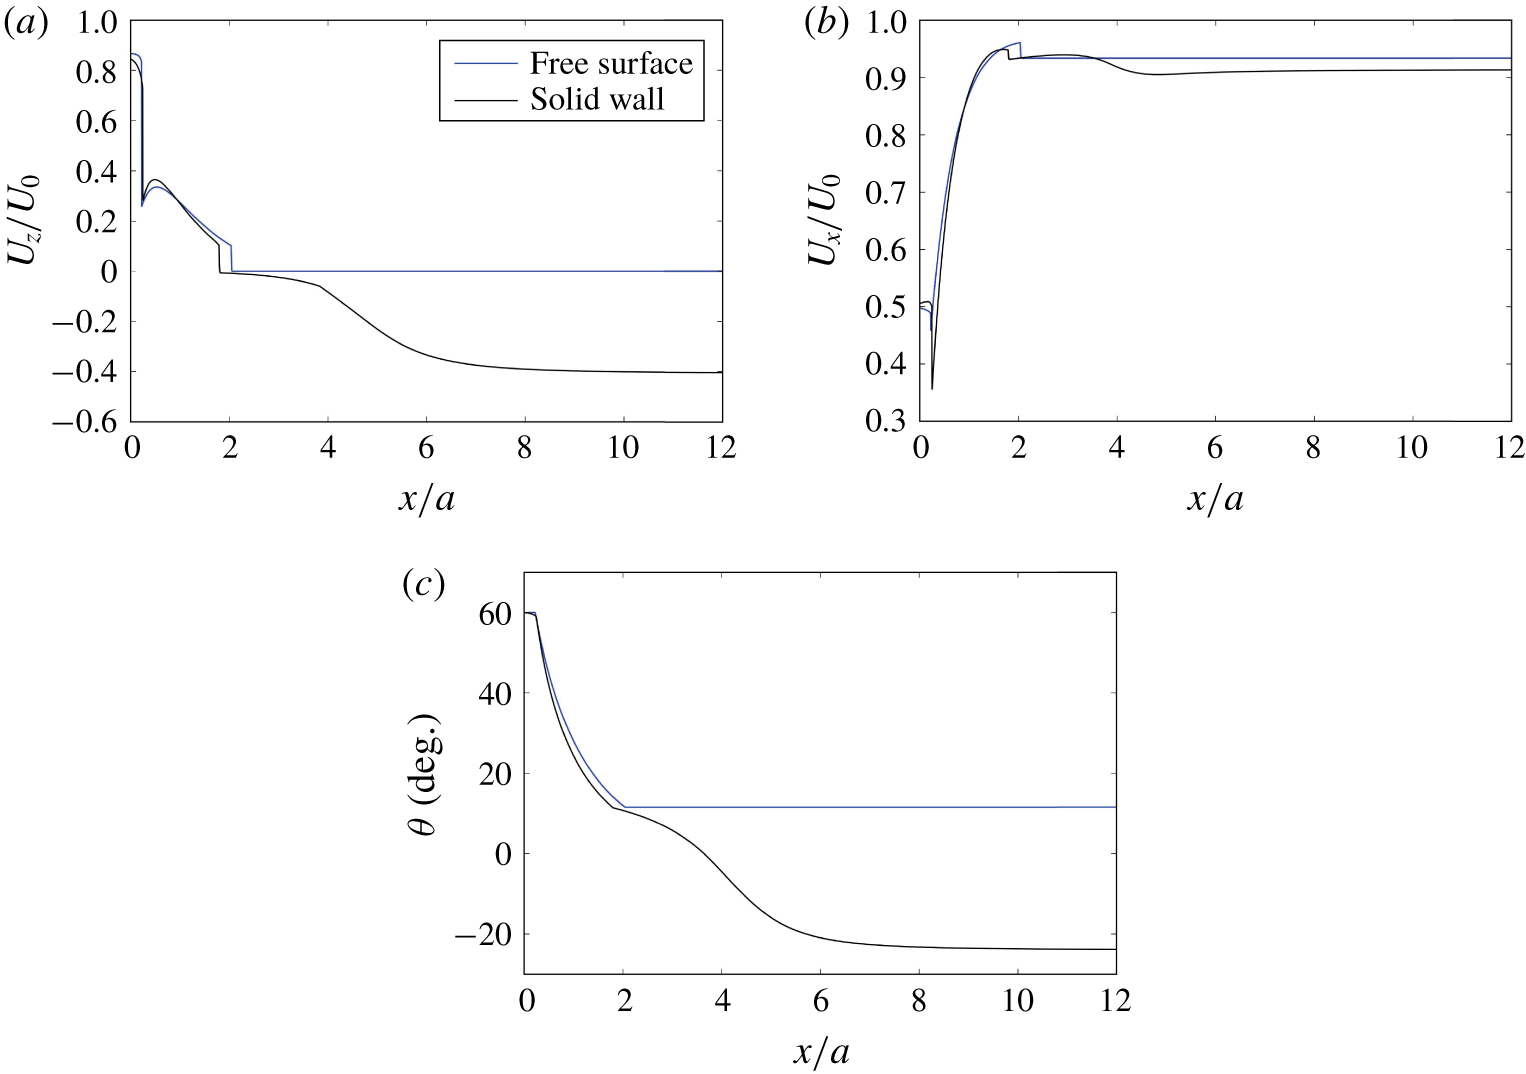
To discuss the behaviours quantitatively, we plot the vertical translational velocity  $U_{z}$ and orientation angle
 $\unicode[STIX]{x1D703}$ in figure 5. The velocity component is normalized by the swimming velocity without an interface
 $U_{0}$. Two kinks in the plot are caused due to geometry of the cell. The cell collides at the wall from its anterior side, and then from its posterior side. This is because the cell has a negative curvature. We can see that
 $U_{z}$ of the free surface case is zero in the region
 $x>2$, indicating that the cell remained at the free surface for a long time. The orientation angle of the entrapped cell at the free surface is approximately
 $12^{\circ }$. Thus, the cell is entrapped at a constant angle directed slightly upwards. The horizontal velocity
 $U_{x}$ is also plotted in the figure. The horizontal velocity does not decrease considerably, even when the cell is trapped at the free surface.
Changes in the velocity and orientation angle of the asymmetrical cell with constriction ( $\unicode[STIX]{x1D6FC}=2.0$,
 $\unicode[STIX]{x1D6FD}=0.4$,
 $\unicode[STIX]{x1D6FE}=0.08$) swimming near the interfaces. (a) Change of the vertical velocity
 $U_{z}$ with
 $x$. (b) Change of the horizontal velocity
 $U_{x}$ with
 $x$. (c) Change of the orientation angle
 $\unicode[STIX]{x1D703}$ with
 $x$, where negative
 $\unicode[STIX]{x1D703}$ indicates that the cell is directed away from the interface.

In a previous experimental study (Ferracci et al. Reference Ferracci, Ueno, Numayama-Tsuruta, Imai, Yamaguchi and Ishikawa2013), a ciliate (Tetrahymena) was shown to be entrapped by a water–air interface but escaped from a water–solid interface. Our results successfully reproduced the experimental observations by introducing fore-and-aft asymmetry and the constriction into the cell shape. However, Ferracci et al. (Reference Ferracci, Ueno, Numayama-Tsuruta, Imai, Yamaguchi and Ishikawa2013) also observed a decrease in the sliding velocity of Tetrahymena at the fluid–air interface. No such tendency was reproduced in this study, suggesting that Tetrahymena at the water–air interface may alter its ciliary beat, as reported by Ohmura et al. (Reference Ohmura, Nishigami, Taniguchi, Nonaka, Manabe, Ishikawa and Ichikawa2018).
3.2 Stability of the entrapment
Although the asymmetrical cell was entrapped at the free surface in the previous section, the stability of the entrapment phenomenon is unclear. Therefore, we perform numerical investigations, as described in this section. Here, we define the collision distance  $h$ as follows. When the cilia surface collides with the interface and the surface is deformed,
 $h$ indicates the maximum deformation of the cilia surface and has a positive value. When the whole cilia surface is below the interface and there is no collision,
 $h$ indicates the nearest
 $z$-position of the cilia surface relative to the interface, and the sign of
 $h$ is negative.
 $h$ is an indicator of geometrical interactions between the cilia surface and the interface, and is given mathematically as
 $$\begin{eqnarray}h=\left\{\begin{array}{@{}ll@{}}\max (\unicode[STIX]{x1D700}-\ell )\geqslant 0 & (\text{with collision})\\ \max (z_{cilia})<0 & (\text{without collision}).\end{array}\right.\end{eqnarray}$$
The maximum function is calculated over the cilia surface.
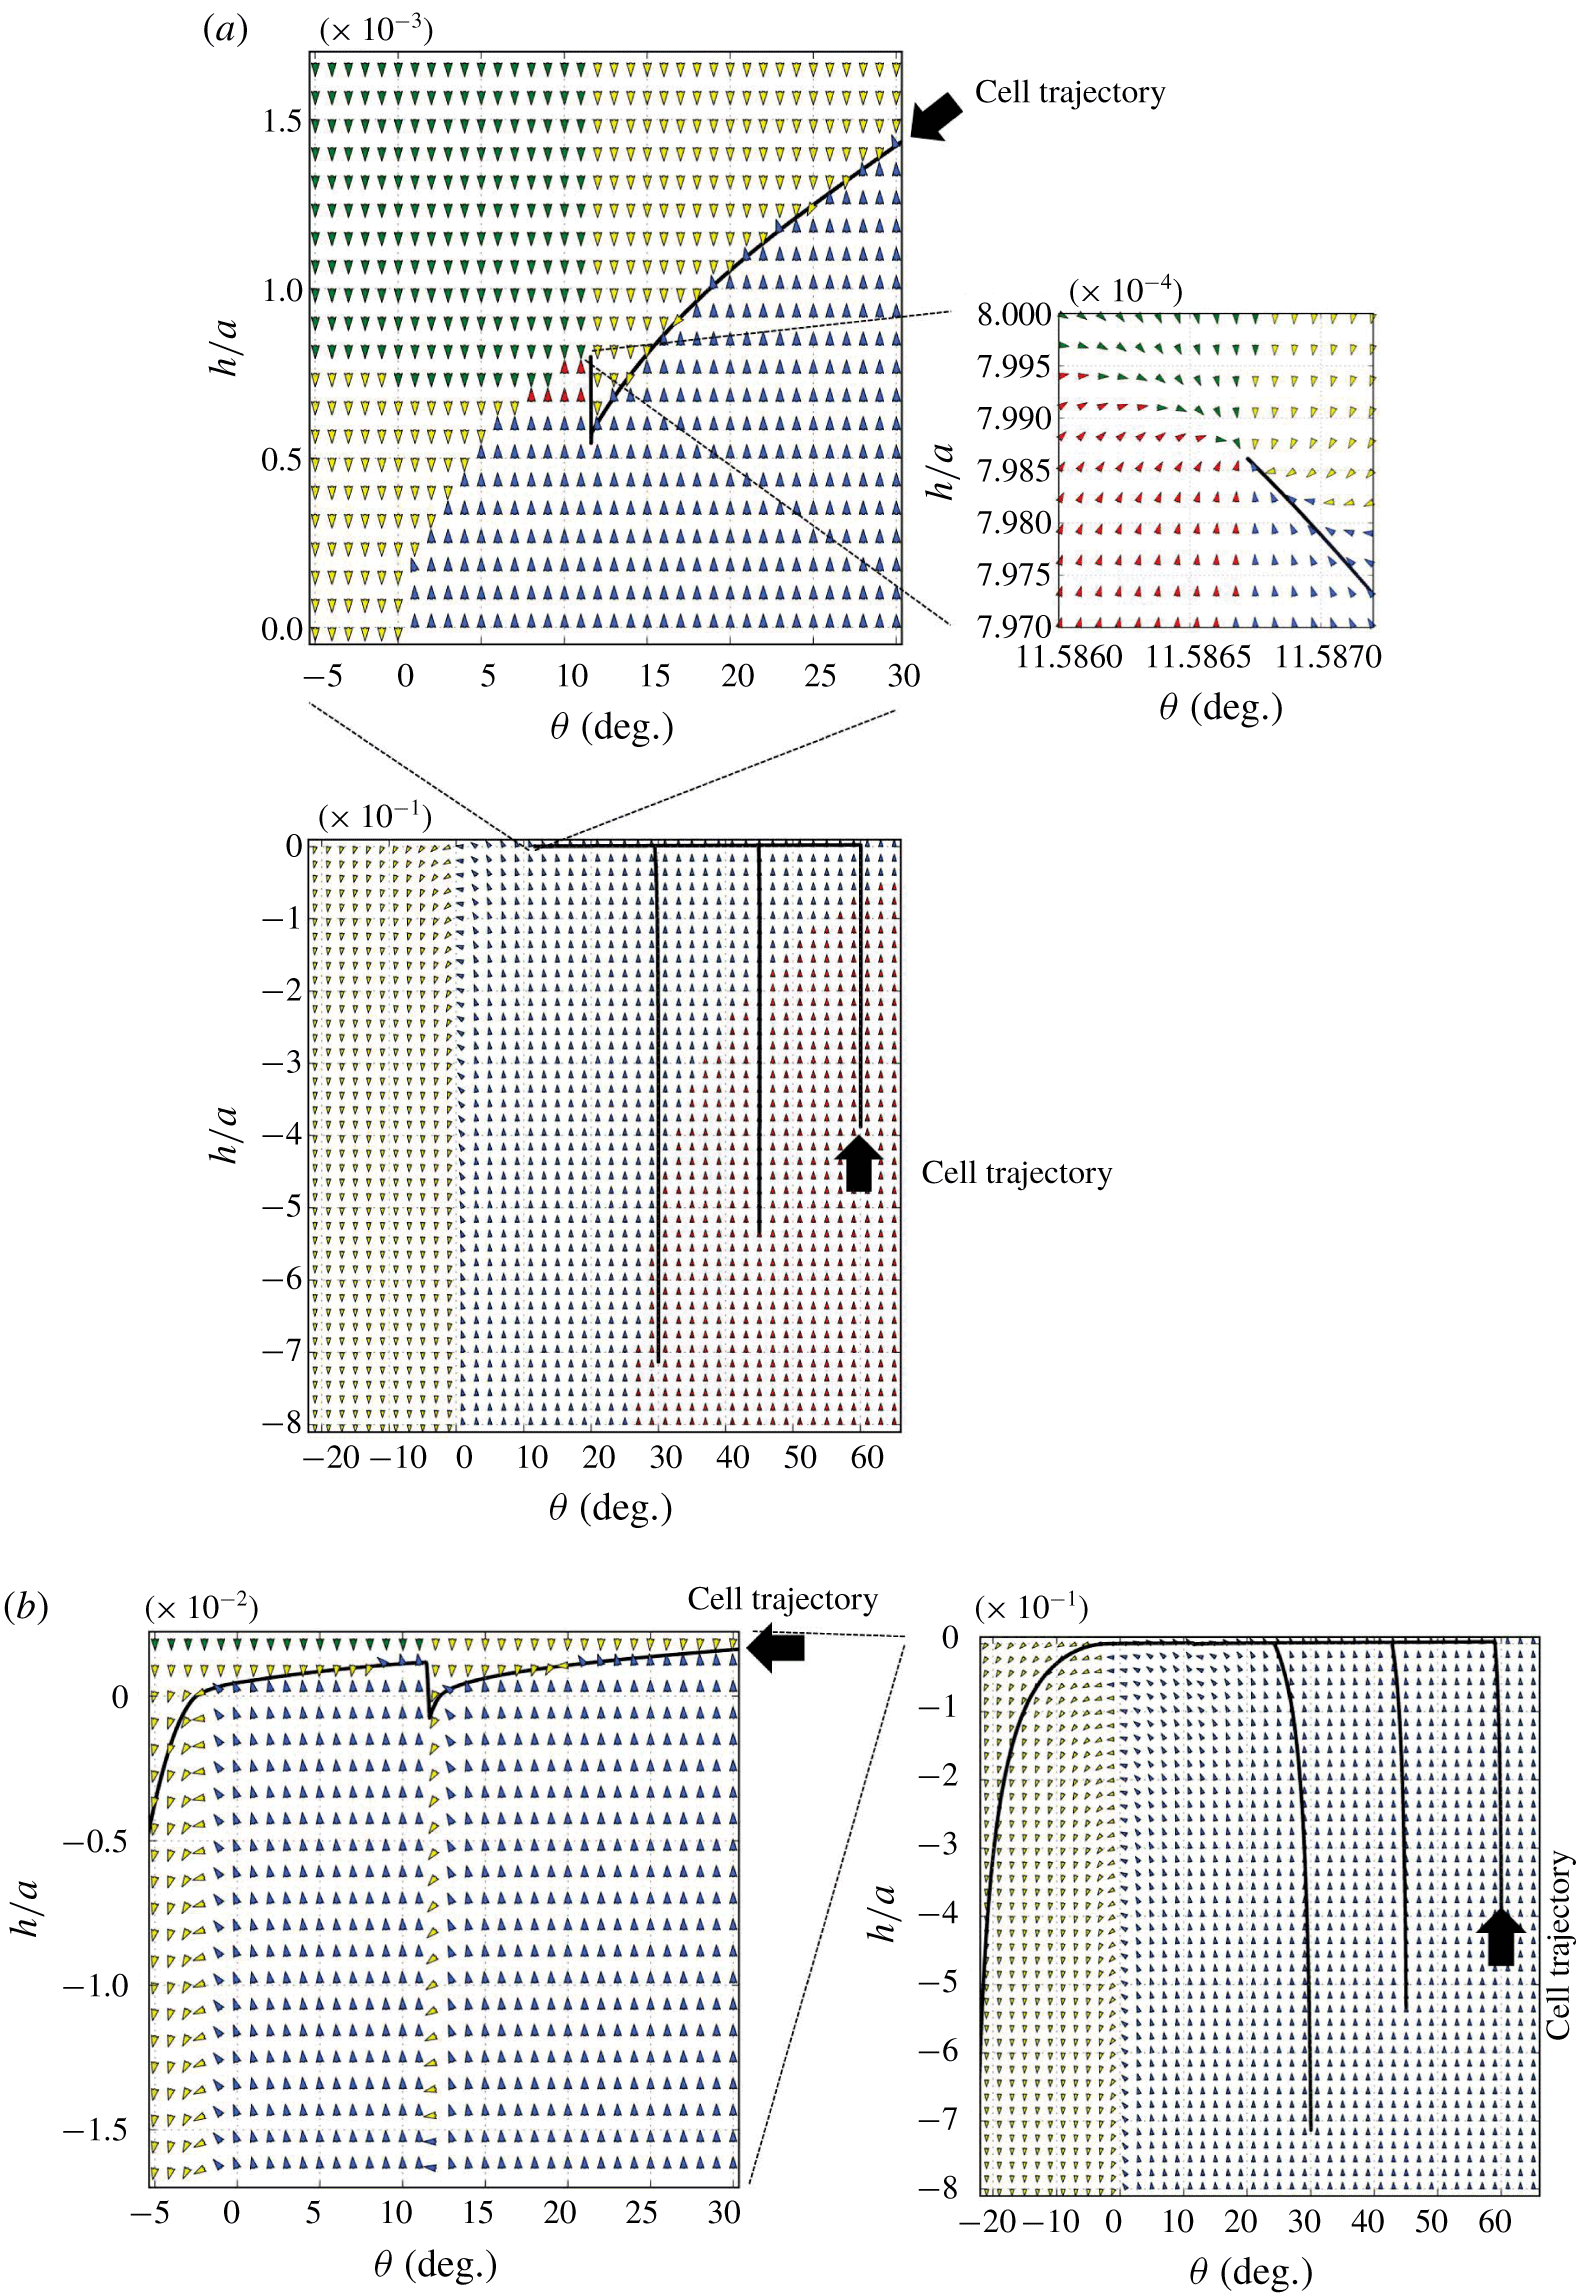
The vector field of the collision distance  $h$ and the orientation angle
 $\unicode[STIX]{x1D703}$ of the asymmetrical cell with constriction depicted in figure 4 (
 $\unicode[STIX]{x1D6FC}=2.0$,
 $\unicode[STIX]{x1D6FD}=0.4$,
 $\unicode[STIX]{x1D6FE}=0.08$). The arrows in the figure indicate the direction of change in the
 $h-\unicode[STIX]{x1D703}$ space. The colour of arrows is red when
 $\unicode[STIX]{x2202}\unicode[STIX]{x1D703}/\unicode[STIX]{x2202}t>0$ and
 $\unicode[STIX]{x2202}h/\unicode[STIX]{x2202}t>0$, green when
 $\unicode[STIX]{x2202}\unicode[STIX]{x1D703}/\unicode[STIX]{x2202}t>0$ and
 $\unicode[STIX]{x2202}h/\unicode[STIX]{x2202}t<0$, blue when
 $\unicode[STIX]{x2202}\unicode[STIX]{x1D703}/\unicode[STIX]{x2202}t<0$ and
 $\unicode[STIX]{x2202}h/\unicode[STIX]{x2202}t>0$, and yellow when
 $\unicode[STIX]{x2202}\unicode[STIX]{x1D703}/\unicode[STIX]{x2202}t<0$ and
 $\unicode[STIX]{x2202}h/\unicode[STIX]{x2202}t<0$. In the figure, actual trajectories of the asymmetrical cell with different initial conditions are also plotted. (a) At the free surface. (b) At the solid wall; the insets are the magnified plots around the stable point. The inset is the magnified plot.

Figure 6 shows how the collision distance  $h$ and orientation angle
 $\unicode[STIX]{x1D703}$ change under given
 $h$ and
 $\unicode[STIX]{x1D703}$ conditions for the asymmetrical cell shape with a constriction depicted in figure 4 (
 $\unicode[STIX]{x1D6FC}=2.0$,
 $\unicode[STIX]{x1D6FD}=0.4$,
 $\unicode[STIX]{x1D6FE}=0.08$). The arrows in the figure indicate the direction of change in the
 $\unicode[STIX]{x1D703}-h$ space; thus,
 $h$ and
 $\unicode[STIX]{x1D703}$ values change along the arrows. In the figure, the actual trajectories of the asymmetrical cell, shown in figure 4, with various initial conditions are also plotted in the
 $\unicode[STIX]{x1D703}-h$ space. We see that the trajectories with different initial conditions eventually collapse onto the same curve. As shown in figure 6(a), the cell’s trajectory at the free surface converges at approximately
 $(\unicode[STIX]{x1D703},h)=(11.6^{\circ },7.99\times 10^{-4}a)$. The magnified figure clearly illustrates that the converged point is stable in the
 $\unicode[STIX]{x1D703}-h$ space. Thus, the entrapment phenomenon found in the present study is stable regardless of small disturbances in the
 $h-\unicode[STIX]{x1D703}$ space. In the case of a solid wall, on the other hand, the trajectories with different initial conditions eventually collapse onto the same unstable curve, and we could not find any stable point in the resolution used in the simulation (cf. figure 6b). These results clearly illustrate the differences in behaviour of the asymmetrical cell between the free surface and the solid wall.
3.3 Effect of shape parameters
In this section, we discuss the effects of shape parameters on the behaviours of cells at the interfaces. Three shape parameters, i.e. the aspect ratio  $\unicode[STIX]{x1D6FC}$, the strength of fore-and-aft asymmetry
 $\unicode[STIX]{x1D6FD}$ and the amplitude of the constriction
 $\unicode[STIX]{x1D6FE}$, are varied in the ranges
 $1\leqslant \unicode[STIX]{x1D6FC}\leqslant 3$,
 $0\leqslant \unicode[STIX]{x1D6FD}\leqslant 0.8$ and
 $0\leqslant \unicode[STIX]{x1D6FE}\leqslant 0.16$, respectively. The initial conditions are the same as in figure 4, and the computations are continued until one of the following two conditions can be satisfied.
The first condition defines entrapment, in which the angle of the cell  $\unicode[STIX]{x1D703}$,
 $z$-component of the translational velocity
 $U_{z}$ and the magnitude of rotational velocity
 $|\unicode[STIX]{x1D6FA}|$ satisfy the following conditions:
 $$\begin{eqnarray}\unicode[STIX]{x1D703}>0,\quad |U_{z}|/U_{0}<10^{-5}\quad \text{and}\quad |\unicode[STIX]{x1D6FA}|a/U_{0}<10^{-5}.\end{eqnarray}$$
We note that the change in the cell’s orientation is less than  $1^{\circ }$ after the swimming distance of
 $1500a$ when
 $|\unicode[STIX]{x1D6FA}|a/U_{0}=10^{-5}$. Thus, the above conditions are suitable for measuring the entrapment phenomenon.
The second condition defines escape, in which  $\unicode[STIX]{x1D703}$,
 $U_{z}$ and
 $z$-components of the centroid of the cell body
 $x_{g,z}$ satisfy the following conditions:
 $$\begin{eqnarray}\unicode[STIX]{x1D703}<0,\quad x_{g,z}<-0.5a\quad \text{and}\quad U_{z}/U_{0}<0.\end{eqnarray}$$
As the cell’s orientation is downwards, it swims away from the interface quickly.
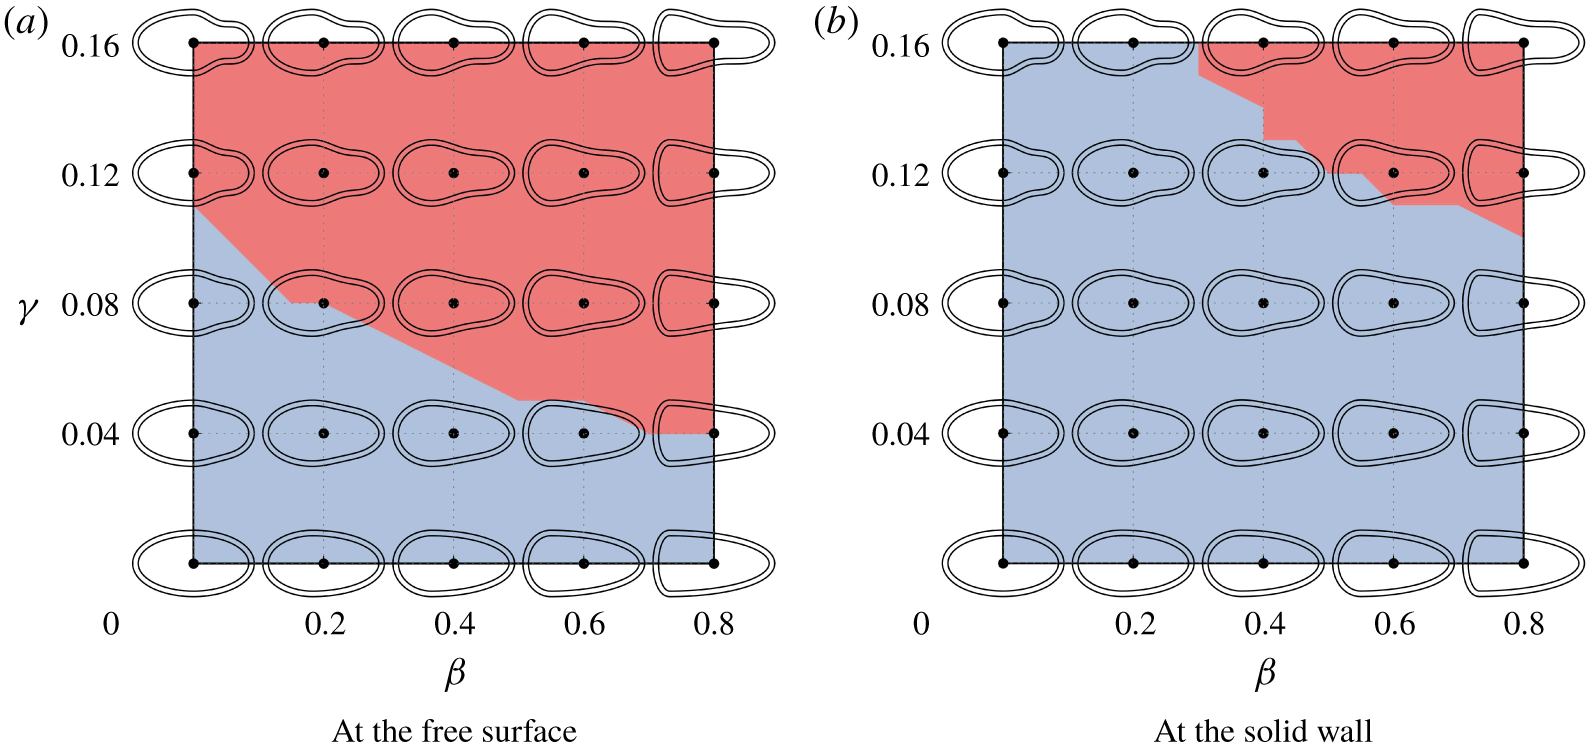
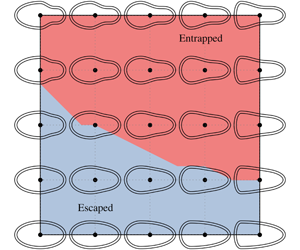
State diagram of the behaviours of cells with  $\unicode[STIX]{x1D6FC}=2$ at the interfaces. The red regions indicate that cells are entrapped, while the blue regions indicate that cells escape. The diagram is plotted in
 $\unicode[STIX]{x1D6FD}-\unicode[STIX]{x1D6FE}$ space, in which cell shapes are drawn for reference.

A state diagram of the behaviours of cells with  $\unicode[STIX]{x1D6FC}=2$ at the free surface and the solid wall is shown in figure 7. The entrapment region can be seen to also appear at the solid wall, when both
 $\unicode[STIX]{x1D6FD}$ and
 $\unicode[STIX]{x1D6FE}$ have large values. The entrapment region is much larger at the free surface than at the solid wall, which may explain why the entrapment phenomenon is observed only at the free surface in our previous study (Ferracci et al. Reference Ferracci, Ueno, Numayama-Tsuruta, Imai, Yamaguchi and Ishikawa2013). Both
 $\unicode[STIX]{x1D6FD}$ and
 $\unicode[STIX]{x1D6FE}$ have a considerable influence on the stability of entrapment. The cells can be characterized as neutral or weak pullers, as explained in appendix A. We see that the boundary of entrapped/escaped cells in figure 7 does not correspond to the curves of a constant stresslet in figure 16. Thus, pusher/puller characteristics may not play a major role in the entrapment phenomenon. Instead we see that entrapped cells have a large constriction or large fore-and-aft asymmetry. The reason why these characteristics are required will be discussed in the following section.
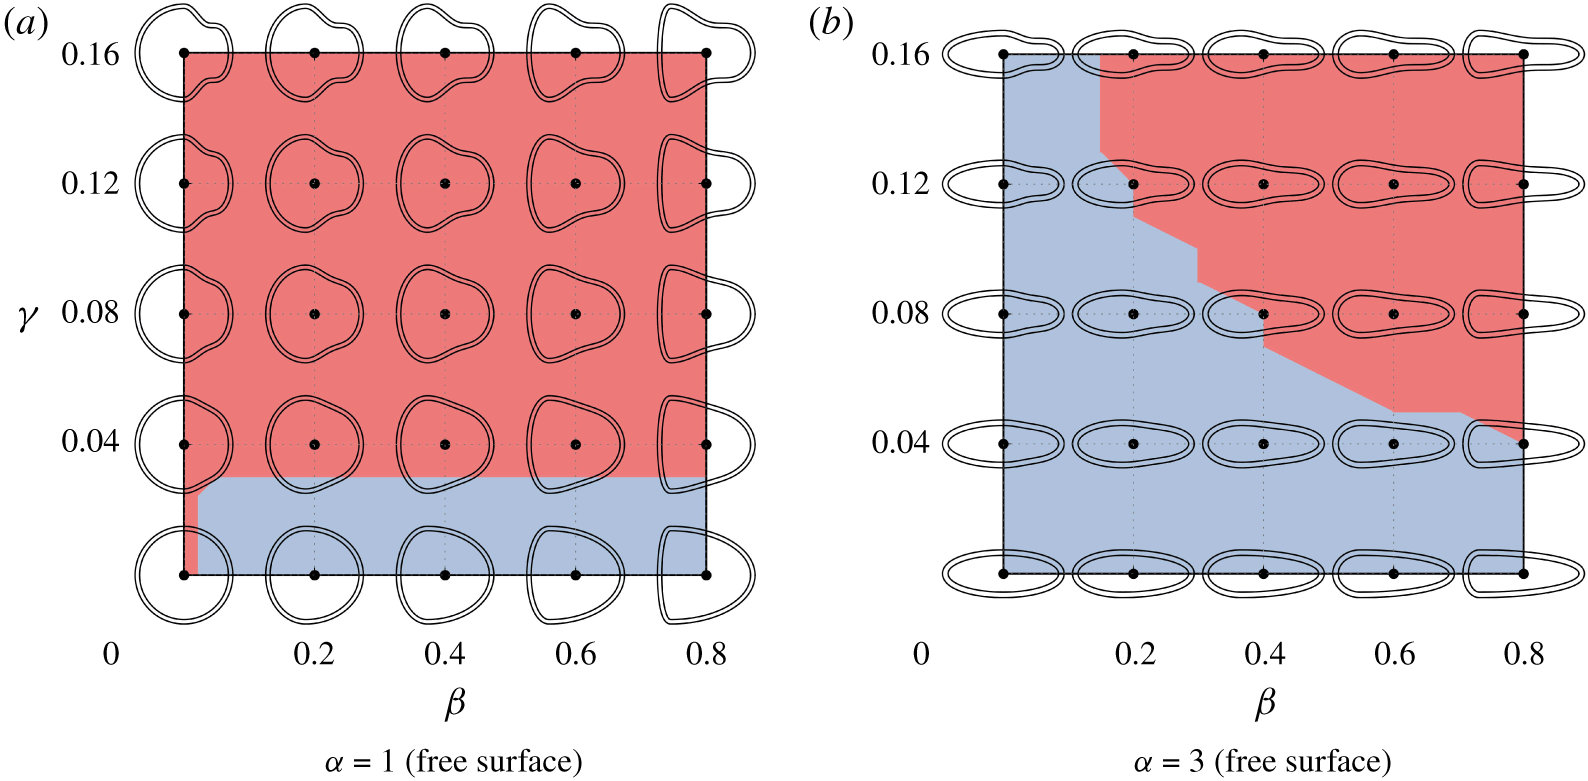
State diagram of the behaviours of cells with different aspect ratios at the free surface. The red regions indicate that cells are entrapped, while the blue regions indicate that cells escape. The diagram is plotted in  $\unicode[STIX]{x1D6FD}-\unicode[STIX]{x1D6FE}$ space, in which cell shapes are drawn for reference.

Next, we investigate the effects of aspect ratio  $\unicode[STIX]{x1D6FC}$. State diagrams with
 $\unicode[STIX]{x1D6FC}=1$ and 3 at the free surface are shown in figure 8. We can see that the area of entrapment decreases slightly with increasing
 $\unicode[STIX]{x1D6FC}$. The entrapped cells have a stable angle smaller than
 $\unicode[STIX]{x03C0}/2$, except the spherical cell with
 $\unicode[STIX]{x1D6FC}=1$,
 $\unicode[STIX]{x1D6FD}=\unicode[STIX]{x1D6FE}=0$. The spherical cell seems to be an exception; it stops at the free surface with an orientation angle of
 $\unicode[STIX]{x1D703}=\unicode[STIX]{x03C0}/2$. All other entrapped cells have a smaller angle and are able to swim horizontally during entrapment.
4 Entrapment mechanism
In this section, we discuss why the asymmetrical cell with a constriction was entrapped by the free surface. We firstly calculate the minimum curvature of the cilia surface, and examine the relationship between the minimum curvature and the behaviour of cells. The results indicate that the negative curvature is necessary for a cell to be entrapped at a free surface or solid wall (appendix B).
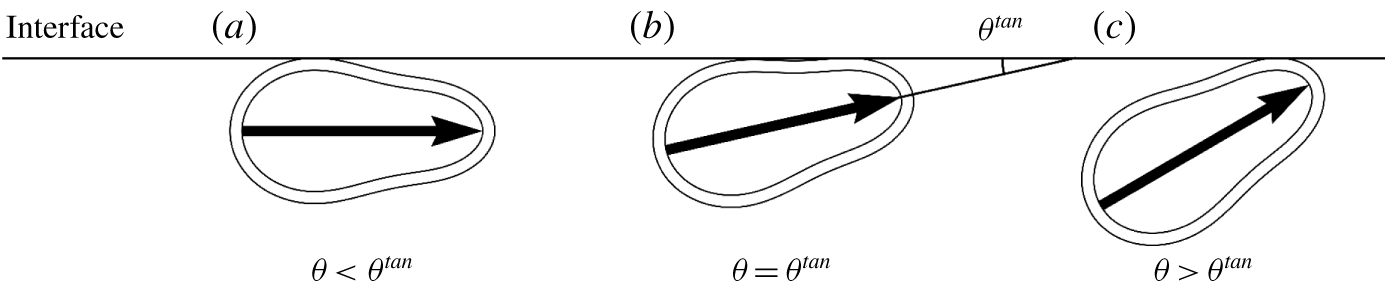
Attitudes of a cell at the interface. (a) When  $\unicode[STIX]{x1D703}<\unicode[STIX]{x1D703}^{tan}$, the posterior part of the cell collides with the interface. (b) When
 $\unicode[STIX]{x1D703}=\unicode[STIX]{x1D703}^{tan}$, the cell collides with the interface at two points. (c) When
 $\unicode[STIX]{x1D703}>\unicode[STIX]{x1D703}^{tan}$, the anterior part of the cell collides with the interface.

When the cilia surface has negative curvature, the behaviour of the entrapped cells can be divided into three types, as shown in figure 9. The cilia surface collides with the interface at two points, when the angle between the orientation vector and the interface is  $\unicode[STIX]{x1D703}=\unicode[STIX]{x1D703}^{tan}$. When
 $\unicode[STIX]{x1D703}<\unicode[STIX]{x1D703}^{tan}$, the posterior part of the cilia surface collides with the interface, whereas when
 $\unicode[STIX]{x1D703}>\unicode[STIX]{x1D703}^{tan}$, the anterior part of the cilia surface collides with the interface. To determine the stable angle of the entrapped cells, we calculate the angle difference
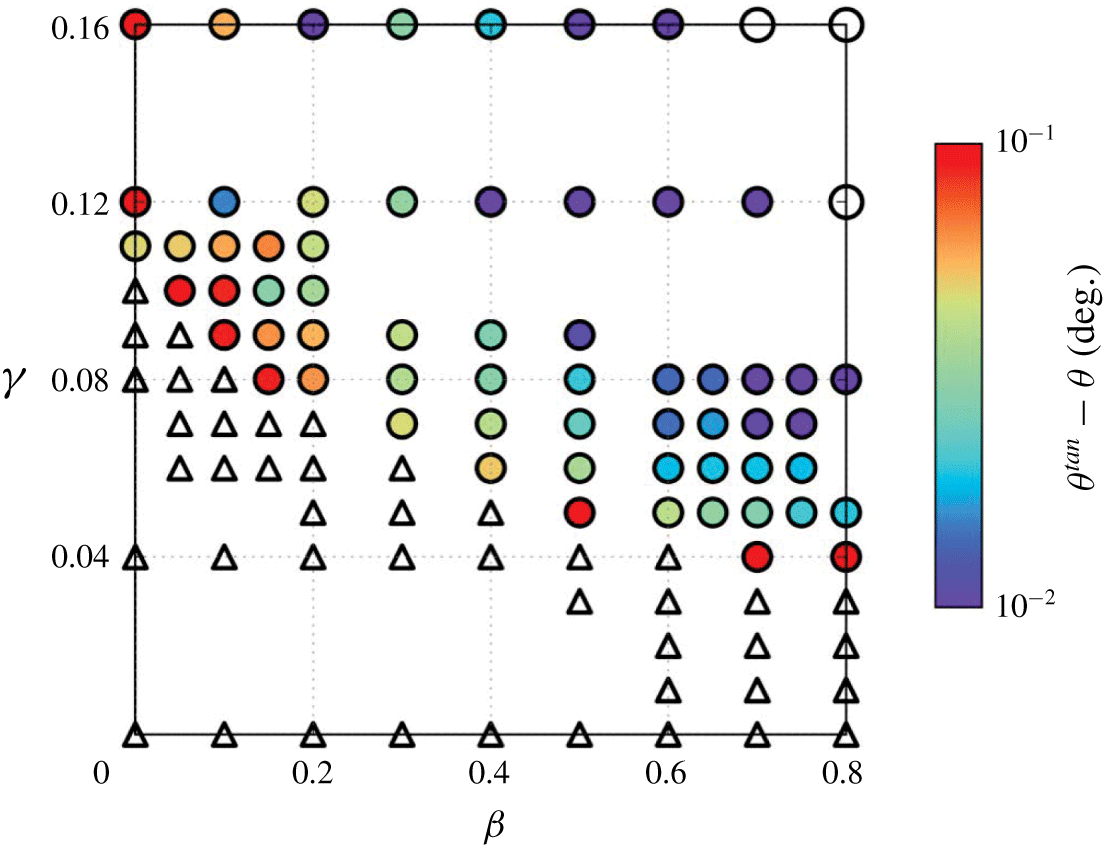
 $\unicode[STIX]{x1D703}^{tan}-\unicode[STIX]{x1D703}$. The results with
 $\unicode[STIX]{x1D6FC}=2$ are shown in figure 10. Most of the entrapped cells have
 $\unicode[STIX]{x1D703}<\unicode[STIX]{x1D703}^{tan}$, indicating that the posterior part of the cilia surface collide with the interface, as shown in figure 9(a). When both
 $\unicode[STIX]{x1D6FD}$ and
 $\unicode[STIX]{x1D6FE}$ are large, however, the cells can be trapped even with
 $\unicode[STIX]{x1D703}>\unicode[STIX]{x1D703}^{tan}$, indicating that the anterior part of the cilia surface collided with the interface.
Distribution of the angle difference  $\unicode[STIX]{x1D703}^{tan}-\unicode[STIX]{x1D703}$ of a cell with
 $\unicode[STIX]{x1D6FC}=2$ at the free surface. White triangles indicate that the cell escapes from the free surface. Coloured circles indicate that the cells reach the steady state with
 $\unicode[STIX]{x1D703}<\unicode[STIX]{x1D703}^{tan}$, indicating that the posterior part of the cilia surface collides with the interface. White circles indicate that the cells reach the steady state with
 $\unicode[STIX]{x1D703}>\unicode[STIX]{x1D703}^{tan}$, indicating that the anterior part collides with the interface.

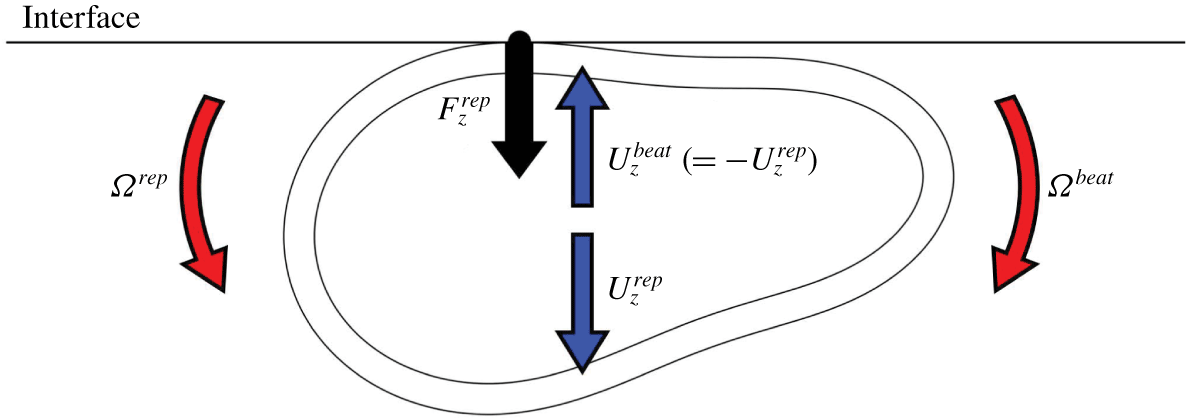
Collision at the posterior part of the cilia surface induce a repulsive force from the surface, which may direct the cell towards the interface. On the other hand, the flow field generated by the ciliary beat may direct the cell away from the interface. We assume that steady entrapment is achieved when the two effects are balanced. To validate this, we calculate the velocities shown in figure 11. Due to the linearity of Stokes flow, we can decompose the vertical velocity  $U_{z}$ into the velocity induced by the repulsive force
 $U_{z}^{rep}$ and that induced by the ciliary beat
 $U_{z}^{beat}$, i.e.
 $U_{z}=U_{z}^{rep}+U_{z}^{beat}$. In a similar manner, the rotational velocity
 $\unicode[STIX]{x1D6FA}$ can be decomposed into the velocity induced by the repulsive force
 $\unicode[STIX]{x1D6FA}^{rep}$ and that induced by the ciliary beat
 $\unicode[STIX]{x1D6FA}^{beat}$, i.e.
 $\unicode[STIX]{x1D6FA}=\unicode[STIX]{x1D6FA}^{rep}+\unicode[STIX]{x1D6FA}^{beat}$. The sign of
 $\unicode[STIX]{x1D6FA}$ is taken to be positive when
 $\unicode[STIX]{x1D703}$ increases, and negative when
 $\unicode[STIX]{x1D703}$ decreases. When the attitude of the entrapped cell reaches the steady state, we have
 $U_{z}^{rep}=-U_{z}^{beat}$ and
 $\unicode[STIX]{x1D6FA}^{rep}=-\unicode[STIX]{x1D6FA}^{beat}$.
Schematic showing the decomposed velocities:  $U_{z}^{rep}$ is the vertical velocity induced by the repulsive force and
 $U_{z}^{beat}$ is that induced by the ciliary beat, i.e.
 $U_{z}=U_{z}^{rep}+U_{z}^{beat}$. Here,
 $\unicode[STIX]{x1D6FA}^{rep}$ is the rotational velocity induced by the repulsive force and
 $\unicode[STIX]{x1D6FA}^{beat}$ is that induced by the ciliary beat, i.e.
 $\unicode[STIX]{x1D6FA}=\unicode[STIX]{x1D6FA}^{rep}+\unicode[STIX]{x1D6FA}^{beat}$. The sign of
 $\unicode[STIX]{x1D6FA}$ is taken to be positive when
 $\unicode[STIX]{x1D703}$ increases.

We use the following procedures to calculate the decomposed velocities. Firstly, we place the cilia surface with a given orientation angle  $\unicode[STIX]{x1D703}$ such that it just touches the interface, i.e.
 $h=0$ in (3.1). Then, we calculate
 $U_{z}^{beat}$ and
 $\unicode[STIX]{x1D6FA}^{beat}$ by applying the thrust vector
 $\boldsymbol{f}$ in (2.4), but excluding the repulsive force density
 $\boldsymbol{p}^{rep}$ from (2.11) and (2.12). Without the repulsive force, the cell body may penetrate the interface. Thus, the vertical velocity induced by the repulsive force
 $U_{z}^{rep}$ has to be introduced. We obtain the vertical repulsive force
 $F_{z}^{rep}$, which acts at the contact point and satisfies
 $U_{z}^{rep}=-U_{z}^{beat}$ at the contact point, by solving the governing equations without the thrust vector
 $\boldsymbol{f}$. Finally, we calculate
 $\unicode[STIX]{x1D6FA}^{rep}$ generated by
 $F_{z}^{rep}$, by excluding the thrust vector
 $\boldsymbol{f}$. If
 $\unicode[STIX]{x1D6FA}^{rep}\neq -\unicode[STIX]{x1D6FA}^{beat}$, i.e.
 $\unicode[STIX]{x1D6FA}\neq 0$, the cell changes the orientation. These procedures enable us to evaluate the orientation change of a cell entrapped at the interface in the limit of infinitely small deformation of the cilia surface.
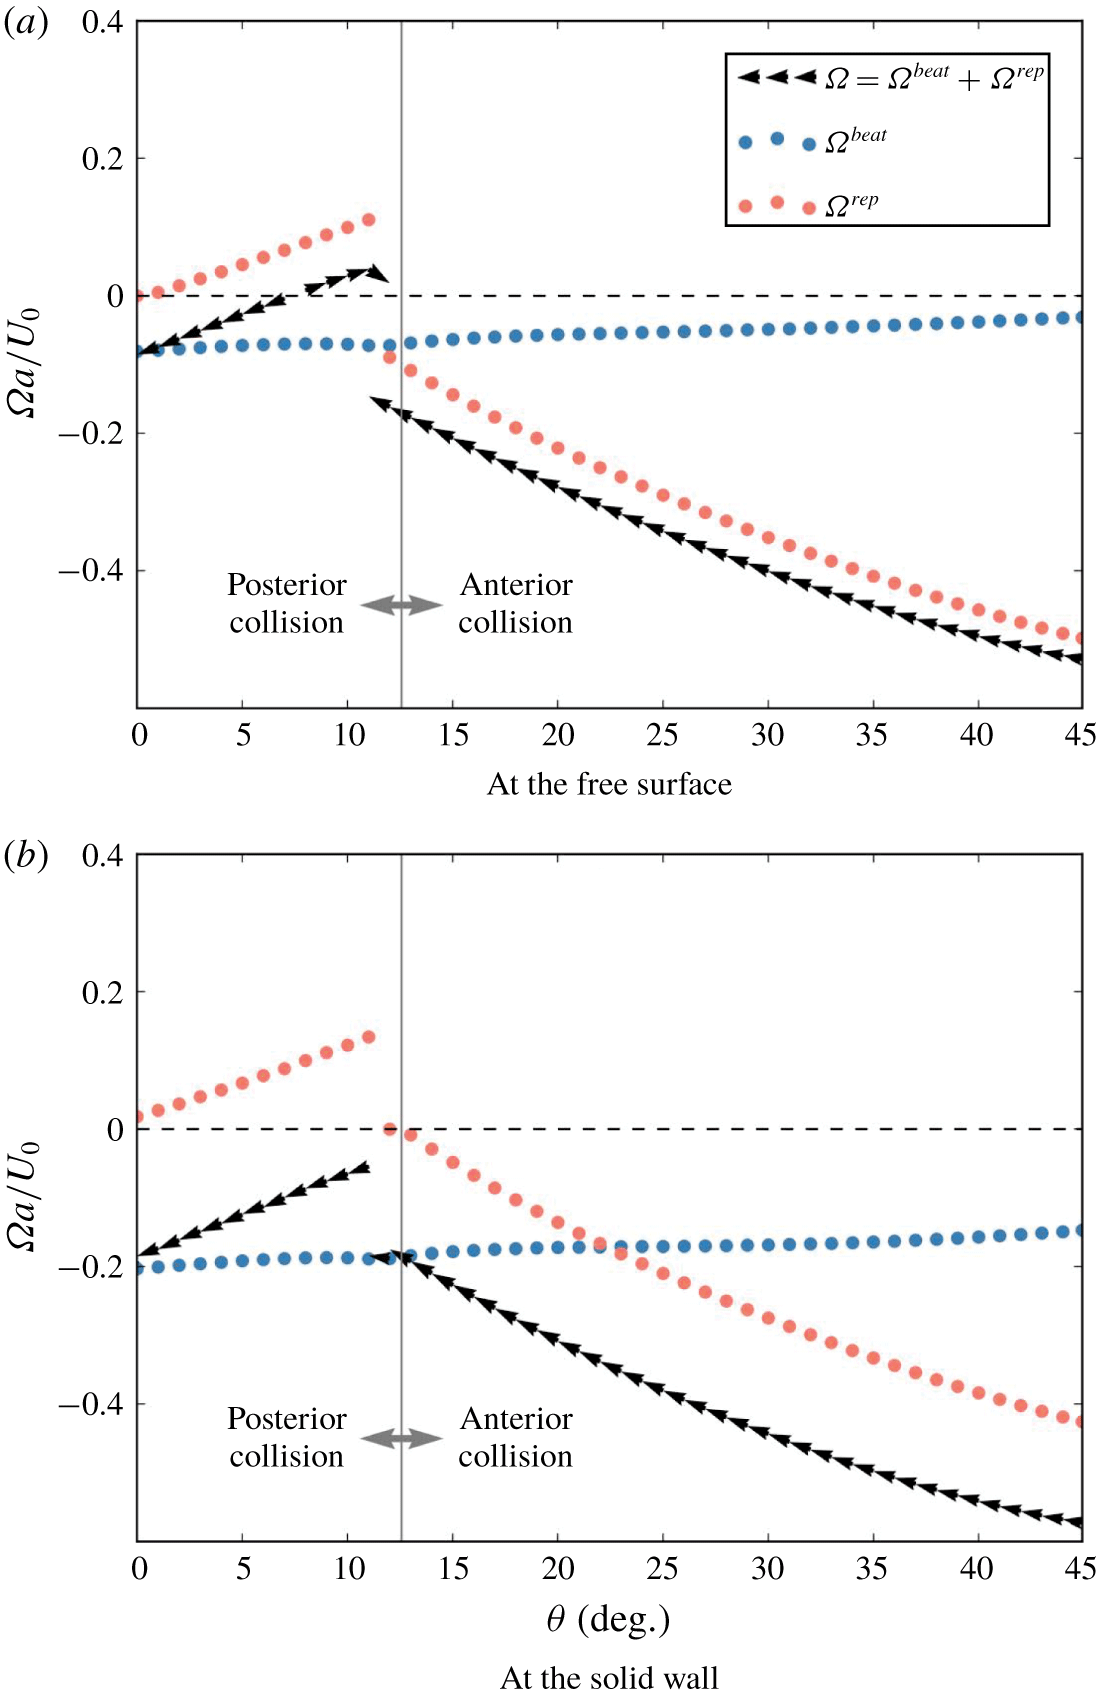
Changes in decomposed rotational velocities  $\unicode[STIX]{x1D6FA}^{beat}$ and
 $\unicode[STIX]{x1D6FA}^{rep}$ as a function of the orientation angle
 $\unicode[STIX]{x1D703}$. The cell shape is asymmetrical and has a constriction (
 $\unicode[STIX]{x1D6FC}=2$,
 $\unicode[STIX]{x1D6FD}=0.4$ and
 $\unicode[STIX]{x1D6FE}=0.08$). The cilia surface with a given orientation angle
 $\unicode[STIX]{x1D703}$ is placed so as to just touch the interface, i.e.
 $h=0$. Small black arrows indicate the change in orientation of the cell.

Figure 12 shows the results of decomposed  $\unicode[STIX]{x1D6FA}$ of the asymmetrical cell, illustrated in figure 4 (
 $\unicode[STIX]{x1D6FC}=2$,
 $\unicode[STIX]{x1D6FD}=0.4$ and
 $\unicode[STIX]{x1D6FE}=0.08$), as a function of orientation angle
 $\unicode[STIX]{x1D703}$. The black arrows in the figure indicate
 $\unicode[STIX]{x1D6FA}$ and how the orientation changes during the entrapment. In the case of the free surface (cf. figure 12a),
 $\unicode[STIX]{x1D6FA}^{beat}$ has small negative values in the range
 $0^{\circ }\leqslant \unicode[STIX]{x1D703}\leqslant 45^{\circ }$. The results indicate that the ciliary beat directs the cell away from the free surface in the whole range of
 $\unicode[STIX]{x1D703}$ shown in the figure. On the other hand,
 $\unicode[STIX]{x1D6FA}^{rep}$ has a steep change at around
 $\unicode[STIX]{x1D703}=12^{\circ }$, where we observe transition of the collision point from the posterior to the anterior side. The summed velocity
 $\unicode[STIX]{x1D6FA}$ also shows a steep change at around
 $\unicode[STIX]{x1D703}=12^{\circ }$. The sign of
 $\unicode[STIX]{x1D6FA}$ is positive in the range
 $8^{\circ }<\unicode[STIX]{x1D703}<12^{\circ }$, so
 $\unicode[STIX]{x1D703}$ increases in this range as indicated by the arrows. Thus, a cell with
 $8^{\circ }<\unicode[STIX]{x1D703}<12^{\circ }$ tends to be directed towards the free surface. The sign of
 $\unicode[STIX]{x1D6FA}$ is negative in the range
 $\unicode[STIX]{x1D703}>12^{\circ }$, so
 $\unicode[STIX]{x1D703}$ decreases in this range as indicated by the arrows. Thus, a cell with
 $12^{\circ }<\unicode[STIX]{x1D703}$ tends to direct away from the free surface. We have a stable point at around
 $\unicode[STIX]{x1D703}=12^{\circ }$, as observed in figure 6(a).
In the case of the solid wall (cf. figure 12b), we again see that the ciliary beat generates the rotational velocity away from the wall. The magnitude of the rotational velocity is much larger than in the case of a free surface. At around  $\unicode[STIX]{x1D703}=12^{\circ }$,
 $\unicode[STIX]{x1D6FA}^{rep}$ has a steep change, where transition of the collision point is observed. The summed velocity
 $\unicode[STIX]{x1D6FA}$ in this case is negative in the whole
 $\unicode[STIX]{x1D703}$ range. Thus,
 $\unicode[STIX]{x1D703}$ decreases monotonically and the cell eventually escapes from the solid wall. As the magnitude of
 $\unicode[STIX]{x1D6FA}^{rep}$ at around
 $\unicode[STIX]{x1D703}=12^{\circ }$ is not markedly different between the two interfaces, the difference in cell behaviours may be mainly due to
 $\unicode[STIX]{x1D6FA}^{beat}$, i.e. differences in the flow fields bounded by the free surface and the solid wall.
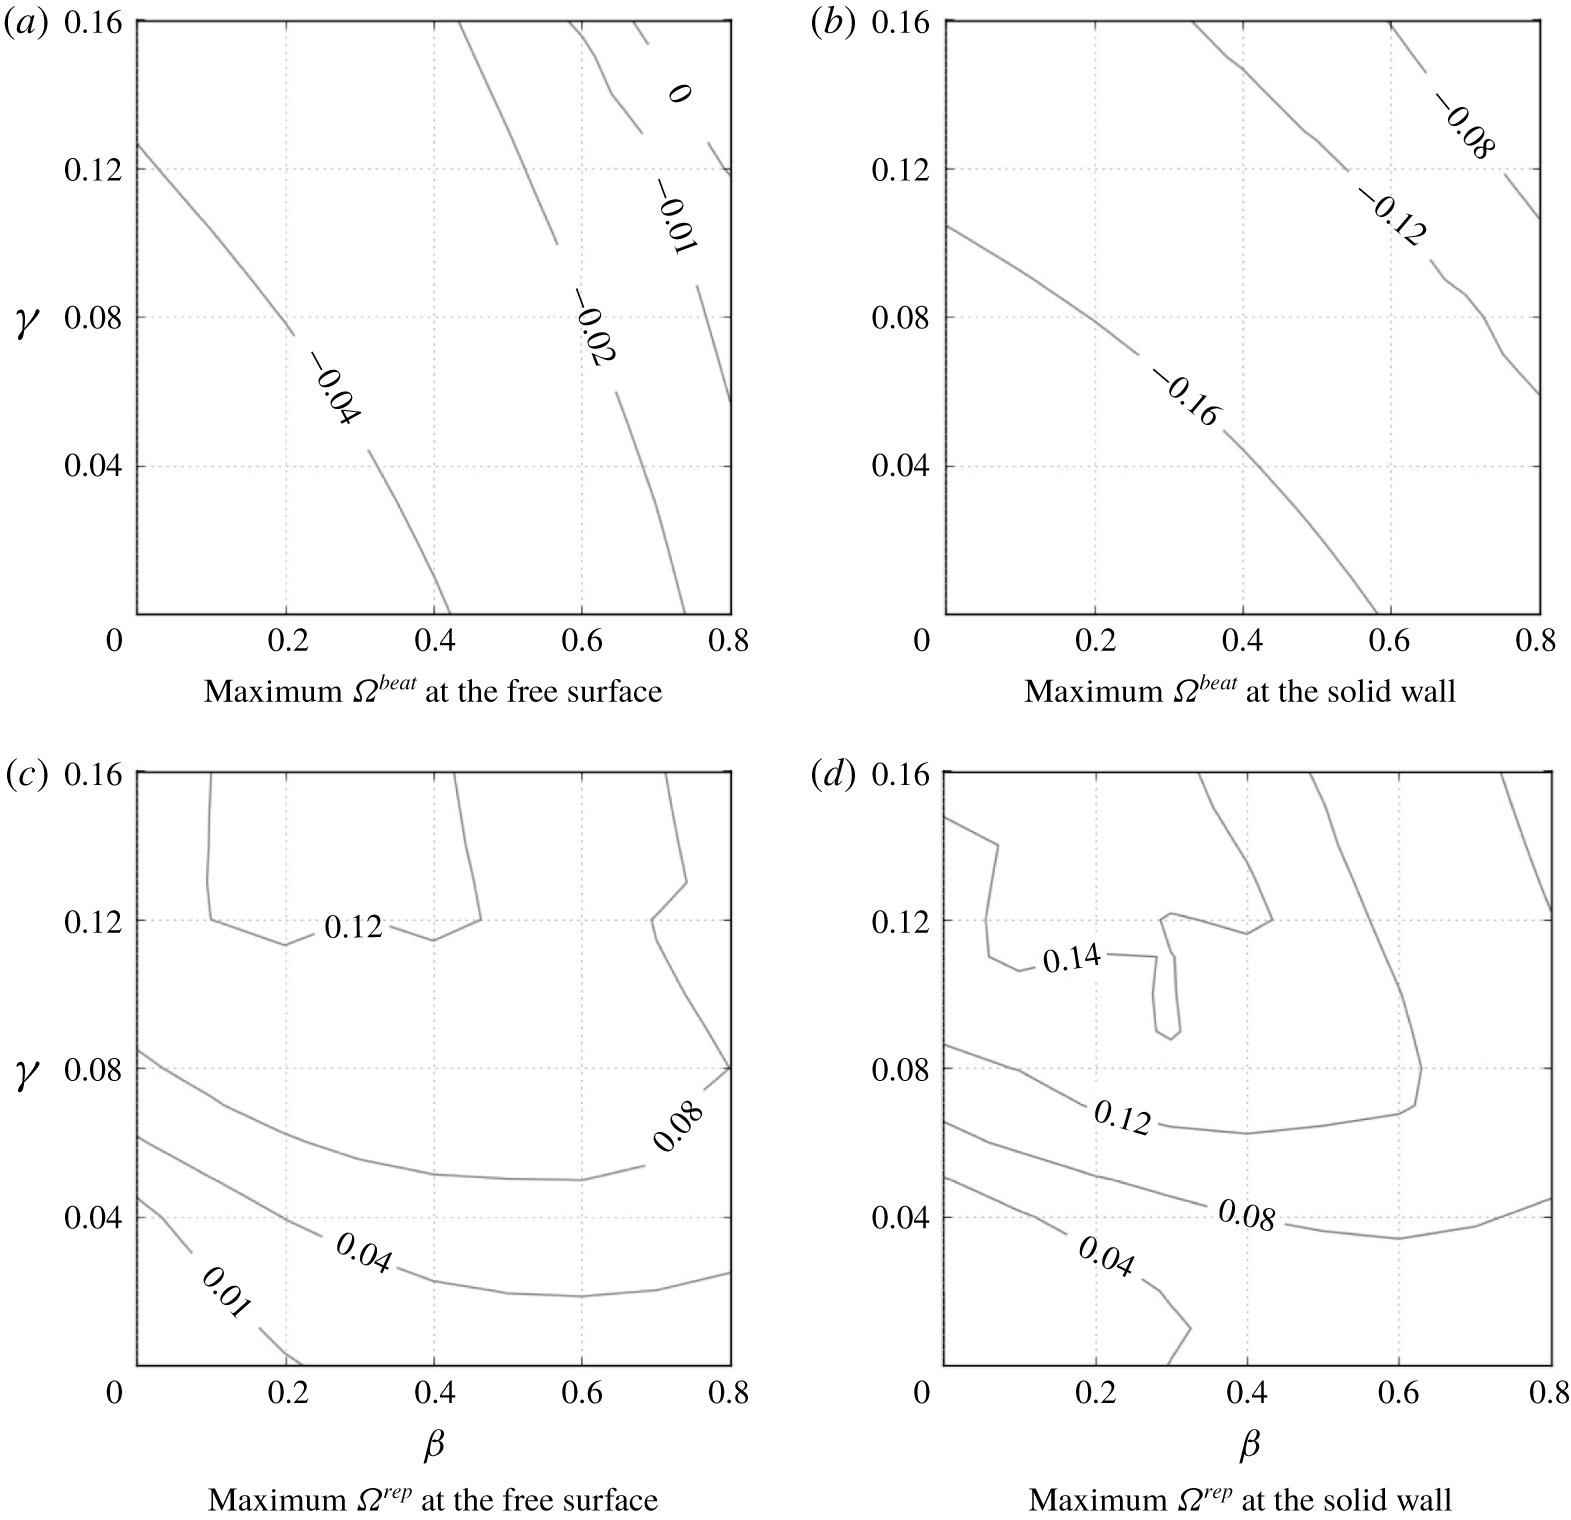
Maximum value of  $\unicode[STIX]{x1D6FA}^{beat}$ and
 $\unicode[STIX]{x1D6FA}^{rep}$ in the angle range
 $0\leqslant \unicode[STIX]{x1D703}\leqslant 45^{\circ }$, plotted in the
 $\unicode[STIX]{x1D6FD}-\unicode[STIX]{x1D6FE}$ space. The cell has the aspect ratio of
 $\unicode[STIX]{x1D6FC}=2$ and is placed at the free surface or the solid wall.

To determine the effects of interface boundary conditions on  $\unicode[STIX]{x1D6FA}^{beat}$ and
 $\unicode[STIX]{x1D6FA}^{rep}$, we plot contour lines of maximum
 $\unicode[STIX]{x1D6FA}^{beat}$ and
 $\unicode[STIX]{x1D6FA}^{rep}$ in the range
 $0^{\circ }\leqslant \unicode[STIX]{x1D703}\leqslant 45^{\circ }$ in the
 $\unicode[STIX]{x1D6FD}-\unicode[STIX]{x1D6FE}$ space, as shown in figure 13. The value of
 $\unicode[STIX]{x1D6FA}^{beat}$ is affected more by the boundary conditions than
 $\unicode[STIX]{x1D6FA}^{rep}$. Therefore, we conclude that the difference in behaviour of cells at two types of interface is induced by the difference in rotational velocity generated by the ciliary beat between the free surface and the solid wall. When both
 $\unicode[STIX]{x1D6FD}$ and
 $\unicode[STIX]{x1D6FE}$ are large, we see positive
 $\unicode[STIX]{x1D6FA}^{beat}$ at the free surface, which is why we observed entrapment of the cell even with
 $\unicode[STIX]{x1D703}>\unicode[STIX]{x1D703}^{tan}$, as shown in figure 10. We briefly discuss entrapment mechanism of such cells in appendix C.
5 Discussions
Here, we present experimental observations using T. thermophila, and qualitatively compare the experimental observations to the results obtained in the present study. T. thermophila is a unicellular freshwater ciliate approximately  $65~\unicode[STIX]{x03BC}\text{m}$ in body length. It shows a swimming velocity of approximately
 $400~\unicode[STIX]{x03BC}\text{m}~\text{s}^{-1}$, i.e. approximately six body lengths per second. The aspect ratio is approximately 2.1–2.5 (Ishikawa & Kikuchi Reference Ishikawa and Kikuchi2018). Instead of observing entrapped cells from the top of the chamber as in our previous study (Ferracci et al. Reference Ferracci, Ueno, Numayama-Tsuruta, Imai, Yamaguchi and Ishikawa2013), we observe cells entrapped in an air bubble, which allowed us to observe entrapped cells from the side of the interface and discuss the shape of cells facing the interface.
The materials and methods used in the present experiment are similar to those in our previous study (Ferracci et al. Reference Ferracci, Ueno, Numayama-Tsuruta, Imai, Yamaguchi and Ishikawa2013), so will be explained only briefly here. The cells used in the experiment are T. thermophila (wild-type: CH1). They are cultivated in peptone yeast dextrose (PYD) medium at  $27\,^{\circ }\text{C}$, composed of 1 % protease peptone, 0.5 % yeast extract and 0.87 % glucose in pure water. A drop of the cell suspension is placed on a glass plate, and air bubbles are generated by blowing air using a needle connected to a syringe pump. Cells are observed in PYD at room temperature. The observations are made using an upright fluorescent microscope (DM4000 B; Leica, Wetzlar, Germany) with a
 $20\times$ objective lens and a charge-coupled device (known as CCD) camera (DFC 340 FX; Leica). Images are taken at a rate of 22 frames per second.
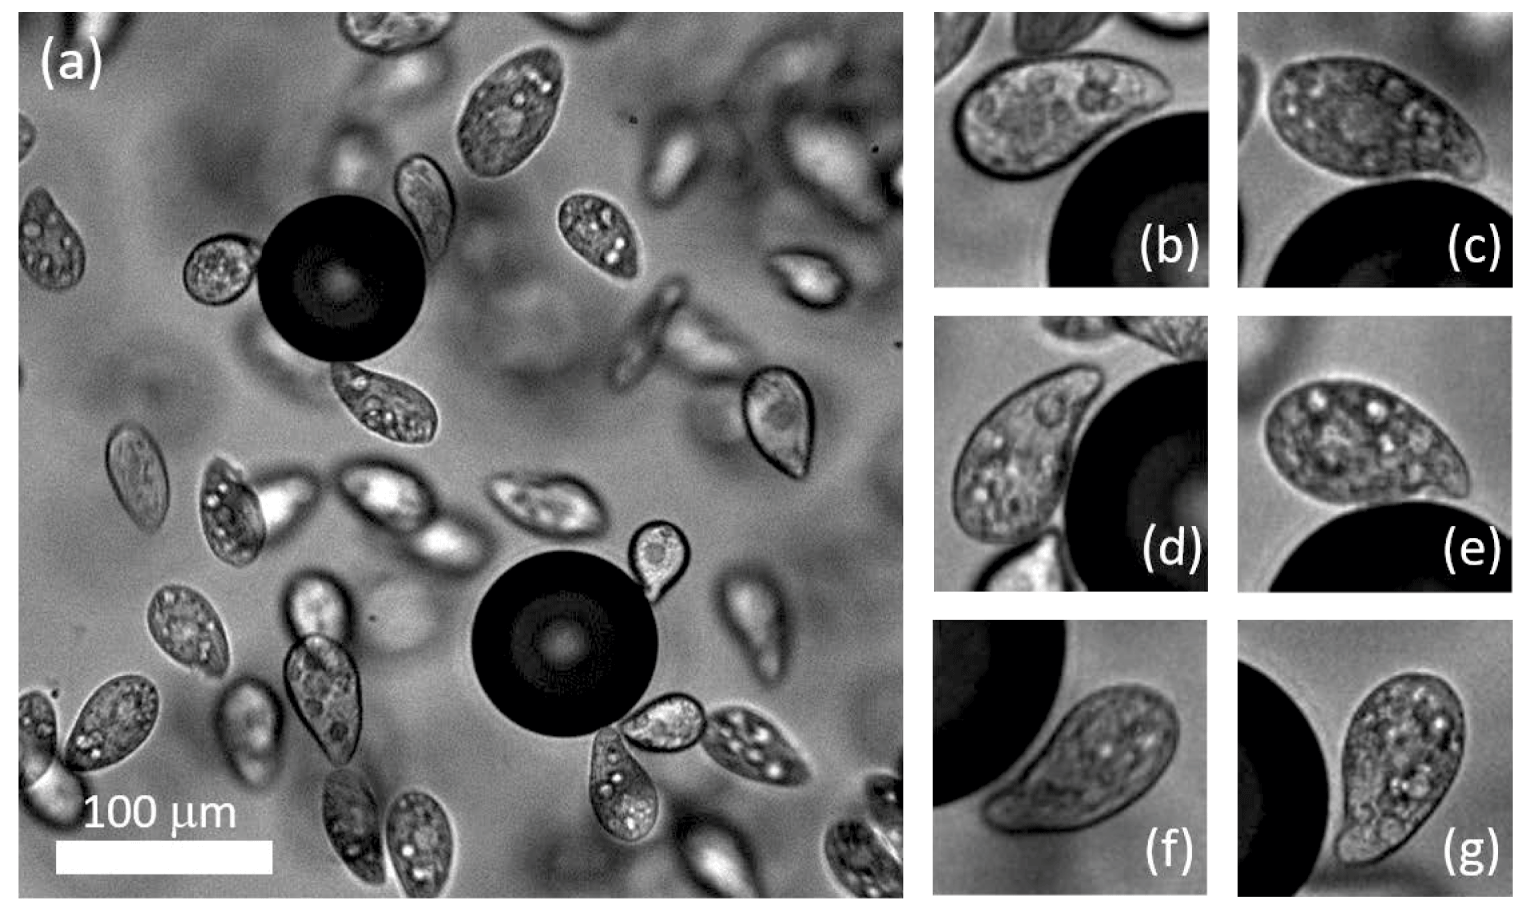
Entrapment of T. thermophila on air bubbles in PYD medium (see also supplementary movie 1). (a) Sample image of cells and two air bubbles. The scale bar indicates  $100~\unicode[STIX]{x03BC}\text{m}$. (b–g) Sample magnified images of entrapped cells at the air–water interface.

Sample images of entrapped cells at the water–air interface are shown in figure 14. As shown in movie 1 (supplementary material available at https://doi.org/10.1017/jfm.2020.160), some cells are trapped on the bubble surface for a few seconds. Thus, the entrapment phenomenon also appears for the water–air interface with large curvature, although the surface was flat in our previous study (Ferracci et al. Reference Ferracci, Ueno, Numayama-Tsuruta, Imai, Yamaguchi and Ishikawa2013). The magnified images in figure 14 show that the entrapped cells have an asymmetrical cell body with a constriction. Negative curvature of the constriction is noted around the oral apparatus of T. thermophila. As T. thermophila has an oral apparatus on part of the lateral side, the cell shape is not axisymmetrical, which is different from the analytical model used in this study. In figure 14 and supplementary movie 1, we find that the cells are entrapped, with their constrictions facing the interface. We rarely observe entrapped cells with positive curvature surfaces facing the interface. These observations illustrate that the negative curvature of cell shape is necessary for entrapment, consistent with the present study.
Looking at the cell shape along the oral apparatus of T. thermophila, the shape parameters may be estimated in the range; aspect ratio  $\unicode[STIX]{x1D6FC}=2.1{-}2.5$ and fore-and-aft asymmetry
 $\unicode[STIX]{x1D6FD}=0.2{-}0.3$. The amplitude of the constriction
 $\unicode[STIX]{x1D6FE}$ is difficult to estimate, because the cell shape is not axisymmetrical. Focusing on the depth of the constriction, the
 $\unicode[STIX]{x1D6FE}$ value can be roughly estimated in the range
 $\unicode[STIX]{x1D6FE}=0.08{-}0.12$. In figure 7, cells with these parameter values are shown entrapped by the free surface, but they escaped from the solid wall. These results are consistent with the experimental observations, in which T. thermophila were entrapped at the water–air interface but escaped from the water–solid interface (Ferracci et al. Reference Ferracci, Ueno, Numayama-Tsuruta, Imai, Yamaguchi and Ishikawa2013).
In modelling T. thermophila, we neglected the details of the oral apparatus. As the direction and amplitude of ciliary beat around the oral apparatus are different from the other parts, such details may become important in quantitative comparisons. In addition, Ohmura et al. (Reference Ohmura, Nishigami, Taniguchi, Nonaka, Manabe, Ishikawa and Ichikawa2018) reported that ciliary beat can be stopped at the solid wall by using Tetrahymena pyriformis. In the case of T. thermophila, Ishikawa & Kikuchi (Reference Ishikawa and Kikuchi2018) reported that the frequency of the ciliary beat of a cell sandwiched between two glass plates decreased to approximately one third but did not stop. Although we observed no apparent changes in the ciliary beat at the water–air interface, the beat frequency may be decreased. The decrease in ciliary beat frequency reduces the thrust force in the near-contact region, which in turn decreases  $\unicode[STIX]{x1D6FA}^{beat}$ and eventually enhances entrapment. This effect is not discussed here, although it can be easily included by modifying the stress distribution in the model.
In the present study, we showed that a cell can be entrapped at an interface via hydrodynamic and steric effects, provided that the cell shape and interface properties are appropriate. These findings are important for understanding the behaviours of cells at various interfaces.
6 Conclusions
To improve our understanding of the entrapment phenomenon, we numerically investigated the behaviour of a ciliate at interfaces from a hydrodynamic viewpoint, focusing on cell shape. The model cell was assumed to propel itself by generating homogeneous tangential stress above the cell body. The results showed that two major shape parameters, i.e. the fore-and-aft asymmetry and the constriction, dominate the entrapment phenomenon. The mechanism can be explained by the balance of two opposite rotational velocities: repelling velocity due to the ciliary beat and attracting velocity due to collision with the interface. In other words, the mechanism can be understood by the hydrodynamic and steric effects.
The main differences between the present study and former studies are the stress boundary condition and the cell shape. Prescribing stresses instead of velocities is more realistic, especially when the cell come close to the interfaces, because it permits no slip on the cell surface. Since the boundary condition is different between the present study and former studies, the entrapment mechanism may not be identical between them. Moreover, former studies reporting entrapment phenomena introduced large 2nd or 3rd mode surface squirming velocity, in which the 1st mode squirming velocity dominates the swimming speed whereas the 2nd and 3rd modes dominate mixing of surrounding fluids. A cell with large 2nd or 3rd mode squirming velocity generates strongly disturbed velocities around the cell while swimming, which can make the cell become entrapped at an interface. The mechanism of entrapment induced by the large 2nd or 3rd mode squirming velocity is, however, different from that found in the present study. In the experiment, we did not observe such large 2nd or 3rd mode squirming velocity for Tetrahymena. We thus think that our entrapment mechanism is novel in the field of squirmers and ciliates.
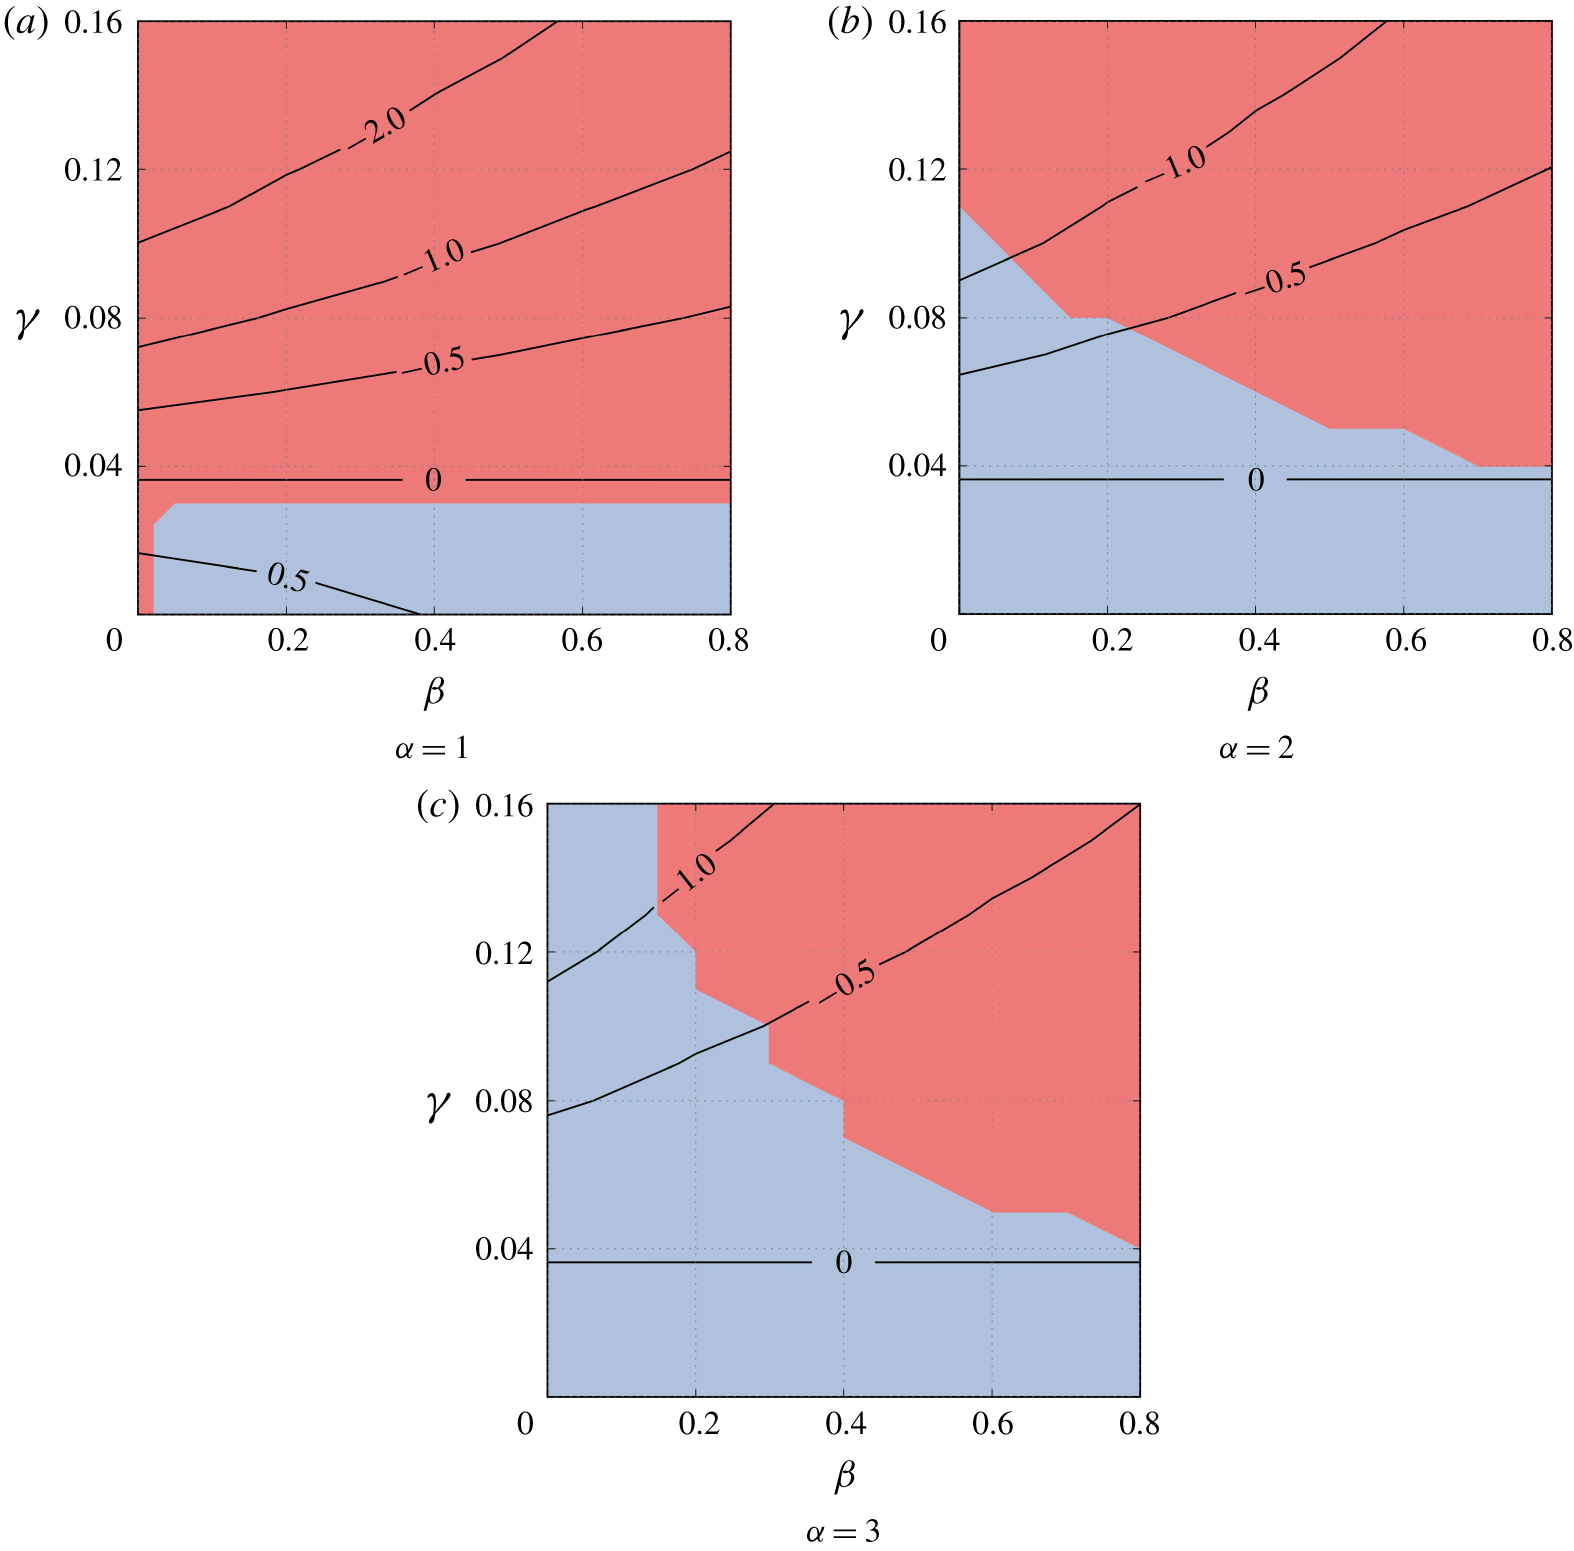
Contour lines of the minimum curvature of the cilia surface with different aspect ratios. A state diagram of the cell’s behaviour at the free surface is also provided for comparison. The red regions indicate that cells are entrapped, while the blue regions indicate that cells escape.

In all of former studies, the cell body was assumed as spherical or spheroidal. When a spheroidal cell is directed toward an interface, the repulsive force between the spheroidal cell body and the interface is generated on its anterior side. Hence, the repulsive force generates a torque that directs the cell away from the interface. This torque is in the opposite direction from that induced in the present study, which indicates that former studies assuming spheroidal cell body may not be able to reproduce the entrapment mechanism found in this study. In the case of a spherical cell body, there is no steric effect. Because the body centre exists along the line of the repulsive force, and no torque is generated. So the spherical cell again may not be able to reproduce the entrapment mechanism found in this study.
Cells tended to be entrapped more by the water–air interface than by the solid wall, which agreed with our previous experimental observations (Ferracci et al. Reference Ferracci, Ueno, Numayama-Tsuruta, Imai, Yamaguchi and Ishikawa2013). Differences in the behaviour of the cells at the two types of interface is induced by the difference in rotational velocity generated by the ciliary beat at the free surface versus the solid wall.
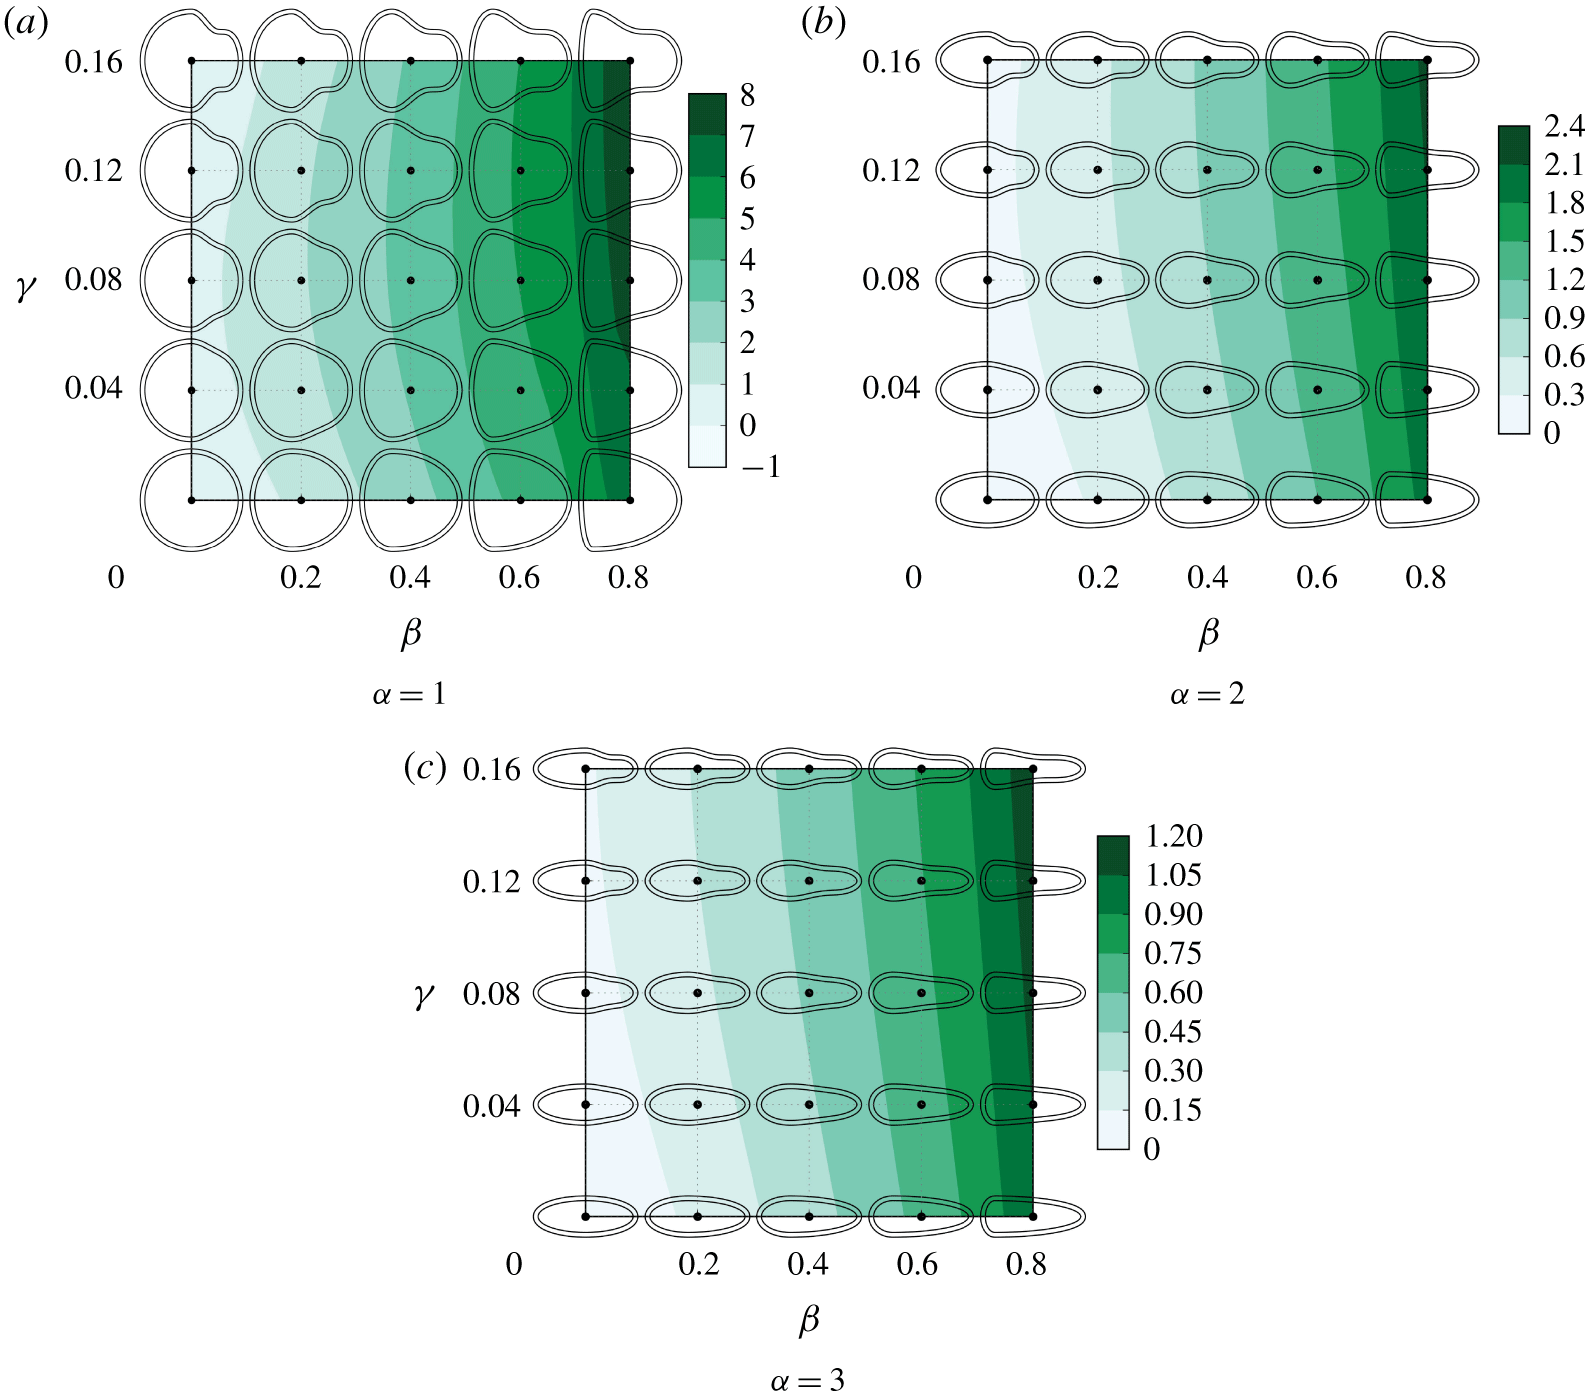
The effect of the cell shapes on the stresslet component  $S_{ee}$, where
 $e$ is the cell’s orientation. Positive
 $S_{ee}$ indicates that the cell is a puller. The
 $S_{ee}$ of a spherical velocity squirmer is
 $4\unicode[STIX]{x03C0}$, when the ratio of the second to first mode squirming is 1, i.e.
 $B_{2}/B_{1}=1$.

Distribution of traction force vectors on the cell body surface ( $\unicode[STIX]{x1D6FC}=2$,
 $\unicode[STIX]{x1D6FD}=0.8$,
 $\unicode[STIX]{x1D6FE}=0.16$). The cell shape has large
 $\unicode[STIX]{x1D6FD}$ and
 $\unicode[STIX]{x1D6FE}$, and generates positive
 $\unicode[STIX]{x1D6FA}^{beat}$ at the free surface. The red ring highlights traction forces contributing to the positive
 $\unicode[STIX]{x1D6FA}^{beat}$.

Finally, we would like to note that, in our experiments, we observed that T. thermophila remained entrapped on the surface of an air bubble for the range of parameters predicted by the numerics. In Ferracci et al. (Reference Ferracci, Ueno, Numayama-Tsuruta, Imai, Yamaguchi and Ishikawa2013), the time duration for a cell to stay at the free surface was not measured because cells stayed for tens of seconds or minutes, and most of them swam away from the microscopic view window without escaping. However, some of the entrapped cells could escape the interface when they experienced collision from other cells in the suspension, thus pointing to the relevance of steric interactions on the stability of entrapment. Nevertheless, this aspect was neglected from the present study. Another important characteristic of Tetrahymena is that the cell can swim backwards by changing the ciliary beat direction. We sometimes observed backward swimming of entrapped Tetrahymena, and such a cell sometimes escaped from the free surface. In other words, cells can actively escape from the free surface, if they want. Since most of Tetrahymena stayed at the free surface for a long time, cells may prefer to stay at the interface for some biological reasons, such as feeding, oxygen uptake, mating and so on. The knowledge obtained herein provides a basis for understanding the behaviours of swimming micro-organisms at various interfaces, in both nature and industrial applications.
Acknowledgement
This research was supported by the Japan Society for the Promotion of Science Grant-in-Aid for Scientific Research (JSPS KAKENHI grant number 17H00853).
Declaration of interests
The authors report no conflict of interest.
Supplementary movie
Supplementary movie is available at https://doi.org/10.1017/jfm.2020.160.
Appendix A. Pusher/puller characteristics of the cells
A cell can be characterized as a pusher, a puller or a neutral swimmer depending on the force dipole. The force dipole, i.e. the stresslet, of the cell can be calculated by (Batchelor Reference Batchelor1970)
 $$\begin{eqnarray}\unicode[STIX]{x1D64E}=\int \left[{\textstyle \frac{1}{2}}(\boldsymbol{q}\boldsymbol{x}+\boldsymbol{x}\boldsymbol{q})-{\textstyle \frac{1}{3}}(\boldsymbol{x}\boldsymbol{\cdot }\boldsymbol{q})\unicode[STIX]{x1D644}\right]\text{d}A_{body}-\int \left[{\textstyle \frac{1}{2}}(\,\boldsymbol{f}\boldsymbol{x}+\boldsymbol{x}\boldsymbol{f})-{\textstyle \frac{1}{3}}(\boldsymbol{x}\boldsymbol{\cdot }\boldsymbol{f})\unicode[STIX]{x1D644}\right]\text{d}A_{str},\end{eqnarray}$$
where  $\unicode[STIX]{x1D644}$ is the unit tensor. The stresslet component
 $S_{ee}$ determines the pusher/puller characteristics, where
 $e$ is the cell’s orientation.
The results of  $S_{ee}$ with
 $\unicode[STIX]{x1D6FC}=1$, 2 and 3 are shown in figure 16. When the cell body is spherical or spheroidal,
 $S_{ee}=0$ and the cell is a neutral swimmer. When the cell has fore-and-aft asymmetry, on the other hand,
 $S_{ee}$ is positive and the cell is a puller. In the case of a spherical velocity squirmer,
 $S_{ee}$ becomes
 $S_{ee}=4\unicode[STIX]{x03C0}\unicode[STIX]{x1D707}a^{2}UB_{2}/B_{1}$ (Ishikawa et al. Reference Ishikawa, Simmonds and Pedley2006), where
 $\unicode[STIX]{x1D707}$ is the viscosity,
 $a$ is the radius,
 $U$ is the swimming velocity,
 $B_{1}$ is the first-mode squirming velocity, and
 $B_{2}$ is the second-mode squirming velocity. The maximum
 $S_{ee}$ with
 $\unicode[STIX]{x1D6FC}=2$ is approximately 2.4, which corresponds to
 $B_{2}/B_{1}=0.19$. This value is not large, so our cells are neutral or weak pullers.
Appendix B. Minimum curvature of the cell shape
In this appendix, we present the relationship between the behaviours of cells at the free surface and the minimum curvature of the cilia surface. In figure 15, the contour lines of the minimum curvature of the cilia surface are plotted according to different aspect ratios. Entrapped cells have negative curvature of the cilia surface, except for the spherical cells ( $\unicode[STIX]{x1D6FC}=1$,
 $\unicode[STIX]{x1D6FD}=\unicode[STIX]{x1D6FE}=0$). These results indicate that the negative curvature is necessary for a cell to be entrapped at the free surface. We note that the regions where cells escaped from a solid wall are smaller than the regions in a free surface, so the negative curvature is also necessary for a cell to be entrapped at the solid wall.
Appendix C. Entrapment mechanism with  $\unicode[STIX]{x1D703}>\unicode[STIX]{x1D703}^{tan}$

Figure 17 shows the traction force vectors on the cell body surface with  $\unicode[STIX]{x1D6FC}=2$,
 $\unicode[STIX]{x1D6FD}=0.8$ and
 $\unicode[STIX]{x1D6FE}=0.16$. This cell has large
 $\unicode[STIX]{x1D6FD}$ and
 $\unicode[STIX]{x1D6FE}$, and generates positive
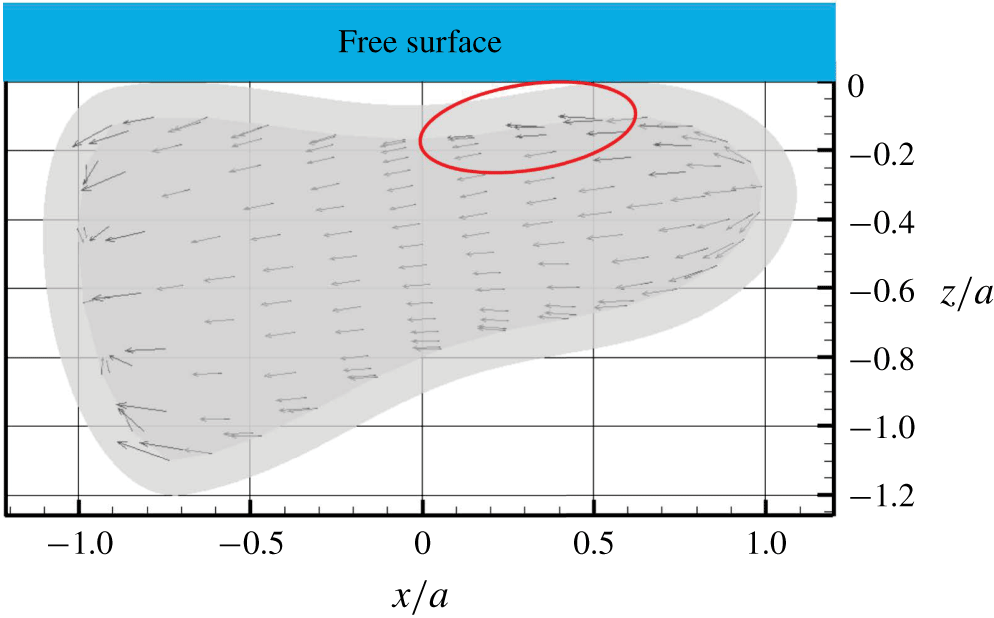
 $\unicode[STIX]{x1D6FA}^{beat}$ at the free surface. The positive
 $\unicode[STIX]{x1D6FA}^{beat}$ can be generated by the traction forces highlighted by the red ring in the figure. Because the traction forces are asymmetric between the sides in contact with the interface and the one in bulk fluid especially in this region. The asymmetric traction forces are generated by the lubrication flow between the cell body and the free surface.