Implications
Transportation of fattening pigs is a stressful procedure often resulting in significant losses for the slaughter plant. Therefore, the conditions under which pigs are transported require particular attention if we are to secure a minimum risk to their welfare. Improving our knowledge of the behavioural and physiological consequences of loading densities during transport may contribute to the delivery of healthy fattening pigs at the slaughter plant which will benefit both animal welfare and economics.
Introduction
Well-being of animals during transport is influenced by a range of factors including climate, aspects associated with the driver and the vehicle (e.g. transport duration, vibration, acceleration, driving skills, noise and space) and animal-related factors (e.g. mixing, hunger, thirst and fatigue). European legislation aims to improve the conditions of animals during transport. Animals should have sufficient space to stand and lay down freely in a natural position within their thermal comfort zone, without risk of injury or suffering (EU, 2005). An animals’ response to transport conditions is both physiological and behavioural. Although pigs are highly sensitive to travelling conditions, they are capable of adapting to new situations (Becerill-Herrera et al., Reference Becerill-Herrera, Alonso-Spilbury, Trujillo Ortega, Ramírez-Necoechea, Guerrero-Legarreta, Roldan-Santiago, Pérez-Sato, Soní-Guillermo and Mota-Rojas2010). Increased cortisol levels coinciding with reductions in ascorbic acid may indicate physiological stress (Warriss, Reference Warriss1998). Signs of travel sickness and weight loss have also been suggested as indicators of compromised welfare, often in relation to dehydration (Warriss, Reference Warriss1998). Increases in heart rate, particularly apparent during loading and unloading, have been recognized as indication of stress (Van Putten and Elshof, Reference Van Putten and Elshof1978) and rough handling. Climatic conditions influence travelling conditions and the physiological response of an animal. A seasonal relationship between ambient temperature and pig welfare during transport has been identified (Lendfers, Reference Lendfers1970; Allen and Smith, Reference Allen and Smith1974; Warriss and Brown, Reference Warriss and Brown1994). Pigs are particularly sensitive to high temperatures and attempt to adjust their respiration rate by panting when unable to wallow (Bracke, Reference Bracke2011). Fattening pigs may not be able to effectively regulate their body temperature during transport under hot conditions (Warriss et al., Reference Warriss, Brown, Knowles, Wilkins, Pope, Chadd, Kettlewell and Green2006). Placement in the vehicle may also affect pig welfare (Sains, Reference Sains1980; Riches et al., Reference Riches, Guise and Cuthbertson1996). Studies performed in the United Kingdom (Meat and Livestock Commission, 1993; Warriss et al., Reference Warriss, Brown, Knowles, Wilkins, Pope, Chadd, Kettlewell and Green2006) have shown that animals travelling in the front of the vehicle displayed higher cortisol, albumin, osmolality and creatine kinase (CK) levels than animals in other compartments of the same vehicle. Distance travelled may also affect animal welfare, but there is confusing evidence on the effect of journey time (Warriss, Reference Warriss1998; Averós et al., Reference Averós, Herranz, Sánchez, Comella and Gosálvez2007). The effects of journey time and space allowance on the physiology of pigs remain important unsolved issues. In order to address uncertainty concerning space allowance, a study was devised to compare pig welfare when transported over a longer distance (550 km) at a space allowance well below normal practice (target load 185 kg/m2) and at the legally required loading density (235 kg/m2). This manuscript is based on work reported by Gerritzen et al., Reference Gerritzen, Marahrens, Steinkamp, Reimert, Van der Werf and Hindle2012.
Material and methods
This research was performed in collaboration with a commercial transport organization in Schleswig-Holstein, Northern Germany, responsible for the transportation of fattening pigs to a slaughtering plant in Brandenburg, Eastern Germany. Eight similar journeys were followed in the period from June to October 2010.
Animal ethics
This study was approved beforehand by the Ethical Committee of the Animal Sciences Group of Wageningen UR, The Netherlands.
Study design and procedure
Fattening pigs (±110 kg) were transported from the same farm in one of two treatment groups. Treatment groups were targeted at a legal standard density of 235 kg/m2 (normal density (ND)) and at a lower density of 185 kg/m2 (low density (LD)). Pigs were transported in a three-tiered vehicle of which the front and rear compartments of the upper and lower decks were designated as experimental units. All journeys followed the same route of ∼550 km, of which 460 km was motorway. Each journey was performed at one of the two space allowances with two journeys being performed within the same week. During each journey all pigs in the vehicle were transported at the loading density indicated by the treatment, but only the pigs in the designated compartments were monitored. Ideally, the loading densities would have been randomly distributed per compartment throughout each vehicle. However, loading density has an effect on conditions inside the vehicle (i.e. heat production). Although commercial requirements did not allow mixing the loading density treatments, it was decided that journeys with separate loading densities would allow a clearer definition of the treatment effects. Journeys were performed within 2 days of each other in an attempt to limit variation from external effects (i.e. climate and driving conditions).
Each journey consisted of five stages:
Stage 1: the first stage began as the first pig entered the vehicle and included a short journey from the barn to the weighing bridge.
Stage 2: the second stage began with departure from the farm and comprised a large part of the journey.
Stage 3: a compulsory pause for the driver (∼45 min).
Stage 4: the fourth stage was a shorter drive (∼2 h) to the slaughter plant.
Stage 5: the final stage comprised the period taken to enter the slaughter plant, weigh the vehicle and ended as the pigs went into lairage.
Waiting times before loading varied considerably between individual pigs because of blood sampling, preparation, placement and removal of the logging devices. During this waiting period pigs were kept together in travelling groups. Although some mixing of pigs did occur in order to reach loading requirements.
Before each journey 12 female pigs were randomly selected to measure heart activity, body temperature and to provide blood samples before and after each journey. All pigs were fasted 8 h before transit. Loading sequence was from front top to lower rear pen. Upon arrival at the slaughter plant, the unloading sequence was reversed and the registration pigs were placed in a separate quarantine pen where blood samples were taken immediately upon arrival.
Measurement of environmental factors
Climate inside the vehicle was measured by sensors (30 in total) mounted on gates between the compartments on all decks. External conditions were measured with sensors attached to the outside of the vehicle. Accelerations were measured every second by three 3D movement sensors (Type: DA 3101-002; Disynet GmbH, Brüggen, Germany) and registered as tensecond averages with lower and upper extremes. Meteorological measurements were registered every minute. This included temperature (in- and outdoor), humidity (in- and outdoor), air velocity (indoor), ventilation fans (on/off) on each deck and vehicle speed. Outdoor wind speed and wind direction were measured every minute when the vane could be extended, that is before departure, during lengthy pauses and upon arrival. Water usage for the whole vehicle was measured in litres per minute. Data were recorded on a 64 channel data logger (Gantner Instruments GmbH, Schruns, Austria) placed in one of the storage compartments located under the vehicle.
ECG and body temperature
Eight of the 12 pigs were used for continuous registration of heart activity (ECG) and were equipped with remote telemetric data loggers (Lowe et al., Reference Lowe, Abeyesinghe, Demmers, Wathes and McKeegan2007) allowing continual tracing of the ECG throughout each journey. Pad electrodes (Unilect™ 5-cm diameter; Unomedical Ltd., Stonehouse, GB, UK) were fitted to the thorax immediately after shaving the area and cleansing with 70% alcohol. Three pad electrodes were fixed to the skin with Electrode gel (Signa Gel®; Parker laboratories Inc., Fairfield, New Jersey, USA) to ensure good contact immediately behind the elbow on each side of the pigs’ breast. An elastic belt was attached to protect the leads to the electrodes that were joined to a data logger placed in a small metal box housed in a leather pouch on the back of the pig. The belt was tightened and both belt and pouch were held in position using heavy duty duct tape. Data from the loggers was stored on a micro SD card and transferred to a computer. Data logging began immediately after securing belt and pouch, and instrumented pigs were held in a separate pen before loading. The four remaining pigs were equipped with Polar® devices (Polar Electro Oy, Kempele, Finland) for registration of heart beat in beats per minute (b.p.m.). The equipment consisted of an electrode belt with built-in transmitter (T31) and a wristwatch receiver (Accurex PlusTM, Polar Electro Oy, Kempele, Finland). Body temperature was measured continually in the 12 selected pigs using i-Button® Devices, type DS1921H thermo sensors (Maxim Dallas, Texas, USA) set to store at 1 min intervals. These devices were connected to a rubber ring and inserted into the vagina using a modified 20 ml syringe. After insertion, the unfolding tension of the rubber ring held the i-Button® in place. After instrumentation, the 12 pigs were allocated to the four experimental units on the upper or lower decks, that is three pigs per compartment of which two pigs equipped with ECG devices and one pig with a Polar® meter. At the slaughter plant the 12 pigs were brought together in a quarantine pen and loggers were removed ∼1 h after unloading.
ECG analyses
The ECG was analysed for average heart beats per minute within periods of 5 min (Labchart7 Pro, V7.1.2; AD Instruments, Cologne, Germany). Fast Fourier transformation was used to analyse heart beat signals obtained from the telemetric logging devices. Heart rate variability (HRV) was analysed in accordance with Von Borell et al. (Reference Von Borell, Langbein, Després, Hansen, Leterrier, Marchant-Forde, Marchant-Forde, Minero, Mohr, Prunier, Valance and Veissier2007), using Kubios software (Kubios HRV, version 2.0, Tarvainen and Niskanen, Reference Tarvainen and Niskanen2008) set at 512 points allowing a 25% overlap in frequency bands. Wave frequency bands were set at <0.04 Hz for very low frequency, 0.04 to 0.13 Hz for low frequency (LF) and 0.13 to 0.4 Hz for high frequencies (HF) in accordance with Von Borell et al. (Reference Von Borell, Langbein, Després, Hansen, Leterrier, Marchant-Forde, Marchant-Forde, Minero, Mohr, Prunier, Valance and Veissier2007). Heart rate data were analysed for each stage of the journey separately and for journeys as a whole. Analysis of measurements over the whole journey were not distinctive enough for variations in HRV measurement, these parameters were also calculated as twenty-seven 5-min segments distributed across each stage of the journey. Taking care to include a 5-min segment at the beginning and end of each stage. This resulted in 3, 11, 5, 6 and 2 five-min segments for stages 1 to 5, respectively. Time domain measurement RMSSD (root mean square of differences between successive inter-beat intervals; unit ms) was included in the analysis and LF is presented in proportion to HF (LF/HF).
Blood parameters
Two blood samples (9 ml) were taken from the vena cava cranialis in EDTA-K coated S-monovette® tubes (Sarstedt AG & CO, Nümbrecht, Germany). One sample was taken before transport, before any other handling or treatment; the second sample was taken immediately after arrival at the slaughterhouse in the quarantine pen. After blood sampling, two micro haematocrit capillary tubes (Brand, Wertheim, Germany) were filled with blood, sealed with wax and centrifuged at 13 000 r.p.m. for 5 min to assess haematocrit levels in blood. Plates of blood smear were prepared and fixated in methanol for 5 min until dry and thereafter transported to the laboratory. The remaining part of the blood samples was centrifuged at 4000 r.p.m. for 10 min and aliquots of plasma were kept on ice until the last sample had been processed. Plasma samples were then frozen in liquid nitrogen and stored at –80°C until required for further analysis. The plasma samples were analysed using a COBAS® Mira S analyser (Hoffmann-La Roche, Basel, Switzerland) in the Clinic for Swine and Small Ruminants (University of Veterinary Medicine, Hannover, Germany) for levels of protein (Pro), albumin (Alb), ratio of globulin to albumin (GlobAlb), glucose (Glu), l-lactate (Lac), lactate dehydrogenase (LDH), aspartate aminotransferase (AST) and creatine kinase (CK). Cortisol (Cort) in plasma was analysed using ELISA kits (Cortisol ELISA, RE52611 and RE52061, IBL International GmbH, Hamburg, Germany) at the FLI, Celle, Germany.
Behaviour
Animal behaviour was recorded using four wide-lensed video cameras (Sanyo Video Vertrieb AG, Ahrensburg, Germany) placed at the front and rear of the upper and lower decks. Video analysis was performed on recordings taken from closure of the experimental compartment after loading until opening of the compartment at unloading and were examined for the following behaviours:
Activity: measured at 10-min intervals of the number of active or moving animals observed during periods of 2 min. If an animal became active after a break in activity, this was counted as a new occurrence.
Posture: recumbence, standing and sitting were observed in each study compartment at 5-min intervals.
Fighting: frequency and duration of fights (aggression, involving one or more pigs) were observed by continuous sampling throughout the entire journey.
Statistical analyses
Data obtained on environmental conditions and animal-related measurements were analysed using GenStat (2010). Initial screening of the data using a student’s t-test was followed by restricted maximum likelihood variance component analysis (André et al., 2011) using the general model for analysis of heart rate data, HRV and body temperature and certain aspects of behaviour (i.e. activity and fighting):
 $$\eqalignno{ & {\rm Response}\,{\rm variate}\,:\,{\rm y} \cr & {\rm Fixed}\,{\rm model}\,:\,{\rm constant}\,{\plus}\,{\rm stage}\,{\plus}\,{\rm density}\,{\plus}\,{\rm FR}\,{\plus}\,{\rm LT}\cr \quad {\plus}\,\left( {{\rm stage}\,{\times}\,{\rm density}} \right)\,{\plus}\, \left( {{\rm stage}\,{\times}\,{\rm FR}} \right)\,{\plus}\,\left( {{\rm density}\,{\times}\,{\rm FR}} \right)\cr & \quad {\plus}\,\left( {{\rm stage}\,{\times}\,{\rm LT}} \right)\,{\plus}\,\left( {{\rm density}\,{\times}\,{\rm LT}} \right)\,{\plus}\, \left( {{\rm FR}\,{\times}\,{\rm LT}} \right) \cr & \quad {\plus}\,\left( {{\rm stage}\,{\times}\,{\rm density}\,{\times}\,{\rm FR}} \right)\,{\plus}\,\left( {{\rm stage}\,{\times}\,{\rm density}\,{\times}\,{\rm LT}} \right) \cr & \quad {\plus}\, \left( {{\rm stage}\,{\times}\,{\rm FR}\,{\times}\,{\rm LT}} \right)\,{\plus}\,\left( {{\rm density}\,{\times}\,{\rm FR}\,{\times}\,{\rm LT}} \right) \cr & {\rm Random}\,{\rm model}\,{\rm :}\,{\rm journey}\,{\plus}\,\left( {{\rm journey}\,{\times}\,{\rm compartment}} \right) \cr & \quad \,{\plus}\,\left( {{\rm journey}\,{\times}\,{\rm compartment}\,{\times}\,{\rm stage}} \right) $$
where stage is the stage of journey (n=1 to 5), density the space allowance (ND or LD), F the front compartments, R the rear compartments, T the upper deck, L the lower deck.
For analysis of the blood parameters the initial measurement was included into the above model as covariate in an attempt to avoid any systematic distortion because of sampling or otherwise. Where required (i.e. fighting, LDH, AST, CK and l-lactate) a log transformation of the input data was performed to facilitate a correct analysis.
Results
Loading density
On ND journeys, compartments on the middle and lower decks always held 13 pigs, upper deck compartments held 12, except for journey 8 when upper compartments also held 13 pigs because of lower body weights. Therefore, the calculated loading density in study compartments on journeys at ‘normal’ density was slightly below the intended truck average, that is 230 kg/m2. On LD journeys all compartments always held 10 pigs, and therefore calculated loading density in ‘low’-density study compartments was actually below the intended truck average, that is 179 kg/m2 (78% of ND study compartments).
Vehicle movement
Driving speed reached 90 km/h on motorways with no recorded peculiarities in acceleration. However, differences were observed in the level of vibration and in direction of acceleration at different locations inside the vehicle. Compared with the front-lower sensor, 2.5 times more vibration was registered by the front-upper sensor and 1.3 times more by the rear-lower sensor. Accelerations in the front-rear direction were lower than in other directions. Left-right movement was 1.8 times greater and up-down movement was 2.0 times greater than front-rear movement, indicating that most of the movement experienced by the pigs during transit was in the up and down direction. This was most pronounced in the front-upper and rear-lower locations.
Outdoor climate
The front-upper sensor malfunctioned on journeys 1, 3 and 4. Average relative humidity on LD journeys varied from 42% to 70% and from 54% to 94% on ND journeys. Variation between consecutive journeys ranged between 7% and 28%. However, this was influenced by high precipitation experienced during journey 5 (94% relative humidity).
Average outdoor temperatures ranged from 12.5°C to 22.9°C for LD and 14.0°C to 20.7°C for ND journeys. Variation between consecutive journeys varied between 0.2°C and 2.2°C. Wind speed ranged between 1.39 and 2.29 m/s, with conditions during journey 4 (2.29 m/s) being exceptionally windy. Excluding journey 4, wind speed averaged 1.6 (±0.2) m/s.
Indoor climate
Sensors malfunctioned on 12 occasions; these failures were randomly distributed throughout the vehicle and journeys.
• Relative humidity inside the vehicle was higher during ND (74±17%) than LD journeys (65±17%).
• Indoor temperature was slightly higher on ND (18.3±3.0°C) than LD journeys (17.4±4.1°C).
• Average air speed inside the vehicle was slightly higher during LD journeys, particularly during journey 4.
Air speed displayed a direct relationship to driving speed and a pause ∼4:15 to 5:00 h after departure. During this break, relative humidity and temperature appeared to increase, especially during ND journeys. Towards the evening relative humidity rose and temperature decreased.
Independent of loading density, air speed in the vehicle varied from 2.0 m/s in the front compartments to 1.3 m/s in the rear compartments. Humidity and temperature were not dependent on location in the vehicle. Air speed on the middle deck was lower (1.4 m/s) than on the upper (1.7 m/s) and lower decks (1.8 m/s). Most extreme differences in air speed were observed between the lower front (2.3 m/s, highest) and the lower rear (1.1 m/s, lowest) compartments. Humidity remained within a similar range on all decks and compartments. Temperature on the upper deck was lower (17.2°C) than on the middle (18.2°C) and lower decks (18.4°C), varying from a high of 19.3°C (lower front) to 16.6°C (upper front). The lower front compartment, therefore, appeared to display the highest temperatures despite elevated wind speeds. Ventilators, present on each deck, were rarely activated by the driver.
Behaviour
Most activity was measured during or immediately after loading. Thereafter, activity reduced relatively quickly. Up to 2 h after departure ND pigs displayed less activity than LD pigs. Thereafter, activity patterns did not differ significantly.
Differences in activity appeared to be larger between individual journeys than between loading densities. Differences in activity were observed between upper and lower compartments (P<0.001). Pigs in the lower front compartment were more active than pigs in other compartments. Significantly more activity was recorded during stage 1 of the journeys for pigs travelling in the lower compartments (P<0.001).
Posture
Most pigs were standing during and immediately after loading. Their number slowly decreased as journeys progressed. During the second half of stages 2 and 4 (mobile periods) fewer recumbent pigs were observed at ND than at LD. Peaks in recumbence were observed around the break and upon arrival with ND loads. Few animals were observed sitting. During the first few hours of a journey slightly more animals were sitting in ND than LD groups. More than half of the visible pigs were recumbent, whereas approximately one-third were standing. Variation in lying or standing was greater between journeys than between loading densities. Recumbence was lowest in stage 2 and the most recumbent pigs were observed in the upper compartments. Overall the most recumbent pigs were observed in the lower front compartment during LD journeys, while the most standing events were in the upper-rear compartment at ND. Most sitting events were observed in the front compartments with ND loads. Generalized linear mixed model analyses revealed more standing during stage 1 (P<0.001) influenced by location within the vehicle (P<0.01). A gradual decline in standing events was found as each stage progressed. Pigs sat least during stage 1 (P<0.001) influenced by space allowance (P=0.04) and placement (P=0.02).
Fighting
In total, 303 fights were registered during the eight journeys. Considering an average journey time of 0911 h this suggests that 3% of journey time was used for fighting in the study compartments. Average duration of a fight was 23 s (range 1 to 166 s).
Starting moments of fights were grouped per 30 min in order to visualize trends in number and duration of fights during the journeys (Figure 1a and b). Most fights were observed before and immediately after departure. Few fights were observed during stage 3 (break). An increase in fighting occurred at departure immediately after the break (stage 4). Throughout stage 4, more fighting occurred with longer bouts in ND than LD groups. Less fighting was observed at the end of stage 4 and after arrival at the slaughter plant. On ND journeys, most fighting occurred in the front compartments, whereas at LD fighting occurred mainly in the rear compartments. Analysis revealed that incidence and duration of fighting was influenced by stage (1 and 2; P<0.001) and placement (incidence P=0.02; duration P=0.03). Loading density also displayed an influence on fighting (P=0.05). In general, most fighting occurring on LD journeys (Figure 1).
Average incidence (a) and duration (b) of fights per 30 min in fattening pigs during eight long distance journeys from farm to slaughter plant. Journeys were conducted at normal (230 kg/m2 (n=4)) or low loading density (179 kg/m2 (n=4)). Departure at 0 h, average break after 4:15 h and average arrival after 7:42 h.
Heart activity
Use of the telemetric loggers resulted in 39 completely successful measurements, nine incomplete but useable measurements and 16 unusable failures. Measurements with Polar® equipment provided 14 completely successful data recordings and 18 unusable failures. All successful and partly successful recordings were used for further analysis. Figure 2a presents the average journey heart rate pattern according to loading density, using pad electrode equipment. Initially, heart rate is high but declines in stages 2 and 3, to increase gradually in stages 4 and 5 but never above initial levels. An increase in heart rate was observed towards the end of the break, notably in ND pigs. Average heart rates in ND pigs appear to be higher than in LD pigs almost throughout the journey. Heart rate recorded with Polar® equipment (Figure 2b) displayed largely similar patterns to pad electrode measurements. Polar® displayed a slight increase in heart rate in LD pigs immediately before and after departure from the farm and especially during the halfway break and after arrival at the slaughter plant. The highest heart rates were recorded during loading (123 to 140 b.p.m.) and the lowest during stages 2 (103 to 122 b.p.m.) and 3 (103 to 116 b.p.m.), irrespective of loading density. Consistently higher heart rates were observed at ND (ND: 113 to 121 b.p.m. compared with LD: 109 to 113 b.p.m.). Loading had an effect on heart rate (P<0.001). Placement (upper or lower deck) influenced Polar® (P<0.01) but not telemetric measurements. The highest heart rates at LD were observed in pigs located in the lower rear compartment, whereas at ND similar levels were found in pigs in the lower front compartment. Pigs transported on the lower deck tended (0.05<P<0.10) to have higher heart rate values, particularly at the front of the vehicle Figure 2.
Average heart rates measured using pad electrodes (a) and Polar® (b) equipment in fattening pigs during eight long distance journeys from farm to slaughter plant. Journeys were conducted at normal (230 kg/m2 (n=4)) or low loading density (179 kg/m2 (n=4)). Departure at 0 h, average break after 4:15 h and average arrival after 7:42 h.
HRV
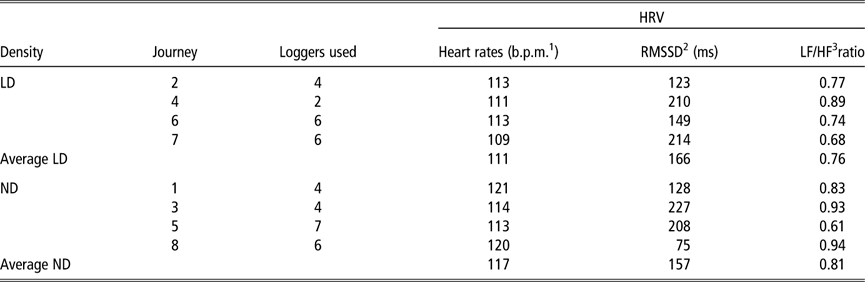
RMSSD values (Table 1) varied most (average 151±76 ms) on ND journeys, but on average were below LD levels (average 166±46 ms). Levels were highest during stages 1 and 2 and lowest during stages 3 to 5. Highest RMSSD at LD were observed in the lower compartments. Placement on lower or upper deck influenced RMSSD (P<0.01) values. Interactions between loading density and upper or lower deck placement (P=0.01), loading density and front or rear placement in the vehicle (P<0.05) and placement (front/rear/upper/lower) were influential (P<0.01) to RMSSD values. The LF/HF frequency band power ratios varied (P<0.01) between stages. During the first part of the journey, pigs transported at LD displayed higher values than those transported at ND, this appeared to be reversed as journeys progressed. Lowest values were found during stage 3. During the whole journey pigs travelling at LD displayed slightly lower LF/HF ratios (0.76; Table 1) than those transported at ND (0.81). Higher LF/HF ratios were registered in the upper compartments at LD, whereas at ND the highest values were observed in the lower rear compartment. Placement on the upper or lower deck (P=0.004) influenced LF/HF ratios.
Average heart rates and HRV parameters in fattening pigs during eight long distance journeys from farm to slaughter plant
HRV = heart rate variability; RMSSD = root mean square of differences between successive inter-beat intervals; LF = low frequency; HF = high frequency; LD = low density; ND = normal density.
Journeys were conducted at normal (ND: 230 kg/m2 (n=4)) or low loading density (LD: 179 kg/m2 (n=4)).
1 Beats per minute.
2 Root mean square of differences between successive inter-beat intervals.
3 Ratio low frequency to high frequency.
Differences in HRV parameters were larger between journeys than between loading densities. On average RMSSD (227 ms) was high on journey 3 (ND) and low (75 ms) on journey 8 (ND). Highest LF/HF ratio (0.94) was measured on journey 8.
Body temperature
Valid recordings on body temperature were available for 60 pigs. Average body temperature recorded for pigs transported at LD (38.0±0.07°C) was lower (P<0.05) than for pigs transported at ND (38.3±0.06°C) for almost the whole journey (Figure 3). Stage of the journey influenced body temperature (P<0.001). Within 2 to 3 h after departure body temperatures fell by ∼1.0°C (maximum) irrespective of loading density. From 3 h after departure onwards body temperature remained relatively stable. Body temperatures tended (0.05<P<0.10) to increase slowly during the break and after arrival (stationary stages). A distinctive rise in body temperature was observed in stage 4 (after the break). Placement (front/rear) displayed an interactive influence with stage of journey on body temperature (P<0.05). Highest and lowest body temperatures were recorded in pigs transported in the lower and upper rear compartments respectively.
Average body temperature in fattening pigs during eight long distance journeys from farm to slaughter plant. Journeys were conducted at normal (230 kg/m2 (n=4)) or low loading density (179 kg/m2 (n=4)). Departure at 0 h, average break after 4:15 h and average arrival after 7:42 h.
Blood parameters
Levels of blood parameters were analysed and response values (differences in levels after transport minus levels before transport) were calculated.
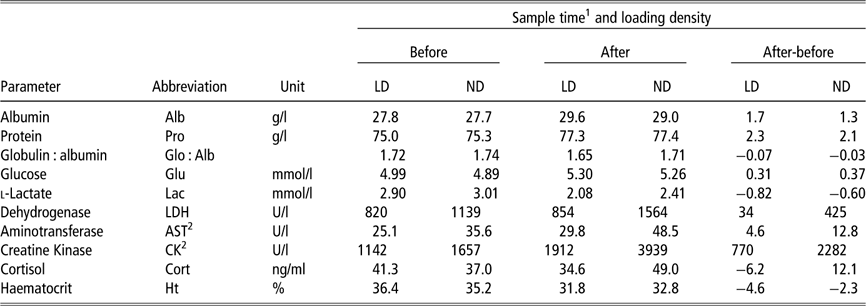
Average values for blood parameters are presented in Table 2, according to time of sampling and loading density. Loading density did not affect the different blood parameters. The increase in blood protein levels (P<0.001) was possibly influenced by positioning in the vehicle. Increases in albumin levels (P<0.001) affected the globulin : albumin balance (P<0.001).
Blood parameter averages in fattening pigs during eight long distance journeys from farm to slaughter plant
LD = low density; ND = normal density.
Journeys were conducted at normal (ND: 230 kg/m2 (n=4)) or low loading density (LD: 179 kg/m2 (n=4)).
1 Blood samples were taken from 12 randomly selected female pigs before any handling or transport and immediately after unloading at the slaughter plant.
2 Blood values after transport tended (P<0.10) to differ between loading densities.
Water usage
Valid recordings on water usage were available for five journeys. Because of high variations in water usage per minute, water use was averaged over stages of 10 min (−5 to +5 min) in an attempt to elucidate trends in water usage during the journeys.
No specific changes in water usage were apparent during the break or after arrival at the slaughterhouse (i.e. when vehicle was stationary). Variation in water usage was high between journeys, but water usage per pig was similar in ND (0.92 l/pig) and LD journeys (0.93 l/pig).
Discussion
Execution
This study was designed to determine whether or not pigs would benefit from a low (LD) loading density (target: 185 kg/m2, achieved: 179 kg/m2) compared with a normal (ND) loading density (target: 235 kg/m2, achieved: 230 kg/m2). All eight journeys were completed successfully. No fatalities occurred and no incidences of travel sickness, which is inconsistent with earlier studies (Bradshaw et al., Reference Bradshaw, Parrott, Goode, Lloyd, Rodway and Broom1996; Averós et al., Reference Averós, Herranz, Sánchez, Comella and Gosálvez2007). Not all heart activity recordings were technically successfully completed, because logging equipment was vulnerable to destruction or displacement by companion animals. However, sufficient data were collected to allow statistical analysis.
Behaviour
Pigs were most active during and immediately after loading and gradually became less active after departure. Similar behaviour has been identified in earlier research (Lambooij et al., Reference Lambooij, Garssen, Walstra, Mateman and Merkus1985; Lambooij and Engel, Reference Lambooij and Engel1991; Gade and Christensen, Reference Gade and Christensen1998) although later work appeared to contradict this by suggesting that pigs lie down during transit (Lambooij, Reference Lambooij1988; Bradshaw et al., Reference Bradshaw, Hall and Broom1995). Work by Bradshaw et al. (Reference Bradshaw, Parrott, Goode, Lloyd, Rodway and Broom1996) suggested that driving conditions may have contributed to these contrasting results. During the first 2 h of the journey pigs transported at LD were more active than those loaded at ND. This may indicate that the fewer pigs transported at LD experienced more freedom of movement than their counterparts at ND. Although loading density did not significantly affect the percentage of recumbent pigs, it appears that at LD a larger percentage (60%) was recumbent 1 hour before the lunch break than at ND (20%). This suggests that during driving pigs need to rest and will lie down if sufficient space is available, as advocated in earlier work (Lambooij and Engel, Reference Lambooij and Engel1991).
During the break (vehicle stationary), up to 80% of the animals were recumbent irrespective of loading density. This urge to lie down is considered an indication of a desire to rest which was presumably restricted when the vehicle was moving.
Fighting occurred during all journeys. Most fights were observed at loading, in the first 2 h after departure and immediately following the break, as observed earlier (Lambooij, Reference Lambooij1988; Bradshaw et al., Reference Bradshaw, Parrott, Goode, Lloyd, Rodway and Broom1996). Fighting duration was significantly longer with an increase in fighting incidents directly after the lunch break at ND. Incidence of fighting in the LD groups was highest after departure at the beginning of each journey. During the stage immediately following loading and departure newly grouped animals attempt to establish a ranking order particularly when more living space is available. In addition, location in the vehicle appeared to affect fighting behaviour depending on loading density. During ND journeys most fighting occurred in the front compartments in direct contrast to LD where most fighting occurred in the rear. Positioning in the vehicle and problems related to (poor) ventilation have been related to fighting in earlier studies (Meat and Livestock Commission, 1993; Gade and Christensen, Reference Gade and Christensen1998; Warriss et al., Reference Warriss, Brown, Knowles, Wilkins, Pope, Chadd, Kettlewell and Green2006), but this cannot suffciently explain our present findings.
Physiology
Animals respond both physiologically and behaviourally to transport conditions. Pigs, in particular, are highly sensitive to travelling conditions, but capable of adapting to new situations (Becerill-Herrera et al., Reference Becerill-Herrera, Alonso-Spilbury, Trujillo Ortega, Ramírez-Necoechea, Guerrero-Legarreta, Roldan-Santiago, Pérez-Sato, Soní-Guillermo and Mota-Rojas2010). In the 3 h before transportation, body temperatures were higher than at any time during vehicle movement. This elevated baseline body temperature was expected because of handling and restraining of pigs during instrumentation and initial measurement. Interestingly, higher body temperatures were observed during loading at ND compared with LD. This is considered to be related to increased activity or stress associated with the limited space in the vehicle (Becerill-Herrera et al., Reference Becerill-Herrera, Alonso-Spilbury, Trujillo Ortega, Ramírez-Necoechea, Guerrero-Legarreta, Roldan-Santiago, Pérez-Sato, Soní-Guillermo and Mota-Rojas2010). During transportation, body temperatures decreased consistently returning to baseline values within 1 h. However, body temperature remained slightly elevated in ND pigs. Heart rates increased considerably from baseline values during the loading stage, an observation seen in earlier work (Van Putten and Elshof, Reference Van Putten and Elshof1978). However, as soon as loading was completed, heart rates started to decline and gradually return to baseline values. Such an initial rise in heart rate could be accountable to an initial shock effect as described by Lewis et al. (Reference Lewis, Hulbert and McGlone2008) due to the novelty of the situation. Although not significant, heart rates remained higher in ND pigs. Surprisingly, heart rates were elevated during the break (stage 3), shortly after parking heart rates began to increase, especially in ND pigs. After a short period, body temperatures also increased during the break. Since more than 80% of the pigs were recumbent during the break it was expected, that body temperatures and heart rates would be at baseline levels or slightly above. No mechanical ventilation was activated during the break, resulting in increased ambient temperatures inside the vehicle. It is hypothesized that this increase in ambient temperature stimulated higher heart beat rates in an attempt to maintain a comfortable body temperature. Since weather conditions during our study were not extreme it is conceivable that inadequate ventilation, during stationary periods, compromised animal welfare. Mechanical ventilation fans were not used during the journeys or resting periods in this study. Improved protocols and education of drivers are expected to substantially benefit pig welfare during transport, especially during more extreme weather conditions than those experienced during this study.
HRV was not effected by loading density in this study. Differences were found in HRV for pigs on the upper and lower floors, but these findings are inconsistent and difficult to evaluate.
Blood parameters
Earlier work (Knowles and Warriss, Reference Knowles and Warriss2007; Averós et al., Reference Averós, Herranz, Sánchez and Gosálvez2009; Calà et al., Reference Calà, Tassone, Comellini, Ielo, Volpelli, Dall’Olio and Nanni Costa2009), has indicated that transport stress can cause increased levels of cortisol (during short journeys; Averós et al., Reference Averós, Herranz, Sánchez, Comella and Gosálvez2007) and glucose (Becerill-Herrera et al., Reference Becerill-Herrera, Alonso-Spilbury, Trujillo Ortega, Ramírez-Necoechea, Guerrero-Legarreta, Roldan-Santiago, Pérez-Sato, Soní-Guillermo and Mota-Rojas2010). No significant changes in blood values related to stress were found. However, average cortisol levels decreased by 6.2 ng/ml in LD pigs and increased by 12.8 ng/ml in ND pigs. Suggesting, perhaps, a tendency for ND pigs to be more stressed than LD pigs. Fatigue can result in changes in muscular intercellular enzymes such as CK and LDH. Changes in AST have previously been regarded as indicating muscular degeneration resulting from road transportation (Adenkola et al., Reference Adenkola, Ayo, Sackey and Adelaiye2009). LD pigs tended (0.05<P<0.10) to show lower levels of CK and AST in the blood compared with ND pigs. Since ND pigs also showed longer bouts of fighting and shorter periods of resting it appears that ND pigs were experiencing higher levels of fatigue than LD pigs. Together with the trend in elevated cortisol levels and shorter resting periods, this provides support for the view that pigs transported according to EU requirements are potentially more stressed than those transported at densities allowing more space per animal.
Increases in blood albumin and total protein concentrations may indicate onset of dehydration (Averós et al., Reference Averós, Herranz, Sánchez, Comella and Gosálvez2007 and Reference Averós, Herranz, Sánchez and Gosálvez2009) along with elevated haematocrit and red blood cell counts. No signs of dehydration were observed. In this study, all animals had access to drinking water throughout each journey and average water usage per individual animal was 1 l irrespective of loading density. This confirms the value of providing drinking water to pigs during resting periods, as well as in transit.
Conclusions
Incidence of fighting bouts were influenced by loading density, period within the transport and formation of travelling groups by mixing unfamiliar animals.
Heart rate and body temperature were increased during handling and loading clearly indicating that this is a stressful stage of transportation.
When provided with sufficient space pigs will lie down after loading and remain recumbent during driving stages until the break. Thus transportation at a loading density lower than that used in commercial practice appears to benefit pig welfare.
Observed differences in heart rate levels and blood values, although not significant, indicated an adaptation potential by pigs to transport conditions when allowed more living space.
Acknowledgements
The authors are grateful to Mr Temme Struck and personnel for their co-operation and hospitality throughout the study. They thank J. Westra and D. Anjema for technical assistance and I. von Frantzius-Kühne and H. Halbfass for behavioural analyses of the videos. We are also very grateful to Dr K. van Reenen and Dr G. André for statistical analysis of the data and M. Verhoeven, MSc. For critically reviewing drafts of the paper.
This study was executed as policy support on behalf of the Dutch Ministry of Economic Affairs, Agriculture and Innovation: project BO-070-011-055.