1. INTRODUCTION
In the initial phases of the design process, designers aim to expand their creative energies in their efforts to generate ideas for a better and innovative design. Whether they are considering building a completely new design or renovating an old one, designers rely on existing examples to generate and build their ideas for a better and innovative design. However, while considering these existing examples as a means for initiating creativity, designers could be limiting their means for extracting and developing creative ideas. This limitation of one's ability to extract and formulate creative ideas for implementing a design describes the very notion of design fixation.
According to Jansson and Smith (Reference Jansson and Smith1991), design fixation refers to an obstacle for solving a given design problem, often self-imposed by the designer. This remains very prominent during idea generation in the conceptual development stage in the design process. In idea generation, designers develop a plethora of potential solution ideas and need to communicate these ideas in an appropriate manner that describes this basic element of thought (Jonson, Reference Jonson2002; Pahl & Beitz, Reference Pahl and Beitz2003). In order to stimulate more thoughts in designers, they turn to existing examples. The manner in which the external examples are presented to designers influences the amount of creativity and fixation that results in similar types of ideas being generated (Fish & Scrivener, Reference Fish and Scrivener1990; Goldschmidt, Reference Goldschmidt1991).
This study aims to assess differences in the way engineering students may fixate on design examples presented as either prototypes or sketches. By analyzing these differences, the authors expect to see fixation to be influenced by the extent of familiar features contained in an example and the modality that an example is presented in to the engineering students. In order to elicit fixation, a controlled experiment was performed on engineering students. This paper further discusses this experiment through a background literature review, a method overview, an evaluation analysis, and a discussion synthesis.
2. LITERATURE REVIEW
2.1. Design fixation
Throughout the development stages of the design process, designers seek to develop innovative and influential design solutions, but have the tendency to fixate on example features in existing designs (Jansson & Smith, Reference Jansson and Smith1991; Purcell & Gero, Reference Purcell and Gero1996; Chrysikou & Weisberg, Reference Chrysikou and Weisberg2005; Viswanathan & Linsey, Reference Viswanathan and Linsey2010). Fixating on designs, also termed as design fixation, represents the innate attachment of a person to familiar or initial ideas, which in turn confines the person's scope for creativity and idea generation (Jansson & Smith, Reference Jansson and Smith1991). Potentially, this confinement can lead a designer to neglect to recognize and accept innovative features for creating novel solutions to their design problems. While Jansson and Smith (Reference Jansson and Smith1991) originally demonstrated the severity of fixation in designers blindly copying example features for a given design, further work emanated to further investigate fixation in designers. Shortly thereafter, researchers expanded on Jansson and Smith's work by demonstrating that due to differences in fixation between mechanical engineers and industrial designers, there are potentially different forms that fixation can take (Purcell & Gero, Reference Purcell and Gero1992, Reference Purcell and Gero1996). Regardless of the form, both novice and expert designers are susceptible to committing to certain designs prematurely (Viswanathan & Linsey, Reference Viswanathan and Linsey2010, Reference Viswanathan and Linsey2013a). In turn, it is important to consider how the designers, regardless of skill level, are being influenced by examples during idea generation.
2.2. Fixation in engineering idea generation
In attempts to help designers to generate ideas, example solutions can be presented to them in order to assist in stimulating idea generation. However, by presenting them with example solutions, designers recognize and fixate on features of the presented example (Jansson & Smith, Reference Jansson and Smith1991; Purcell & Gero, Reference Purcell and Gero1992; Smith et al., Reference Smith, Ward and Schumacher1993; Cardoso et al., Reference Cardoso, Badke-Schaub and Luz2009; Linsey et al., Reference Linsey, Tseng, Fu, Cagan, Wood and Schunn2010; Viswanathan & Linsey, Reference Viswanathan and Linsey2010; Cardoso & Badke-Schaub, Reference Cardoso and Badke-Schaub2011). In solving mathematical problems, fixating on an example solution path can warrant focus and provide a clear notion toward determining a correct solution (Voss et al., Reference Voss, Vesonder and Spilich1980; Goldschmidt, Reference Goldschmidt1989). Nevertheless, problems in engineering design are much less restrictive and limited than problems in mathematics. Even though a more confined scope is deemed beneficial in manifesting solutions to mathematical problems, a more confined scope will limit the engineering design space for designers in developing novel solutions. Moreover, both engineering design and psychology researchers have further investigated design fixation and the potential limitations that occur when presenting designers with examples (Jansson & Smith, Reference Jansson and Smith1991; Purcell & Gero, Reference Purcell and Gero1996; Wiley, Reference Wiley1998; Christensen & Schunn, Reference Christensen and Schunn2005; Viswanathan & Linsey, Reference Viswanathan and Linsey2010, Reference Viswanathan and Linsey2013a, Reference Viswanathan and Linsey2013c).
More particularly, fixating on features in examples is prominent when examples are presented in visual forms to designers (Goldschmidt & Smolkov, Reference Goldschmidt and Smolkov2006). Numerous studies have shown that utilizing sketches, photographs, or even physical models as external visual stimuli have prompted design fixation during idea generation (Purcell & Gero, Reference Purcell and Gero1996; Kiriyama & Yamamoto, Reference Kiriyama and Yamamoto1998; Chrysikou & Weisberg, Reference Chrysikou and Weisberg2005; Viswanathan & Linsey, Reference Viswanathan and Linsey2010; Cardoso & Badke-Schaub, Reference Cardoso and Badke-Schaub2011; Viswanathan & Linsey, Reference Viswanathan and Linsey2012, Reference Viswanathan and Linsey2013a). When examining the effects of external stimuli, Perttula and Liikkanen (Reference Perttula and Liikkanen2006) and Perttula and Sipilä (Reference Perttula and Sipilä2007) expand on fixation in example exposure and negate that the effects do not necessarily hinder idea generation performance and behavior. Similarly, researchers in both engineering design and psychology examined and found potential benefits resulting from exposing designers to examples for external stimulation in idea generation (Brown et al., Reference Brown, Tumeo, Larey and Paulus1998; Coskun et al., Reference Coskun, Paulus, Brown and Sherwood2000; Dugosh & Paulus, Reference Dugosh and Paulus2005; Goldschmidt & Smolkov, Reference Goldschmidt and Smolkov2006; Perttula & Sipilä, Reference Perttula and Sipilä2007). Although these studies do not focus particularly on design fixation with example exposure, examples can assist in helping designers to connect ideas and remain focused on meeting the requirements for the design (Fu et al., Reference Fu, Cagan and Kotovsky2010; Hannah et al., Reference Hannah, Joshi and Summers2012; Youmans, Reference Youmans2011). To further assist designers to connect ideas, Purcell and Gero's (Reference Purcell and Gero1996) study determined that the way an example is presented, whether sketch, photograph, or prototype, will designate the extent to which designers fixate on features in the example.
2.3. Types of fixation
Fixation exists in a variety of forms when it comes to solving design problems. These forms take shape in the mind of the designer through knowledge and memory networks (Matlin, Reference Matlin2005). When designers are presented with an open-ended design problem, they retrieve potential solution ideas through their current repository of memories and knowledge (Jansson & Smith, Reference Jansson and Smith1991). In some instances, the network model for memory best describes the reasoning behind design fixation (Matlin, Reference Matlin2005). While designers continue to gain pieces of new knowledge, they store the new concepts in a weblike infrastructure that connects one piece to another and ultimately are building a larger knowledge repository (Collins & Loftus, Reference Collins and Loftus1975; Anderson, Reference Anderson1983; Goldschmidt, Reference Goldschmidt2007). When designers are presented with another new concept, they inherently searches through the weblike infrastructure in order to locate a related concept within their memory. In essence, the designer has an easier ability retrieving concepts that are within closely related domains than domains that are distant from each other. It is this inability to connect distant domains and this reliance on closely related domains that trigger design fixation (Christensen & Schunn, Reference Christensen and Schunn2007).
Another trigger for design fixation is through functional fixedness. Functional fixedness is a more specific approach to design fixation, where the designer focuses on a certain function in a design or object despite there being numerous other functions that need to be addressed in order to solve a design problem (Maier, Reference Maier1931; Arnon & Kreitler, Reference Arnon and Kreitler1984). In efforts to remove this fixation to certain functions, Hirtz et al. (Reference Hirtz, Stone and McAdams2002) established a functional basis terminology in order to establish a general vocabulary to use when searching for design solutions across domains. McCaffrey (Reference McCaffrey2012) recently created the generic-parts technique as a means to address the need for implementing techniques that initiate inspiration for generating ideas to solve design problems.
For solving design problems, much of the existing literature looks at the relevance and impact that examples have in causing designers to fixate and how this may hinder or help the designers in exploring the solution space for creative ideas. Because examples act to stimulate a designer, the designer may be more sensitive to and fixate more on example components. Hence, it is essential to identify the factors leading to design fixation and devise new methods to reduce the chances of fixation. As explained earlier, many existing studies show that an example can lead designers to fixation (Jansson & Smith, Reference Jansson and Smith1991; Purcell & Gero, Reference Purcell and Gero1996; Chrysikou & Weisberg, Reference Chrysikou and Weisberg2005; Viswanathan & Linsey, Reference Viswanathan and Linsey2010); however, the effects of the type of example and the modality of the example are not studied in much detail. While many studies on fixation deal with visual representations, in a more realistic scenario these examples can come from a variety of sources, including sketches, three-dimensional objects, or even a number of objects or events. Keeping these factors in mind, this paper aims to examine the effects of example familiarity and modality on the extent of design fixation on said example.
For the purpose of this paper, “familiarity” to an idea can be defined as the probability for a participant to use said idea for addressing a functional requirement in his or her design. The familiarity of an idea is judged in this paper using the data available from several past studies where the participants generated ideas for the same design problem as in the current study. Most frequently repeated ideas are the ones that a designer can retrieve easily from memory compared to the unfamiliar ones. Hence, it can be hypothesized that when prompted with the familiar ideas, participants fixate more to these ideas and the ones that are closely related. In other words, the availability of very familiar features in an example solution might cause greater fixation compared to unfamiliar features.
The second factor considered for this study is the example's “modality.” Modality can be defined as the representation that is used to convey the example. An example can be conveyed in two-dimensional sketches, pictures, or three-dimensional models (both physical and virtual). Three-dimensional prototypes are considered to be more realistic compared to sketches and photos. It can be argued that when a participant interacts with a realistic three-dimensional prototype, he or she gains more information from it compared to a sketch of the same idea. However, this realistic nature also might cause participants to fixate more on said design and its features.
Based on the above discussion, two hypotheses are formulated and investigated further in this paper.
Example familiarity hypothesis: Designers will fixate more on an example consisting of familiar features compared to one consisting of unfamiliar features.
Example modality hypothesis: The extent of design fixation on an example will depend on the modality used to convey the example.
3. METHOD
The data collection was done as a controlled experiment with five different conditions. In all conditions, the participants were asked to generate ideas for solving a realistic design problem. Depending on the experimental condition, they received an example in one of the chosen modalities (except in the control condition). All the participants were allotted the same amount of time (50 min) to generate solutions for the design problem. These 50 min include the time to read and understand the problem, inspect any prototype, and generate ideas for solving the problem. Across the experimental conditions, various metrics were employed and compared in order to provide insights about the role of example familiarity and modality on the extent of design fixation. The details of the experiment conducted are depicted in the following subsections.
3.1. Design problem
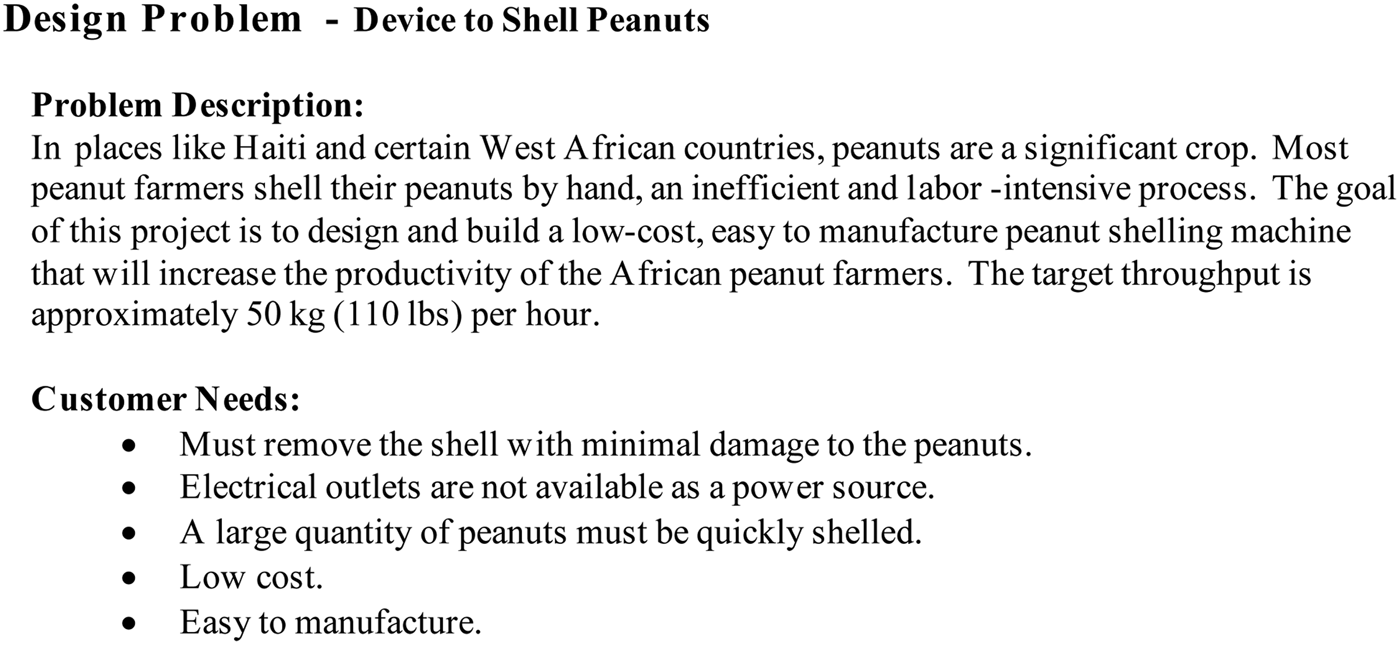
All the participants in this study were asked to solve a peanut sheller design problem. The design problem asked the participants to generate solutions for a machine that could quickly and efficiently shell peanuts. This machine was to be used in developing economies like Haiti and some low-income West African countries. The participants were told that electrical outlets were scarce in such areas; therefore, said machine was expected to shell peanuts without using electricity. The machine was also expected to shell peanuts with minimum damage to the peanuts. Figure 1 shows the design problem statement provided to the participants.
Design problem description provided to the experiment participants.

The peanut sheller design problem was a realistic problem in that it presented challenges for a daily real-life activity of shelling peanuts. All the participants were mechanical engineering students and were expected to have experienced the routine task of shelling peanuts. This design problem was successfully employed in many prior studies (Viswanathan & Linsey, Reference Viswanathan and Linsey2010, Reference Viswanathan and Linsey2013a, Reference Viswanathan and Linsey2013b; Linsey et al., Reference Linsey, Clauss, Kurtoglu, Murphy, Wood and Markman2011). However, none of the participants were familiar with the design problem before generating ideas in this study.
3.2. Participants
This study was conducted as a class exercise in a capstone design class at Texas A&M University over the span of two consecutive semesters. A total of 75 senior undergraduate students volunteered for the experiment. All these participants were mechanical engineering students. These participants were randomly distributed across the experimental conditions. Each condition had 15 participants. The participants were compensated with either extra credit or money. They were allowed to choose the type of compensation for their participation. Neither the extra class credit nor the monetary compensation was large enough to force participation in the study.
3.3. Experimental conditions
This experiment had five different conditions: control, gas press picture, gas press prototype, full belly picture, and full belly prototype. Each of these conditions is described in detail below.
3.3.1. Control condition
The study participants in the control condition were instructed to solve the design problem without the help of any example. They were provided the design problem statement and blank sheets of paper to record their solutions. They were instructed to draw as many solutions to the design problem that they could think of. They were encouraged to label parts of their ideas and provide a very brief description about the working of each concept. They were also encouraged to record their thoughts and comments as they generated their ideas.
3.3.2. Gas press picture condition
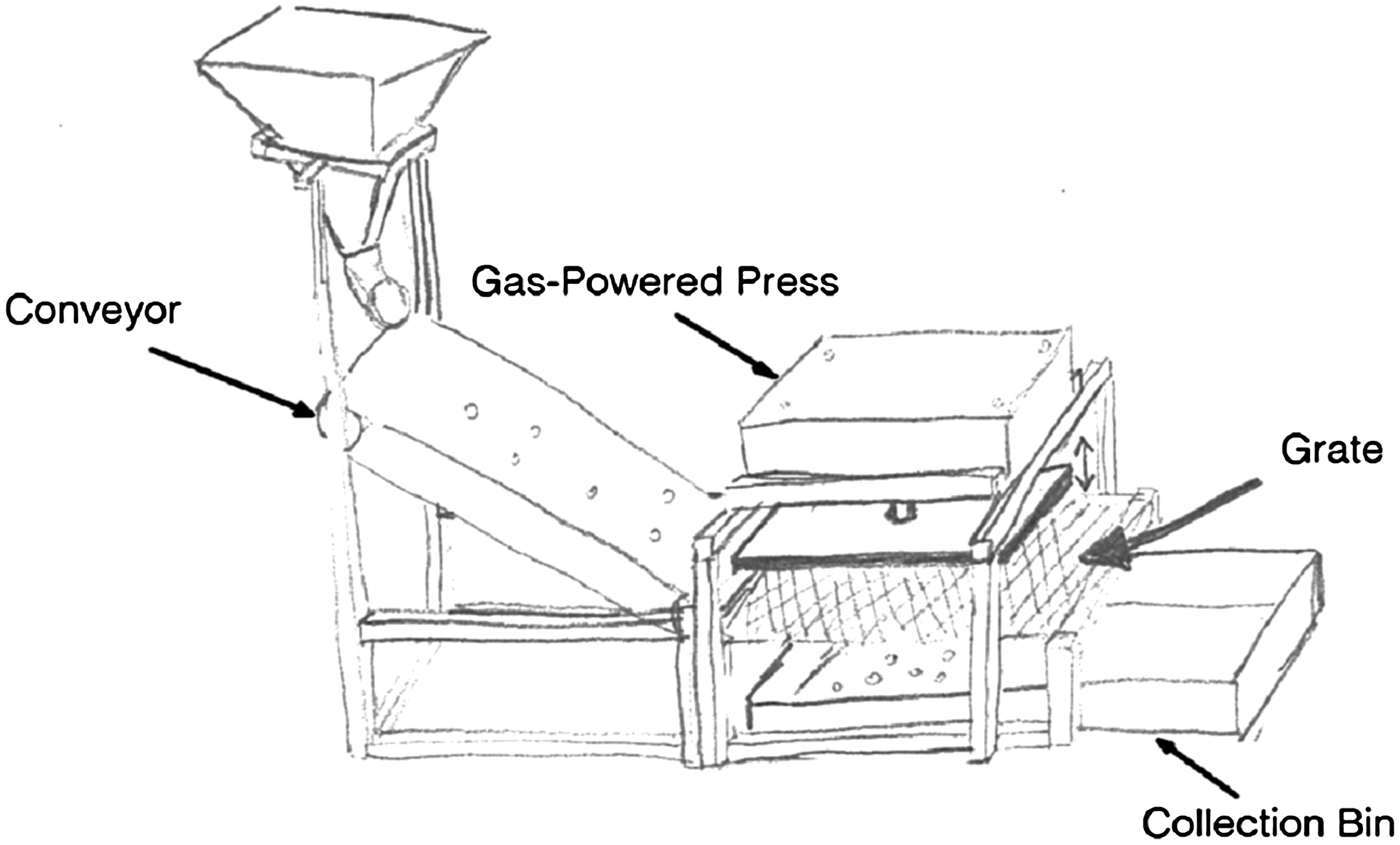
In this experimental condition, the idea generation activity remained the same as in the control condition, but the participants received an example in pictorial form. Figure 2 shows the example that they received. This picture depicts a gas press that crushed the peanuts in order to shell them. It used a hopper and an inclined surface to import the peanuts to the gas press, and then the gas-powered press crushed the peanuts. The shelled peanuts and the trash were separated through a mesh, and were later collected in bins placed below the mesh. While this design seemed like a feasible solution to the design problem, it possessed several shortcomings. First, there were no mechanisms in this design that aimed to prevent potential damage to the peanuts. Second, the gas-powered mechanism was not economical to low-income communities as mentioned in the problem. Third, this design did not offer any mechanism to effectively filter the shelled peanuts and shells. While these shortcomings were not stated directly, the participants were expected to understand these by a quick mental analysis of the example. The example was available to them throughout the idea generation process.
The hand sketch of gas press example provided to the participants in the gas press picture condition.
The gas press example was originally designed by Linsey et al. (Reference Linsey, Tseng, Fu, Cagan, Wood and Schunn2010) as a part of their design fixation experiment. For said study, the authors combined several example features that frequently appeared in the solution for the same design problem in their previous experiments. In other words, this example contained several design features that were frequently used by participants in similar studies, and hence they were considered as familiar features. Because of this, for the purpose of this study, the gas press example was considered as a familiar example. This example was used by various other studies on design fixation as well (Viswanathan & Linsey, Reference Viswanathan and Linsey2013a, Reference Viswanathan and Linsey2013b).
3.3.3. Gas press prototype condition
In this experimental condition, the participants received the gas press example in a prototype form. The prototype used was a representational prototype (Fig. 3). In this prototype, all parts of the example were present except the gasoline-powered engine driving the press. The students were told that the box at the top of the prototype was expected to house the gas-powered engine, and with an addition of an actual gas engine, the machine would work as expected. The support framework of the machine was made out of wood. The students were allowed to inspect the prototype at any point during the experiment. The prototype was visible to all participants throughout the idea generation activity.
Nonfunctional prototype of the gas press example given to the participants in the gas press prototype condition.
3.3.4. Full belly picture condition
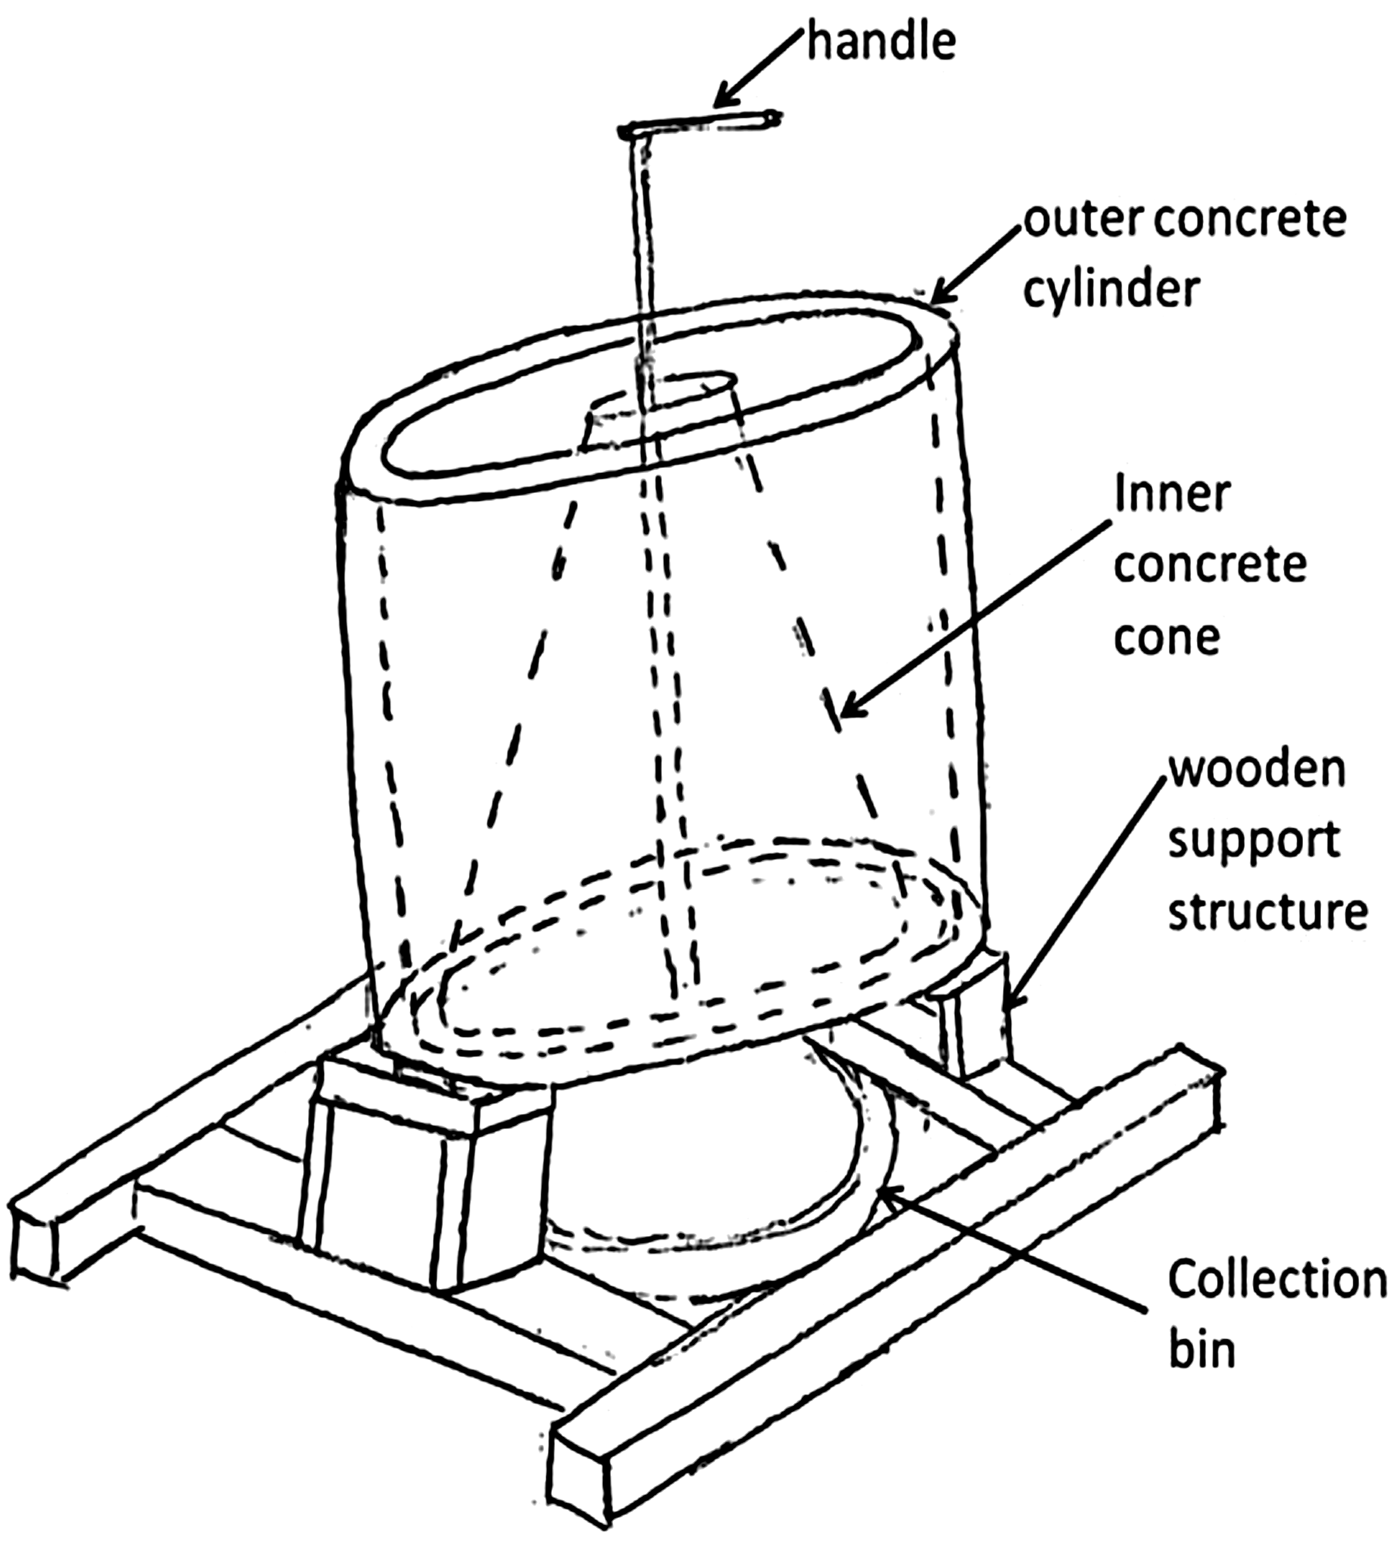
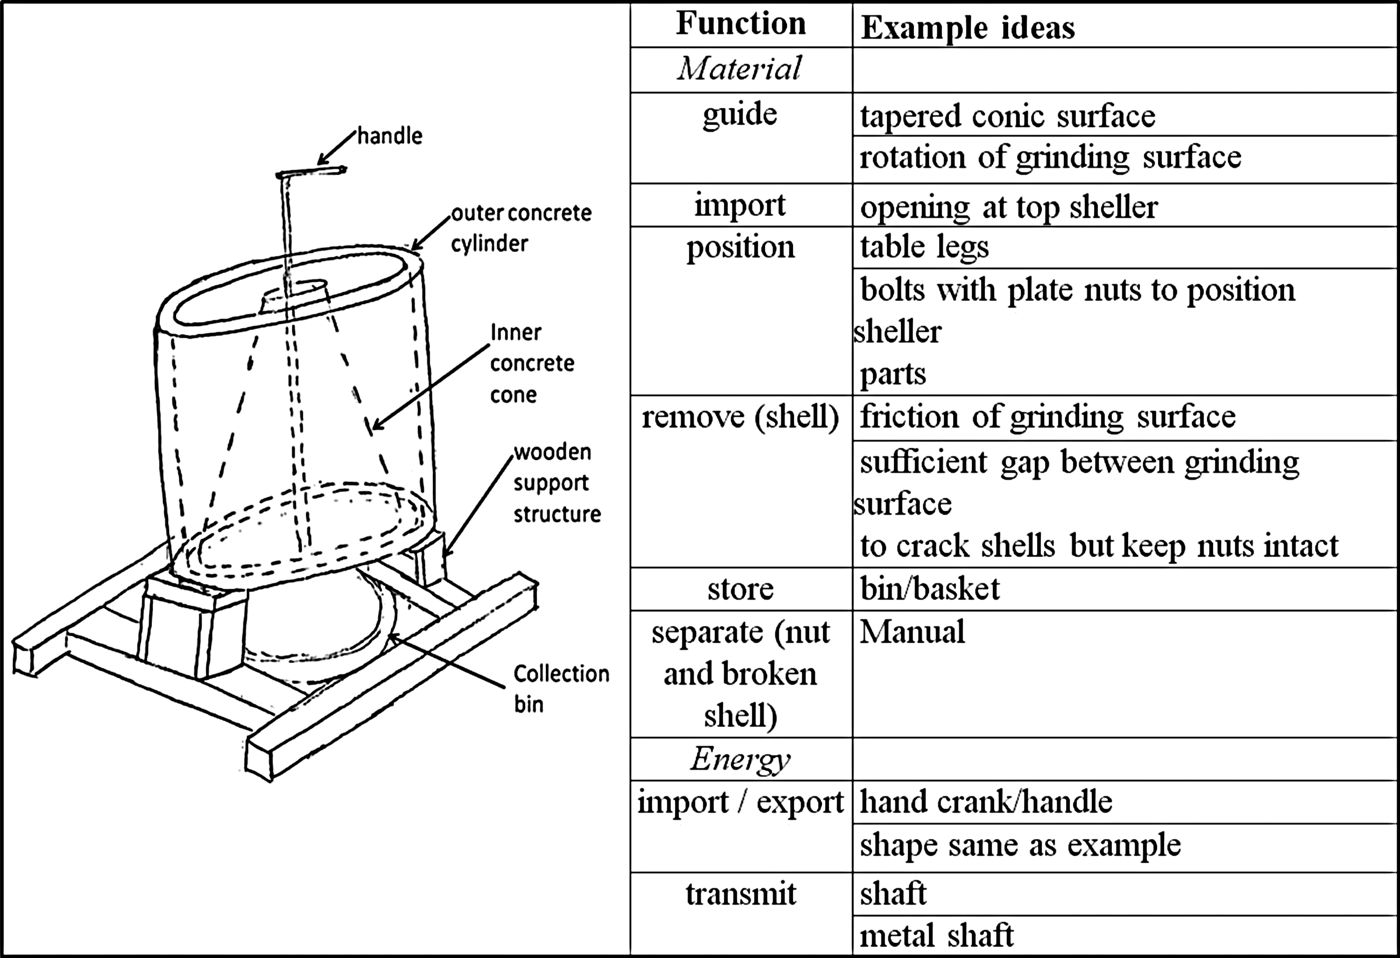
The participants in this experimental condition received a full belly example for the peanut sheller design problem. This example consisted of a manually operated mechanism as shown in Figure 4. This example was inspired by the Full Belly Project (2011). This employed a manually powered concrete cone that rotated concentrically inside a fixed concrete cylinder. The peanuts were imported manually to the system through the top opening of the concrete cylinder. Later, these peanuts were guided through the system using the inclined cone surface and the rotation of the cone. While the peanuts progressed through the system, the gap between the inside surface of the cylinder and the outside surface of the cone reduced, crushing the peanut shells. The minimum gap between the cone and the cylinder was designed to be slightly larger than the average diameter of a shelled peanut. Hence, this system crushed the shells, leaving peanuts undamaged. The shells and peanuts were collected in a bin at the bottom and were separated manually.
The hand sketch of the full belly example provided to the participants in the full belly picture condition.
The full belly example differed from the gas press example in two different aspects: familiarity and functionality. As stated previously, the gas press example was originally derived by combining a few popular ideas for solving the peanut sheller problem (Linsey et al., Reference Viswanathan and Linsey2010). Thus, the familiarity of the participants with the features of this example was likely to be high. In contrast, the full belly example contained many features that were not first choices for the functions to be satisfied. The gas press example was likely to be infeasible for the economies mentioned in the problem. Even if such a solution was employed, this machine could not control the damage to the peanuts. The full belly example was comparatively feasible and efficient. It was derived from a solution that exists in practice for the peanut shelling problem (Full Belly Project, 2011).
3.3.5. Full belly prototype condition
In this experimental condition, the full belly example was given to the participants in the form of a fully functional prototype. The prototype is shown in Figure 5. This was made of concrete and was supported on a wooden framework. At the beginning of the experiment, the prototype was operated to demonstrate its functionality. This demonstration lasted around 5 min at the beginning of the experiment. The participants were allowed to inspect the prototype at any time during the experiment. In addition, the prototype was visible to all participants during the experiment.
Fully functional prototype of the full belly example given to the participants in the full belly prototype condition.
3.4. Procedure
This study was conducted as a classroom activity in a capstone design class. At the beginning of a regular class period, the experimenter presented the students an opportunity for participation in the study. They were informed that their participation was fully voluntary, and they could receive extra credit or money as compensation for their participation. The students who were not willing to participate in the experiment were requested to leave the classroom. After they left, the experiment packets were distributed to the participants. Each packet contained the instructions to solve the design problem, the design problem description, and the example, if any, as determined by the experimental condition. The packets also contained blank sheets of paper for the participants to record their generated solutions. For the participants in the experimental conditions where the example was presented in a prototype form, the packets contained a top sheet that asked them to follow one of the experimenters to one of the other classrooms where the physical models were set up. The participants in the remaining conditions were instructed to remain in the original classroom.
After the participants in the experimental conditions with prototypes of examples left the room, the participants in the other three conditions were instructed to open their experiment packets. They were given a total of 50 min to read and understand the instructions and then to generate concepts for solving the design problem. The instructions asked them to record one concept per page with the sketches of the concept along with labels and brief descriptions. They were also instructed to note the time at which they finished each concept at the bottom right corner of the page. At the end of 50 min, they were asked to stop the idea generation, and then the experimenter collected the packets from them.
The participants in the conditions with an example prototype were guided to one of the two classrooms by an experimenter. The first room had the gas press example set up in it, whereas the second one had the concrete prototype of the full belly example. The prototypes were set up at the front of the classroom before the start of the experiment. After the participants read the instructions and the design problem, the experimenter described the prototype and its functionality to the participants. In the case of the full belly prototype, the experimenter demonstrated the working of the prototype with actual raw peanuts. The participants were also allowed to inspect or operate the prototype at any point during their idea generation. Then, they were asked to generate solutions for solving the design problem. The physical example was present in front of them throughout the idea generation. Then a total of 50 min were available to the participants for reading the instructions, inspecting the prototype, and generating ideas. Once again, the instructions asked them to record one concept per page, label sketches, provide brief descriptions, and note the time that they finished each concept. At the end of 50 min, the participants were instructed to stop the idea generation, and the packets were collected by the experimenter.
Study participants in all the experimental conditions were required to record the time at which they finished each solution. The recorded time was only used to verify if there was any difference in the average time taken by a participant to generate solutions depending on the specific condition he or she was in. For example, in the prototyping conditions, the participants were allowed to inspect their prototype during the idea generation. If they spent a lot of time doing this, their idea generation might be slower compared to the other groups. However, no such effects were found. Due to this reason, the data from the recorded time was not included in the analysis.
3.5. Metrics for evaluation
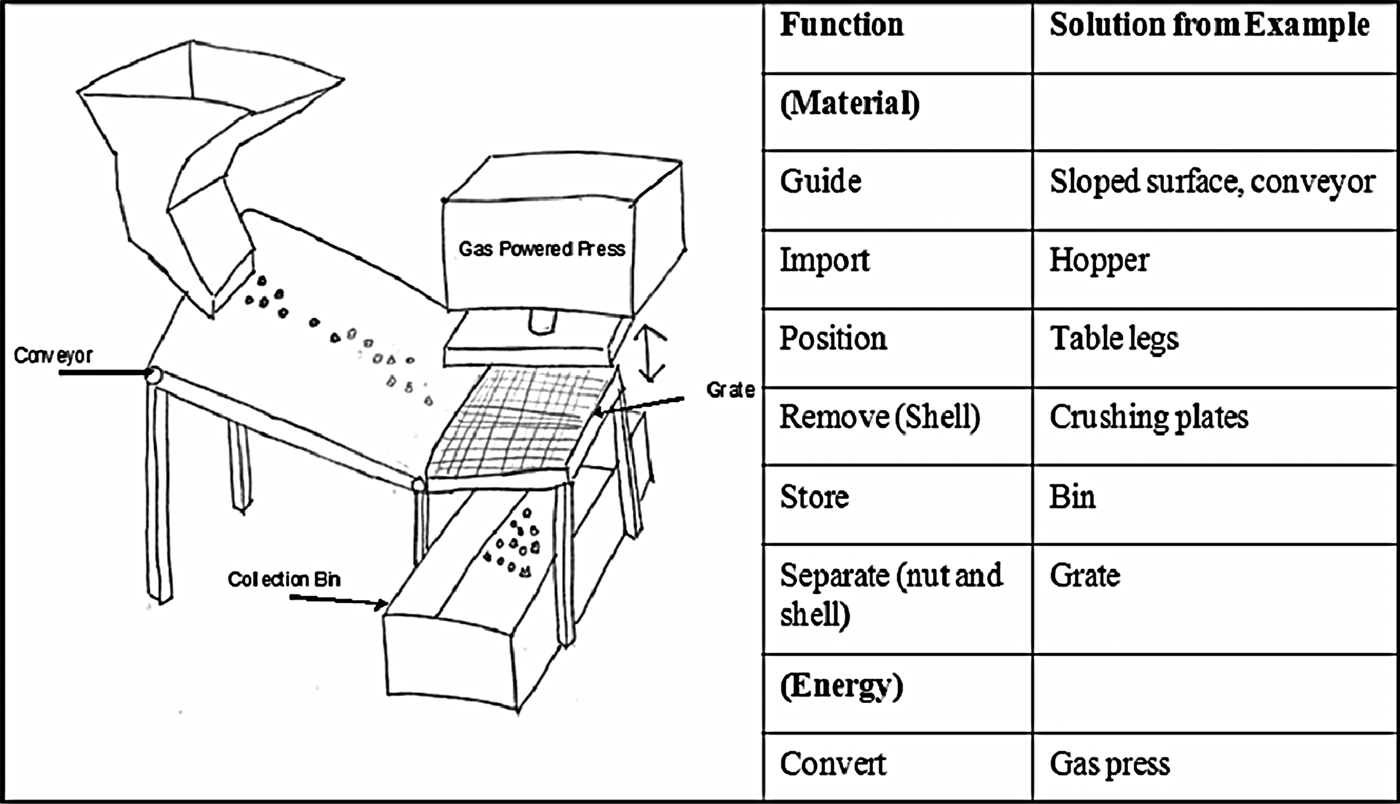
In this study, five different metrics are utilized for measuring the extent of design fixation. These metrics are: quantity of nonredundant ideas, number of times example ideas are used, percentage of example ideas used, number of energy sources, and percentage of solutions using the same energy source as the example. All these metrics were used in prior studies under similar circumstances (Viswanathan & Linsey, Reference Viswanathan and Linsey2010, Reference Viswanathan and Linsey2013a). For the purpose of this paper, an idea is defined as a feature in a solution that performs one or more of the functions to be performed by the overall design. A solution refers to a collection of ideas that forms the complete required functionality of the design. For example, a mesh is an idea or feature to satisfy the function filter in a solution that contains several other ideas. The functional basis (Hirtz et al., Reference Hirtz, Stone and McAdams2002) is used to determine the functions to be satisfied to solve the design problem. For example, Figures 6 and 7 show the ideas counted within the gas press and full belly examples, respectively. The ideas in each solution are separated by a judge, and these ideas are used for the calculation of the metrics. An independent judge also calculated these metrics separately on 50% of the data, and an interrater reliability score (Pearson correlation; Clark-Carter, Reference Clark-Carter1997) was calculated to ensure the repeatability of these measures.
Ideas identified from the gas press example provided to the participants.
Ideas identified from the full belly example provided to the participants.
Quantity of ideas is a metric that is originally suggested by Shah et al. (Reference Shah, Kulkarni and Vargas-Hernandez2000) and further developed by Linsey et al. (Reference Linsey, Green, Murphy, Wood and Markman2005). For the control condition and the purpose of calculating the quantity, repeated ideas are counted only once. A repeated idea is the one that appears in multiple solutions by the same participant. For example, a participant might use mesh as an idea for the function filter in five different solutions generated during ideation. In such cases, mesh is counted only once, for its first appearance in a solution. In the case of other experimental groups where an example was present, the ideas repeated from the example are counted as redundant ideas (see Figs. 6, 7). Thus, for those conditions, the quantity of nonredundant ideas is computed as the number of ideas (counting the repeated ideas only once) minus the number of example ideas used. An interrater reliability score (Pearson correlation) of 0.88 is obtained for this metric. This indicates that the measure is reliable (Clark-Carter, Reference Clark-Carter1997).
When designers fixate, they are likely to generate concepts using ideas from the example and ideas from their initial concepts. Thus, the quantity of nonredundant ideas is expected to be low. Hence, the quantity metric indicates the extent of the participant's fixation to both the presented example and his or her initial ideas.
When designers fixate on an example, they tend to unintentionally (or sometimes intentionally) copy ideas from the example. They may combine these example ideas with new ideas to create a solution. In order to measure the extent of this plagiarism, two metrics are employed: the number of times example ideas are used in the participants’ solutions and the percentage of ideas copied from an example. The number of times example ideas are used in a participant's solutions show how rooted the fixation is. If a participant is highly fixated on an example idea or two, that participant is expected to use those ideas as many times in his or her solutions as possible. Thus, counting the number of times that an example's ideas occur in participants’ solutions is an apt way to estimate the extent of fixation. For this metric, an interrater reliability measure of 0.85 (Pearson correlation) is obtained, which shows that the metric is reliable.
In contrast, the percentage of example ideas used shows what fraction of the example influences the participants’ ideas. For example, if a participant who received the gas press example uses six ideas from said example, he or she uses 75% of the example for the idea generation (there are eight ideas in the gas press example; refer to Fig. 6). An interrater agreement of 0.80 is obtained for this metric (Pearson correlation), showing the reliability of said metric.
Number of different energy sources employed by the participants is another measure of fixation. If the participants are fixated to the energy source shown by the example, they are likely to use it very often in their solutions. This reduces the overall number of energy sources that they use and increases the percentage of solutions using the same energy source as the example (gas press example: gas, full belly example: human power). Pearson correlation values of 0.98 for number of energy sources and 0.95 for percentage of human-powered concepts indicate that these measures are reliable.
4. RESULTS AND DISCUSSION
4.1. Quantity of nonredundant ideas
Quantity of nonredundant ideas showed how many unique ideas a participant generated during his or her idea generation activity. Figure 8 shows the mean quantity of nonredundant ideas across all the experimental conditions. The data showed some interesting trends. The participants who received pictorial examples generated a comparatively lower number of nonredundant ideas compared to the control group. This indicates design fixation on the examples provided. The participants who received the full belly example in a working prototype form also fixated to a similar extent; however, a similar fixation was not observed with the group that received the nonfunctional prototype of the gas press.
The variation of mean quantity of nonredundant ideas across the experimental groups. All error bars show ±1 SE.
A one-way analysis of variance (ANOVA; Tabachnick & Fidell, Reference Tabachnick and Fidell2007) was performed to compare the control against the pictorial example conditions statistically. This analysis was performed to confirm if the presence of an example caused a significant reduction in the quantity of nonredundant ideas generated by the participants. The results showed that the reduction caused by the presence of an example was statistically significant (F = 4.11, p = 0.02; a significance level of α = 0.05 was used for the analysis). A priori pairwise comparisons (Tabachnick & Fidell, Reference Tabachnick and Fidell2007) show that both examples caused a reduced quantity of ideas (control vs. gas press example: t = 2.47, p = 0.01; control vs. full belly example: t = 1.72 p = 0.04).
The reduction in the quantity of nonredundant ideas in participants who received an example solution was likely to be caused by the design fixation on said examples. When an example was present, ideas derived from that example were counted as redundant and removed from the calculation of quantity. The results showed that when an example was present, participants copied many example ideas in their solutions, resulting in a reduced quantity of nonredundant ideas. However, between the two examples, there was no statistically significant difference in the quantity of nonredundant ideas, indicating that the type of example, whether gas press or full belly, did not influence the reuse of example ideas.
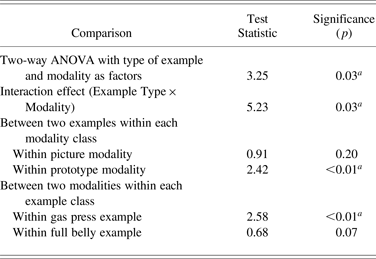
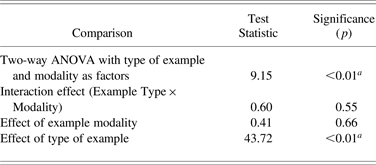
In order to understand the combined effects of familiarity to the example (or the type of example) and the example modality, a two-way ANOVA was performed on the quantity of nonredundant ideas with said factors. Because the control condition did not include an example, that condition was not used in the analysis. The results of the two-way analysis and the a priori tests are shown in Table 1. It was observed that the quantity was affected by an interaction of the type of example (how familiar was the example to the participants) and the modality. In order to interpret the results further, pairwise comparisons were performed within each factor. These results are also shown in Table 1.
Two-way ANOVA results for quantity of nonredundant ideas with example and modality as the two factors
Note: ANOVA, Analysis of variance.
a Shows comparisons that are statistically significant at α = 0.05.
The comparisons within picture modality showed that when the two examples were presented in the form of a sketch, the participants did not produce a significantly different quantity of nonredundant ideas. In other words, the two examples presented in the pictorial form did not cause different extents of fixation. However, when they were presented in the form of a physical prototype, they did produce a different quantity of nonredundant ideas. It was observed that when the gas press example was presented in the form of a nonfunctional prototype, the participants produced ideas in a similar quantity as the group without any examples. It could be interpreted that when participants saw this cumbersome prototype that had many disadvantages in the given conditions, they thought more about alternate ideas and included those in their solutions. In the case of the full belly example, the prototype worked efficiently and shelled peanuts during the demonstration. Because the participants knew that this was a working solution, they copied ideas from that example in their solutions, resulting in a low quantity of nonredundant ideas.
The comparisons between modalities within each example group provided further support to this argument. As shown in Table 1, the quantity of nonredundant ideas did not vary significantly between the picture and prototype modalities of the full belly example. This shows that both modalities caused a similar extent of design fixation. At the same time, the sketch of the gas press example produced a significantly lower quantity of nonredundant ideas compared to the prototype of the same. This showed that the nonfunctional prototype of the gas press provided further insights for the participants regarding the disadvantages of that design, and this helped in mitigating their design fixation to a great extent.
4.2. Reuse of example features in the solutions
In order to understand the frequency of use of the example ideas in a participant's solutions, the number of times that example ideas appear in a participant's solutions was identified and compared across the experimental conditions. Figure 9 shows the mean value of this metric across the experimental conditions. The control bar in each example group shows the mean number of times the ideas from each example are used by the participants who do not see an example (those who were in the control group). These bars are included in the figure as a standard of reference to measure design fixation in the conditions where participants received one of the examples.
Mean number of times example ideas appear in participant solutions. All error bars show ±1 SE.
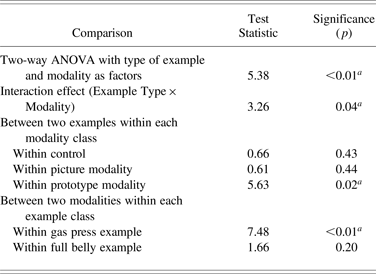
A two-way ANOVA was performed on the data for statistical comparison. The data were not normally distributed but had homogeneous variances. Because ANOVA was robust to one violation of its conditions (Tabachnick & Fidell, Reference Tabachnick and Fidell2007), it was used for the analysis. The results of this analysis are shown in Table 2.
Two-way ANOVA results for the number of times example ideas are used with type of example and modality as the two factors
Note: ANOVA, Analysis of variance.
a Shows comparisons that are statistically significant at α = 0.05.
The results showed that the interaction between the type of example used and the modality of the example significantly influenced the number of times example features were used in participants’ solutions. Further analysis was performed between the conditions that received the two examples within each modality group. The results showed that the metric varied significantly between the examples only when the example was presented as a prototype. This suggested that the participants who explored the nonfunctional prototype of the gas press used the ideas from that example more frequently compared to those who received the full belly prototype. The lack of statistical significance between the two sketched examples suggests that the different types of examples in sketch form cause the same extent of fixation. This comparison was performed to rule out any bias in the data due to the excessive retrieval of a few example ideas from the participants’ memory.
As evident from these results, the participants who received the gas press example in prototype form reused the example ideas more frequently compared to those who received the full belly prototype. Considering that the gas press prototype group also generated a significantly higher quantity of nonredundant ideas, it could be concluded that the gas press prototype fixated the participants more while also prompting them to generate more ideas different from the example. This might be due to the awareness of the drawbacks of the given design, and these drawbacks might be more evident when presented in the form of a nonfunctional prototype.
Within each type of example, the effect of example modality was further investigated. The results, as shown in Table 2, suggested that the example modality had a significant effect within the gas press example, whereas the effect was not statistically significant within the full belly example. A priori comparisons for different modalities within the gas press example suggested that both the pictorial and the prototype example caused significant fixation compared to the control (control vs. pictorial example: t = 2.79, p < 0.01; control vs. prototype: t = 3.76, p < 0.01). The comparison between the pictorial example and the prototype example was not significant statistically (t = 1.28, p = 0.10), indicating that both representations caused design fixation to a similar extent.
4.3. Percentage of example features used by participants
Percentage of example features signified the extent of design fixation on the example provided to the participants. Figure 10 shows the mean percentage of example features used by the participants across various experimental conditions. In this case also, the control group was analyzed separately for the presence of ideas from each example. The control bars in the figure show the percentage of example features from each example in the control group. Because the participants did not see the example, these bars acted as a reference for determining design fixation.
Mean percentage of example features used by the participants in their solutions across the experimental conditions. All error bars show ±1 SE.
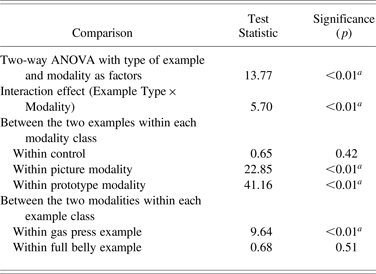
A permutation test (Good, Reference Good2000; Anderson, Reference Anderson2001), which is a nonparametric equivalent of two-way ANOVA, was used to perform the statistical analysis on these data. The data were neither normal nor homogeneous in their variance; hence, the two-way ANOVA would lead to inaccurate results. The results of the permutation test are shown in Table 3. The table also shows the various follow-up tests performed afterward.
Permutation test results for the percentage of example features used with type of example and modality as the two factors
Note: ANOVA, Analysis of variance.
a Shows comparisons that are statistically significant at α = 0.05.
The two-factor analysis showed that the interaction between the type of example and the modality of the example significantly influenced the percentage of example ideas used by the participants. In order to understand these effects further, within-factor analyses were conducted. The results showed that within the pictorial and prototype modalities, the two examples caused design fixation to a different extent. This indicated that when participants saw an example, the number of ideas that the participants copied from that example depended on that specific example.
The statistical comparisons within the two example groups showed that the fixation to the full belly example did not depend on the modality in which the example was conveyed. Otherwise, the full belly sketch and the prototype caused a similar extent of design fixation. However, in the case of the gas press example, the percentage of example features copied depended on the modality of the example. Further a priori comparisons showed that both pictorial and prototype examples caused significant fixation compared to the control (control vs. pictorial: t = 3.35, p < 0.01; control vs. physical: t = 4.62, p < 0.01). While from Figure 10 it appears that the prototype example caused a higher extent of fixation compared to the sketch, this comparison was statistically insignificant (t = 1.36, p = 0.10).
The familiarity of the participants with the ideas involved in the gas press example could be used to explain the differences mentioned above. As stated previously, the gas press example comprised many ideas that can easily be retrieved from memory while solving the peanut sheller problem. The presence of these ideas in the form of the gas press example might make this retrieval comparatively easy. This might be the primary reason for the fixation to a higher percentage of ideas involved in said example compared to the full belly example. While the full belly example was completely functional, it contained many ideas that were uncommon, and the participants might have a limited fixation to some of the ideas involved. Their fixation might be limited to the key ideas that were critical to the final outcome (shelling of peanuts).
4.4. Fixation to energy sources used in the example
The number of energy sources used by the participants was another measure employed to measure design fixation. The mean number of energy sources used in each condition is shown in Figure 11.
Mean number of energy sources used by study participants across the experimental conditions. All error bars show ±1 SE.
In order to understand the differences in the number of energy sources used when an example was provided, compared to the control condition, a one-way ANOVA was employed. The data were not normal but were homogeneous in their variance. ANOVA was robust to the violation of one of its prerequisites; hence, it was employed for the analysis. The results showed that the metric did not vary significantly between the control condition and the conditions where an example was presented as a sketch (F = 1.87, p = 0.17). This indicated that the presence of an example did not affect the use of energy sources significantly.
In order to investigate any effect of interaction between the type of example and modality on the use of energy sources, a two-way ANOVA was conducted on the conditions where an example was present. The results showed that the overall analysis and the effects of interaction as well as the individual factors were not significant statistically (overall ANOVA: F = 1.52, p = 0.22; interaction: F = 0.97, p = 0.33; modality: F = 2.42, p = 0.12; type of example: F = 1.17, p = 0.28).
Mean percentage of the solutions that use the same energy sources as the example was analyzed to investigate the fixation to the example further. Figure 12 shows the distribution of this metric across the experimental conditions. The control bars in the figure show the solutions from the control condition that used the corresponding example energy source.
Mean percentage of solutions using the same energy source as the example. All error bars show ±1 SE.
A two-way permutation test, equivalent to a two-way ANOVA, was used to perform the statistical comparisons. It was observed that the data were not normal and their variance was not homogeneous. This made the results from a traditional two-way ANOVA inaccurate. Because of this reason, the permutation test was employed instead of ANOVA. The results of the permutation test are shown in Table 4.
Two-way permutation test results for the percentage solutions using the same energy sources as the example with type of example and modality as the two factors
Note: ANOVA, Analysis of variance.
a Shows comparisons that are statistically significant at α = 0.05.
As evident from Table 4, only the type of example affected the percentage of solutions that use the same energy source as the example. Participants who received the gas press example fixated to the use of gas as an energy source to some extent; however, their fixation was lower compared to the fixation of those who received the full belly example to human energy as the source. However, the control group also produced solutions with a similar percentage of solutions using the same energy source as the example, indicating that this metric might not show the actual fixation. After reading the problem statement, the participants might perceive human energy as the most feasible energy source for the given environment, and they might use the same in their solutions regardless of the presence of an example. The use of a gas press was complex for the given situations, making it a less popular choice for the participants.
5. GENERAL DISCUSSION
In general, the results support the example familiarity hypothesis. The gas press example consists of several ideas that are very familiar to the participants. The full belly example contains several ideas that work together to produce a successful solution, but a majority of those ideas are not as common as the gas press example. The two metrics that identify the fixation to ideas included in the example (the number of times example ideas are reused and the percentage of example ideas used by the participants) suggest that participants unintentionally copy more ideas from the gas press example. They also use those ideas more frequently in their solutions. These results suggest that when designers visualize a familiar design feature in the form of an example, it triggers a strong design fixation on that feature. Less familiar features also trigger fixation; however, the extent of fixation is found to be lower.
The results do not completely support the example modality hypothesis. It is observed that the influence of example modality on the extent of fixation also depends on the specific example being used. For the full belly prototype, the modality of the example does not make a statistically significant difference on design fixation. At the same time, in the gas press example, the prototype causes greater fixation compared to the design sketch. Considering that the gas press example contains more familiar ideas, this result may be an interaction effect of example modality and example familiarity.
While the evidence suggests that an example in either sketch or prototype form leads to fixation on the features of said example, the solutions generated by the participants who saw the prototype examples show some interesting trends. The gas press prototype leads the participants to a higher quantity of nonredundant ideas. However, the same group used the example ideas at a significantly higher frequency compared to the other experimental groups. This indicates that while the nonfunctional prototype fixates the participants more, it also prompts them to think about alternate ideas. In this case, the prototype highlights the drawbacks of the design, such as infeasibility in the given environments, complicated design, and the damage to the peanuts. This may cause the participants to think beyond the default ideas (the ideas derived from the example) that come to their mind. These results are also consistent with several other prior studies (Purcell & Gero, Reference Purcell and Gero1992, Reference Purcell and Gero1996; Cardoso, et al., Reference Cardoso, Badke-Schaub and Luz2009; Moreno et al., Reference Moreno, Yang, Hernández, Linsey and Wood2015). This also suggests that a prototype can convey additional information regarding a design compared to a sketch of the same. While all the same ideas are present in the design sketch, it does not prompt critical thinking in designers.
Note that the gas press example, made up of familiar ideas, was a nonfunctional example. The participants were specifically told about the infeasibility of said design. The participants who used the full belly example were aware of the feasibility of that example as well. While no explicit analysis was performed on the feasibility of the example as a key factor in fixation, it can be noted that the knowledge about the infeasibility of the gas press example did not prevent participants from copying the features from that example. As indicated by Figure 10, the participants used more example solutions from the gas press example compared to the full belly one. This choice of participants is interesting and needs further exploration in future studies. The inclusion of feasibility as a factor in the experiment design was unintentional, and the available experimental conditions were insufficient to derive any conclusions regarding the effect of said factor.
In a practical design scenario, the example solutions for a design problem may come from the designer's immediate surroundings or prior experiences. Considering most of the systems that we encounter around us are three-dimensional in nature, the fixation on an example prototype is interesting. The results suggest that when a person encounters a three-dimensional system that fails to operate in the expected way, he or she may think critically about it. This may result in the generation of ideas that can solve the errors with said system. This kind of critical thinking is crucial in engineering education. The students in engineering courses need to visualize various concepts through prototypes and solving problems associated with prototypes. When a prototype fails, students need to investigate such failures with a critical mind-set. This type of critical inquiry mind-set can help them in becoming better engineers and designers.
6. CONCLUSIONS
The primary aim of this study was to understand how the familiarity with an example and the modality with which it was conveyed to a designer affects the designers’ fixation on said example. The controlled experiment described in this paper used a multicondition idea-generation activity to gain insights regarding this issue. In all the experimental conditions, the participants were instructed to generate as many solutions as possible for a realistic design problem. The example they received and the modality of the same depended on the specific experimental condition they were in. The design problem instructed them to devise a method to shell peanuts quickly without damaging them. There were two examples employed in this study: a gas press example, which consisted of several familiar design features, and a full belly example, with less familiar features. Depending on the experimental condition, either a picture or a prototype was used to convey the example design. The results showed that both these factors affect the extent of design fixation on an example given to the designers. Designers were found to be fixating more on an example that consisted of more familiar features, whereas the effect of modality depended also on the specific example. When the example solution was a feasible one, both the picture and the prototype fixated designers to a similar extent. When the example design contained flaws, the prototype prompted the designers to generate more ideas to overcome said flaws. Even in this case, the prototype of the example fixated the designers, but they also generated several new ideas. These results indicate the advantage of using three-dimensional representations for idea communication and evaluation. The prototypes can help designers in further evaluation of their designs and may help them even in the generation of better designs.
ACKNOWLEDGMENTS
Partial support for this work was provided by the National Science Foundation Awards CMMI-1234859 and CMMI-1304383. Any opinions, findings, and conclusions or recommendations expressed in this material are those of the authors and do not necessarily reflect the views of the National Science Foundation.
Vimal Viswanathan is an Assistant Professor of mechanical engineering at Tuskegee University. He earned his PhD in mechanical engineering from Texas A&M University with a focus on engineering design creativity. His research interests include design creativity, innovation, idea generation, and engineering education. He has published several previous articles on various factors influencing design fixation. He has coauthored 10 journal articles, one book chapter, and over 25 refereed conference articles.
Megan Tomko is a PhD student in the George W. Woodruff School of Mechanical Engineering at Georgia Institute of Technology. She is performing her research under the supervision of Dr. Julie Linsey with a focus on engineering design creativity. She earned her Bachelor's degree in mechanical engineering from the University of Pittsburgh in 2014.
Julie Linsey is an Associate Professor in the George W. Woodruff School of Mechanical Engineering at Georgia Institute of Technology. She earned her PhD in mechanical engineering from the University of Texas at Austin. Before joining Georgia Tech, she worked as an Assistant Professor of mechanical engineering at Texas A&M University. Her research interests include engineering design creativity, design theory and methodology, and engineering education. She has published several journal articles, conference papers, and book chapters in these areas.