I. INTRODUCTION
As one member of the lead-free ferroelectric systems, the family of tungsten bronze (TB) compounds has a chemical formula of (A1)4(A2)2(C)4(B)10O30. In the formula, A1, A2, B and C sites are 15-, 12-, 6- and 9-fold coordinated oxygen octahedral sites in the crystal lattice structure respectively, where A1 and A2 sites can be occupied by Sr2+, Ba2+, Ca2+, Pb2+, K+, Na+ and some rare earth cations, B sites by either Nb5+ or Ta5+, C sites by Li+ and other small cations. The smallest C sites are usually empty, then the formula (A1)4(A2)2(B)10O30 or (A1)2(A2)1(B)5O15 is for the filled tungsten bronze (TB) structure. TB solid solutions can be obtained with either tetragonal symmetry in the ferroelectric phase or orthorhombic symmetry in both ferroelectric and ferroelastic phases. The polar unit of TB compounds is the Nb2O6 octahedron, and the polar axis is parallel to the c-axis. Ferroelectricity in these compounds arises from the interaction between Nb atoms and the oxygen framework in the polar unit. Recently, the TB compounds have received considerable attention owing to their superior electro-optic, piezoelectric, ferroelectric, and pyroelectric properties.Reference Kakimoto, Yoshifuji and Ohsato1–Reference Fang and Chiu5
Within the TB family, Neurgaonkar et al.Reference Neurgaonkar, Oliver, Copy, Cross and Viehland6 have systematically investigated the TB ferroelectric single crystals and considered Sr2-xCaxNaNb5O15 (SCNN, 0.05≦ x ≦0.35) to be potential lead-free piezoelectric materials, in which a large piezoelectric constant (d 33 = 270 pC/N) could be obtained at x = 0.10. They also found that the structure of SCNN crystal slightly distorted from the tetragonal phase and became orthorhombic phase at room temperature. However, applications of single crystals with excellent electric properties are limited due to their high cost and difficulty in fabrication. On the contrary, ceramics can be made into larger and more complex components at lower cost. For the ceramics with TB structure, abnormal grain growth along with crack generation is frequently encountered when using the conventional sintering method, leading to low density and deterioration of properties.Reference Kimura, Miyamoto and Yamaguchi7–Reference Wei, Yang, Chang and Gu9 To obtain high-performance SCNN ceramics without abnormal grain growth, Xie et al.Reference Xie and Akimune10–Reference Xie, Akimune, Wang and Hirosaki12 used the spark plasma sintering method to prepare densitified SCNN ceramics, and found that the SCNN ceramics showed optimized properties at x = 0.15. In addition, the phase transition did not occur in SCNN ceramics at room temperature according to Xie et al. This result is different from that of SCNN single crystals.
According to our previous work,Reference Wei, Yang, Gu and Ren4, Reference Wei, Yang, Ren and Chen13, Reference Wei, Yang, Gu and Pan14 although with traditional sintering process, it was hard to obtain densitified ceramics with TB structure as mentioned above, the two-step solid-state reaction method and traditional sintering process were used successfully to obtain Sr2NaNb5O15-based ceramics with TB structure with careful control of the process parameters. Then, to give a better understanding of the structures and electrical properties of SCNN ceramics, the two-step solid-state reaction method and traditional sintering process were also used to synthesize the SCNN ceramics in this work. As the proper amount substitution of calcium for strontium in A sites could improve the electrical properties, it is essential to further study the relation between the structures and the related properties of SCNN ceramics. Thereafter the effects of calcium content on the phase structure, microstructure, dielectric, ferroelectric, and piezoelectric properties of SCNN ceramics were studied systematically in this work.
II. EXPERIMENTAL PROCEDURE
A. Sample preparation
The Sr2-xCaxNaNb5O15 (SCNN, x = 0.05, 0.15, 0.20, 0.25, and 0.30) particles were fabricated by the two-step solid-state reaction method.Reference Wei, Yang, Gu and Ren4 NaNbO3, SrNb2O6 and CaNb2O6 were prepared firstly, and then the Sr2-xCaxNaNb5O15 phase was obtained from NaNbO3, SrNb2O6 and CaNb2O6 solid solution. NaNbO3 was prepared by the solid-state reaction between Na2CO3 (99.8%) and Nb2O5 (99.5%) at 800 °C for 3 h SrNb2O6 was prepared by ball-milling SrCO3 (99%) and Nb2O5 (99.5%) for 12 h in ethanol using zirconia balls. The mixed powders were dried and calcined at 1100 °C for 4 h. Using the same procedure, Nb2O5 (99.5%) and CaCO3 (99.9%) were used as oxide source to obtain CaNb2O6. They were mixed by ball-milling in ethanol for 12 h using zirconia balls. Then the mixed powders were dried at 80 °C and calcined at 1000 °C for 4 h in air. X-ray diffraction (XRD) results showed that NaNbO3, SrNb2O6 and CaNb2O6 were all single phases. The reaction equations are as follows:



Then the obtained NaNbO3, SrNb2O6 and CaNb2O6 powders were weighted in stoichiometric mole ratio to prepare Sr2-xCaxNaNb5O15 particles. They were mixed in ethanol with zirconia balls by ballmilling for 12 h. After being dried, the powders were calcined at 1160–1200 °C for 6 h. The synthesized Sr2-xCaxNaNb5O15 particles were mixed with 5 wt% polyvinyl alcohol (PVA) solution and then pressed into pellets with a diameter of 1.5 cm under 400 MPa pressure. After burning out PVA at 500 °C, the green samples were respectively sintered in air at selected temperatures for 4 h, depending on their x value, in the range between 1300 °C and 1340 °C.
B. Characterization
The phase structure of ceramics was measured by XRD (XRD, D/max-2200, Rigaku, Tokyo, Japan) with Cu kα radiation (step: 0.02°). The lattice parameters were refined by the least square method. The microstructure of the sintered ceramics was observed by scanning electron microscopy (SEM, Model Quanta 200, FEI Company, Eindhoven, the Netherlands).
Silver electrodes were formed on both surfaces of each sintered disk by firing at 850 °C for 30 min. The specimens were poled in silicone oil at 80 °C under 30 kv/cm for 20 min. Dielectric properties of the ceramics were obtained using an LCR m (TH2816, China) by measuring capacitance C and dielectric loss tan δ at 1 kHz. The polarization-versus-electric hysteresis (P-E) loops were observed by a Radiant Precision Workstation (Albuquerque, NM, USA). The piezoelectric constant d 33 was measured by a quasistatic, piezoelectric d 33 meter (Model ZJ-3d, Institute of Acoustics Academic Sinica, China).
III. RESULTS AND DISCUSSIONS
A. Phase structure analysis of Sr2-xCaxNaNb5O15
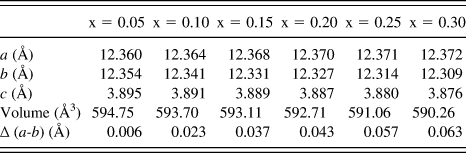
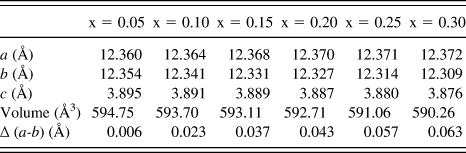
Figure 1(a) shows the XRD patterns of the Sr2-xCaxNaNb5O15 ceramics with different Ca2+ contents. All ceramics are of single TB structure and no second phase could be detected, indicating that Ca2+ may diffuse into the TB structure lattice to form a solid solution, in which Ca2+ occupies A sites in the TB structure. Figure 1(b) is the magnification of Fig. 1(a) in the range from 45 to 48°. Two peaks split at about 47° are (620) and (002) peaks, respectively. When x = 0.05, the intensity of (620) peak is slightly higher than that of (002) peak. With increasing x, the intensity of (002) peak enhances gradually and then exceeds the (620) peak at x = 0.30, suggesting that some distortion of crystal structure appears when substituting Sr2+ with Ca2+. Annie SimonReference Simon and Ravez15 states that for TB structure crystals, there is a permanent anisotropy, even in centrosymmetric phases, it is not thus possible to reach the cubic symmetry, and the TB structure crystals usually have tetragonal symmetry or orthorhombic symmetry. To further study the structure distortion caused by Ca2+ substitution, the lattice parameters of Sr2-xCaxNaNb5O15 ceramics with different Ca2+ contents are calculated and shown in Table I. As shown in Table I, when x = 0.05, a = 12.360 Å, b = 12.354 Å and c = 3.895 Å. The difference between a and b is so negligible that the ceramics with x = 0.05 are considered to be tetragonal phase. With increasing x from 0.05 to 0.30, the value of ▵ (a-b) gradually increases from 0.006 to 0.063, indicating that the crystal structure slightly distorts from the tetragonal phase and becomes the orthorhombic phase at room temperature. This is in good agreement with the SCNN single crystals reported by Neurgaonkar et al.Reference Neurgaonkar, Oliver, Copy, Cross and Viehland6 In addition, the lattice parameter c and the lattice unit volume V decrease monotonically with increasing the Ca2+ content. The decrease of the tetragonality and the distortion of the crystal structure are all induced by substituting Sr2+ with Ca2+. The shrinkage of the unit cell can be attributed to the smaller ionic radius of Ca2+ (1.34Å) compared with that of Sr2+ (1.44Å).
XRD patterns of Sr2-xCaxNaNb5O15 ceramics with different x. (x = 0.05, 0.15, 0.20, 0.25, and 0.30).

The lattice parameters of obtained Sr2-xCaxNaNb5O15 ceramics as a function of x.
B. Microstructure analysis of Sr2-xCaxNaNb5O15
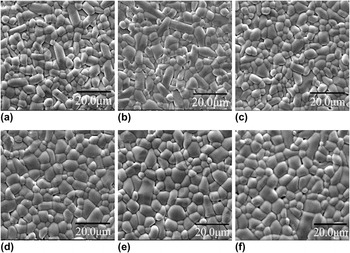
Figure 2 shows SEM photographs of the surface of the Sr2-xCaxNaNb5O15 ceramics with different Ca2+ contents. All ceramics show a common microstructure that is relatively dense and uniform. With increasing x from 0.05 to 0.15, the morphology becomes more homogeneous, and the number of grains with anisotropic shape decreases, leading to decrease in the average grain size. Fine-grained and relatively uniform microstructure is obtained at x = 0.15, which is very beneficial to the practical application as it is known that the fine-grained and homogenous microstructure can lead to high mechanical strength for the piezoelectric ceramics. With further increase of x to 0.25 and 0.30, the average grain size then increases slightly. The microstructure results are not consistent with those of SCNN ceramics reported by Xie et al.,Reference Xie and Akimune10–Reference Xie, Akimune, Wang and Hirosaki12 in which Ca2+ substitution had no appreciable influence on the microstructure of Sr2-xCaxNaNb5O15 ceramics prepared by the spark plasma sintering method. In addition, abnormal grain growth (>50 μm), which are frequently encountered in the sintering of TB compounds ceramics,Reference Kimura, Miyamoto and Yamaguchi7–Reference Wei, Yang, Chang and Gu9 is not observed in any of the specimens, indicating that through careful control of the preparation process, the two-step solid-state reaction method and traditional sintering process are also effective in obtaining the Sr2-xCaxNaNb5O15 ceramics without abnormal grain growth and cracks. The above results show that proper amount of Ca2+ substitution is beneficial in suppressing the grain growth and avoiding the abnormal grain growth behavior.
Scanning electron microscopy photographs of the surface of Sr2-xCaxNaNb5O15 ceramics with different x: (a) x = 0.05, (b) x = 0.10, (c) x = 0.15, (d) x = 0.20, (e) x = 0.25, and (f) x = 0.30.

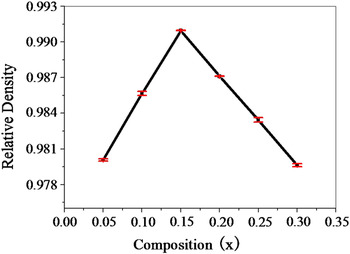
Figure 3 shows the relative density of the Sr2-xCaxNaNb5O15 ceramics with different values of x. The relative density is calculated based on the theoretical density for each individual composition, which is calculated from the unit cell volumes according to XRD results (5.027∼4.999 g/cm3). It can be seen from Fig. 3 that for all compositions, the relative density of the obtained ceramics is higher than 0.970, indicating that the two-step solid-state reaction method and traditional sintering process can also be used to obtain high-density Sr2-xCaxNaNb5O15 ceramics with TB structure. In addition, with increasing x, the relative density increases gradually, reaches the maximum value of about 0.991 at x = 0.15, and then decreases. The variation of relative density in Fig. 3 is consistent with the SEM result in Fig. 2. The differences between the microstructural and stoichiometric findings/ characterizations are likely to have substantial influence on the electrical properties. Details of dielectric properties are discussed in the following sections.
Relative density of the Sr2-xCaxNaNb5O15 ceramics with different x.

C. Dielectric properties of Sr2-xCaxNaNb5O15 ceramics
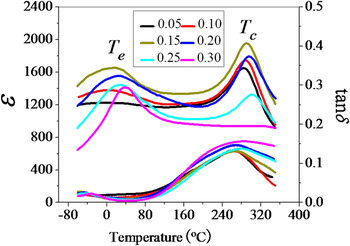
The temperature dependence of dielectric constant ε and dielectric loss tan δ for the ceramics with different Ca2+ contents measured from −60 to 350 °C at 1 kHz is shown in Fig. 4. It can be seen that for the ceramics with x ≤ 0.25, two obvious dielectric peaks can be observed, corresponding to the ferroelastic orthorhombic (mm2) to ferroelectric tetragonal (4 mm) phase transition at lower temperatures and the ferroelectric tetragonal (4 mm) to tetragonal paraelectric (4/mmm) phase transition at higher temperatures, respectively. The temperatures at which the two-phase transitions occur are abbreviated as Te and Tc, respectively. Te corresponds to the ferroelastic orthorhombic (mm2) to ferroelectric tetragonal (4 mm) phase transition temperature, and Tc corresponds to the ferroelectric tetragonal (4 mm) to tetragonal paraelectric (4/mmm) phase transition temperature. For the ceramics with x = 0.30, the dielectric peak related to the ferroelectric tetragonal (4 mm) to tetragonal paraelectric (4/mmm) phase transition becomes indistinct. The results are in good agreement with the literature.Reference Xie and Akimune10 For each composition, the temperature dependence of dielectric loss tan δ curve shows similar shape with that of dielectric constant ε. There are also two tan δ peaks observed for all compositions, and the tan δ peaks around Tc are more obvious than the tan δ peaks below 0 °C.
Temperature dependence of dielectric constant ε and dielectric loss tan δ for Sr2-xCaxNaNb5O15 ceramics measured at 1 kHz as a function of x.

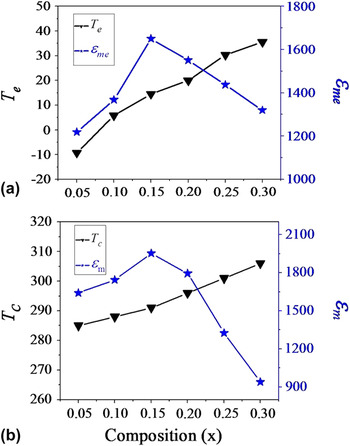
εme and εm are the maximum values of the dielectric constant obtained at Te and Tc, respectively. Te, εme, Tc and εm of the ceramics measured at 1 kHz as a function of x are presented in Fig. 5. They all have great dependence on x. By increasing x, Te increases gradually from −10 to 36 °C. Te is −10 °C for the ceramics with x = 0.05, so the ceramics are tetragonal phase (4 mm) at room temperature. For the ceramics with x = 0.15, Te is about 15 °C, which is near the room temperature, indicating that the ceramics are mixed tetragonal and orthorhombic structures. Further increasing x to 0.30, Te increases to about 36 °C, which is above room temperature, so the ceramics are orthorhombic phase (mm2) at room temperature. Therefore it is reasonable that the tetragonality of the Sr2-xCaxNaNb5O15 decreases while the orthorhombicity increases when substituting Sr2+ with Ca2+. And the results are in good agreement with those of Fig. 1 and Table I. Tc also shifts to higher temperature regions gradually with increasing x. T c is 285 °C at x = 0.05 and increases to 306 °C at x = 0.30. The above results show that Ca2+ substitution is beneficial to the crystal structure stability, enabling attainment of higher phase transition temperatures. In addition, εme and εm show similar trend with increasing x. They all increase at first and then decrease as x increases from 0.05 to 0.30. The maximum values of εme and εm are obtained at x = 0.15 (ε me = 1650, ε m = 1954).
Te ,εme, Tc and εm of the Sr2-xCaxNaNb5O15 ceramics measured at 1 kHz as a function of x.

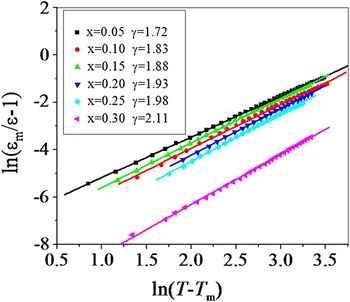
The diffuseness of the phase transition can also be explained by the modified Curie-Weiss law: 1/ε-1/ε m = (T-Tm)γ/C, where ε m is the maximum value of the dielectric constant at the phase transition temperature. γ and C are assumed to be constant. γ is the degree of diffuseness, and C is the Curie-like constant. The degree of diffuseness γ can have a value ranging from 1 for a normal ferroelectric to 2 for an ideal relaxor ferroelectric. The plots of ln [(ε m/ε)-1] versus ln (T-T m) for the Sr2-xCaxNaNb5O15 ceramics (x = 0.05, 0.10, 0.15, 0.20, 0.25, and 0.30) at 1 kHz are shown in Fig. 6. A linear relationship is observed in all specimens. The slope of the fitting curves is used to determine the γ value. It can be seen that the γ value is between 1 and 2 for the compositions with x < 0.25, which indicates that the ceramics with x < 0.25 show intermediate relaxor-like behavior between normal and ideal relaxor ferroelectrics. When x = 0.30, the γ value is 2.11, which is higher than 2, indicating that the ceramics with 0.30 are not ferroelectrics.
Ln [(ε m/ε)-1] as a function of Ln (T-T m) for the Sr2-xCaxNaNb5O15 ceramics with different Ca2+ contents.

D. Ferroelectric and piezoelectric properties of Sr2-xCaxNaNb5O15 ceramics
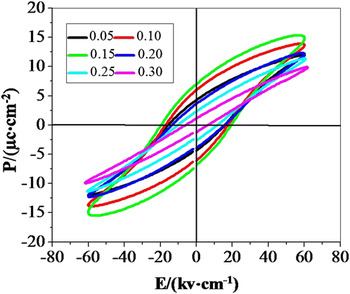
Figure 7 shows the P-E hysteresis loops of all the compositions measured under the same maximum drive voltage of 60 kv·cm−1. According to Fig. 7, the P-E hysteresis loops become much saturated at first and then become slimmer with increasing x from 0.05 to 0.30. Figure 8 illustrates the Pr, Ec (measured under the maximum drive voltage of 60 kv·cm−1) and piezoelectric constant d 33 (poled in silicone oil at 80 °C under 30 kv·cm−1) of the ceramics as a function of x. Pr, Ec and d 33 all increase at first and then decrease with increasing Ca2+ substitution level. The ceramics with x = 0.15 possess the largest Pr (7.08 μC cm-2) and d 33 (68 pC N-1).
P–E hysteresis loops of the Sr2-xCaxNaNb5O15 ceramics with different Ca2+ contents measured under the maximum drive voltage of 50 kv·cm−1 and at room temperature.

Pr, Ec and d 33 of the Sr2-xCaxNaNb5O15 ceramics as a function of x.

According to above results, the ceramics with best properties can be obtained at x = 0.15, which is in concordance with the result of SCNN ceramics prepared by the spark plasma sintering method,Reference Xie and Akimune10–Reference Xie, Akimune, Wang and Hirosaki12 but different with the results of SCNN single crystals.Reference Neurgaonkar, Oliver, Copy, Cross and Viehland6 This is reasonable because the purity of raw materials is higher when fabricating the single crystals. In addition, except d 33, the electrical properties of the obtained ceramics with x = 0.15 (Tc = 285 °C, εm = 1954, and Pr = 7.08 μC cm-2) are equivalent or higher than those of the ceramics prepared by the spark plasma sintering method (Tc = 286 °C, εm = 1099, and Pr = 3.0 μC cm-2). This can be attributed to the changes of crystal structure, and the most homogeneous and densitified microstructure of the ceramics with x = 0.15. When further increasing the Ca2+ substitution, the ferroelectric tetragonality of the Sr2-xCaxNaNb5O15 decreases while the ferroelastic orthorhombicity increases, leading to the deteriorating of the electrical properties.
IV. CONCLUSIONS
TB structure Sr2-xCaxNaNb5O15 ceramics were prepared by two-step solid-state reaction method in this work. The phase structure, microstructure, and electrical properties of the Sr2-xCaxNaNb5O15 ceramics as a function of Ca2+ content were investigated. Pure TB structure and fine-grained microstructure could be obtained in all ceramics. The lattice constant calculation indicated the crystal structure of Sr2-xCaxNaNb5O15 ceramics slightly distorted from the tetragonal phase and became orthorhombic phase at room temperature with increasing Ca2+ substitution. The smaller ionic radius of Ca2+ (1.34 Å) compared to that of Sr2+ (1.44 Å) also led to the shrinkage of the crystal structure. Dielectric spectra of all compositions displayed two-phase transitions: the ferroelastic orthorhombic to ferroelectric tetragonal phase transition (Te) at lower temperatures, and the ferroelectric to paraelectric phase transition (Tc) at higher temperatures. Dielectric, ferroelectric and piezoelectric properties of the Sr2-xCaxNaNb5O15 ceramics greatly depended on the Ca2+ content. The optimized electrical properties could be obtained at x = 0.15, which can be attributed to the most homogeneous microstructure, the highest density, and the changes in the crystal structure caused by Ca2+ substitution.
ACKNOWLEDGMENTS
This work was supported by National Science Foundation of China (NSFC) (Grant No. 20771070), the Fundamental Research Funds for the Central Universities (Program No. 2010ZYGX011), and Natural Science Research Program of Shaanxi Province (Grant No. 2009JZ003).