Introduction
It has been noted that each Plasmodium sporozoite could produce thousands of new parasites after development in a hepatocyte, merozoite release and subsequent invasion of erythrocytes, resulting in high demand of phosphatidylcholine (PC) for supporting the proliferation of parasitophorous vacuole membrane (Itoe et al., Reference Itoe, Sampaio, Cabal, Real, Zuzarte-Luis, March, Bhatia, Frischknecht, Thiele, Shevchenko and Mota2014; Contet et al., Reference Contet, Pihan, Lavigne, Wengelnik, Maheshwari, Vial, Douguet and Cerdan2015). Most PC is de novo synthesized by the Kennedy pathway using choline as a raw material, in which choline phosphate cytidyltransferase is the rate-limiting enzyme (Gibellini and Smith, Reference Gibellini and Smith2010). Thus, inhibition of the PC biosynthetic pathways can significantly reduce the parasitaemia percentage and become a potential and attractive target for antimalarial chemotherapy (Mamoun et al., Reference Mamoun, Prigge and Vial2010; Wein et al., Reference Wein, Maynadier, Bordat, Perez, Maheshwari, Bette-Bobillo, Tran Van Ba, Penarete-Vargas, Fraisse, Cerdan and Vial2012; Contet et al., Reference Contet, Pihan, Lavigne, Wengelnik, Maheshwari, Vial, Douguet and Cerdan2015). Some choline derivatives (CDs) showed potent antimalarial activities (Peyrottes et al., Reference Peyrottes, Caldarelli, Wein, Périgaud, Pellet and Vial2012).
Based on the above ideas, we designed and synthesized artelinic acid-choline derivative (AD), which contains not only the endoperoxide functional group of artemisinins, but also CD (an analogue of choline, designed to compete with choline in PC biosynthetic pathways). In order to avoid the possible toxic effects of CDs, AD were formulated to liposomes (ADLs) by thin-film hydration method (Varona et al., Reference Varona, Martín and Cocero2011; Zhang, Reference Zhang2017). It was anticipated that the dual antimalarial mechanism and nanoliposome preparation could gain superior antimalarial activity and simultaneously reduce possible side-effects. Pharmacodynamics in PyBY265 mice and pharmacokinetic in rats of ADLs were evaluated in this study.
Materials and methods
Materials
Dihydroartemisinin was obtained from the Chongqing Holley Wuling Mountain Pharmaceutical Co. (Chongqing, China). Soya lecithin was provided by Shanghai Advanced Vehicle Technology Pharmaceutical Ltd. (Shanghai, China). All other reagents were analytical reagent grades.
Source of test strains and experimental animals
The PyBY265 were presented by Dr Manyuan Wang (department of traditional Chinese medicine, Capital Medical University, Beijing, China). Imprinting Control Region mice (ICR mice, age 6–8 weeks, weight 18–22 g) and Sprague–Dawley rats (SD rats, age 6–8 weeks, weight 180–220 g) were obtained from the animal laboratory of Shanxi Medical University (Taiyuan, China).
Synthesis of artelinic acid-choline derivative
Dihydroartemisinin was used as raw material to synthesize artelinic acid (AA) through dehydration condensation and hydrolysis reaction. AD was synthesized by esterification between AA and CD (Jung et al., Reference Jung, Lee, Kendrick, Robinson and Croft2002; Yang et al., Reference Yang, Wang, Zhou, Zuo and Li2006; Gowrisankar et al., Reference Gowrisankar, Sergeev, Anbarasan, Spannenberg, Neumann and Beller2011; Cloete et al., Reference Cloete, Breytenbach, Kock, Smith, Breytenbach and N'da2012). Detailed synthesis routes and chemical structure were obtained in Fig. S1, respectively.
Preparation and characterization of artelinic acid-choline derivative liposomes
ADLs were prepared by thin-film hydration method. The encapsulation efficiency (EE), drug loading efficiency (DL), particle size (size), zeta potential (zeta), polydispersity index (PDI) and transmission electron microscopy (TEM) were used as the indices to evaluate the characterization of ADLs.
In vitro drug release
Drug release study was performed using the dialysis method. The 500 µL of ADLs was added into a 12–14 kDa molecular weight cut-off dialysis bag and kept in 30 mL of water at 100 r min−1 and 37 °C. At the predesignated time, aliquot samples were sucked out and replaced by an equal volume of fresh release media. The concentration of AD was determined by the reversed phase high-performance liquid chromatography (LC-2030, Shimadzu, Japan) with a column of HC-C8 (250 mm × 4.6 mm, 5 µm, Agilent, USA) at the detection wavelength of 240 nm. The mobile phase was acetonitrile and 10 mmol L−1 ammonium acetate (90:10, V/V). The flow rate was set at 1.0 mL min−1, and the column temperature was set at 40 °C.
In vivo antimalarial efficacy test
Parasite inoculation
ICR mice with parasitaemia percentage of 50–60% were used as donors. Blood samples were collected by the orbital plexus and put into heparinized tubes, then diluted it with physiological saline to gain an inoculum containing 5 × 10⁷ infected erythrocytes per millilitre. Each mouse was intraperitoneally injected with 0.2 mL of inoculum blood.
Formulation used
All formulations of liposomes, including ADLs, DHALs, artelinic acid liposomes (AALs), choline derivative liposomes (CDLs) and blank liposomes were prepared by thin-film hydration method, and AALs + CDLs isomolar mixture was an equimolar mixture of AALs and CDLs.
Grouping and dosing of animals
For the antimalarial activity studies, infected mice were randomly assigned to six groups. DHALs group and blank liposomes group were served as positive control and negative control, respectively. The treatment groups were administrated with the prepared formulations (ADLs, AALs, AALs + CDLs isomolar mixture or CDLs) through intravenous injection for 4 consecutive days.
For the intravenous injection, acute toxicity studies of ADLs, 20 male ICR mice (weight 18–22 g) were randomly divided into two groups (ten mice per group), which were treated with ADLs at the doses of 70.4 and 140.8 µmol kg−1, respectively.
The standard 4-day suppression test
The suppression percentage of ADLs, DHALs, AALs, AALs + CDLs isomolar mixture and CDLs against PyBY265 were assessed by Peters 4-day suppression test (Sarkar et al., Reference Sarkar, Siddiqui, Saha, De, Mazumder, Banerjee, Iqbal, Nag, Adhikari and Bandyopadhyay2016). On the first day (D1), ICR mice were inoculated intraperitoneally with 0.2 mL inoculum. At 2 h after inoculation, the mice in treatment groups were intravenously treated with ADLs, DHALs, AALs, AALs + CDLs isomolar mixture or CDLs, respectively, at five different doses [4.4, 8.8, 17.6, 35.2, 70.4 µmol (kg·d)−1, and six mice per dose for each treatment group] for 4 consecutive days (D1 to D4). The negative control group was treated with isometric blank liposomes intravenously for 4 days. At 24 h after the last treatment (D5), a thin smear was obtained from the tail vein blood of each mouse and dyed with Giemsa stain to measure parasitaemia percentage (by counting the number of Plasmodium-infected erythrocytes per 1000 erythrocytes in random fields). The mean suppression percentage was obtained using the average value of the parasitaemia percentage observed from an individual mouse. The 4-day suppression test was conducted twice.
The suppression percentage (D5), negative conversion fraction (D5) and recrudescence fraction (D6–D32) in each group were used as indices of antimalarial efficacy, which were all calculated as follows:
 $${\rm Suppression}\;{\rm percentage}\,{\rm (\%\ )} = \left( {{\rm 1}-\displaystyle{A \over B}} \right) \times 100\% $$
 $${\rm Negative}\;{\rm conversion}\;{\rm fraction}\,{\rm (\%\ )} = \displaystyle{{C\;} \over D} \times 100\% $$
 $${\rm Recrudescence}\;{\rm fraction}\,{\rm (\%\ )} = \displaystyle{E \over C} \times 100\% $$
where A was the mean parasitaemia percentage in the various treatment groups on D5, B was the mean parasitaemia percentage in the negative control group on D5, C was the mice that had not been detected for parasitaemia on D5 in the group, D was the total number of alive mice in the group, E was the mice that had not been detected for parasitaemia on D5, but parasitaemia detected again within D6–D32.
Preliminary in vivo acute toxicity test
The preliminary acute toxicities of ADLs intravenous injection were investigated at the doses of 70.4 and 140.8 µmol kg−1. The signs of overt toxicity such as the gross body changes, messy hair, convulsions, diarrhoea and mortality were observed for 14 days.
Pharmacokinetic study
The SD male rats (weight 180–220 g) fasted for 12 h before drug administration and for a further 3 h after dosing. Water was freely available for rats during experiments. Rats were randomly divided into four groups (n = 6 per group), and injected with ADLs, AD solution (AD-SOL), AALs or artelinic acid solution (AA-SOL) (all were treated at 22.2 µmol kg−1) via tail vein, respectively. At predesignated time, blood samples of 300 µL were withdrawn from one jugular vein and put into heparinized tubes followed by centrifugation at 3500 r min−1 (1200 g) for 10 min. The plasma samples were stored at −80 °C until analysis for 1 month. The concentration of AD and AA in plasma was determined by high-performance liquid chromatography tandem mass spectrometry method (HPLC-MS/MS).
The main pharmacokinetic parameters such as area under concentration-time curve (AUC), mean residence time (MRT), clearance (CL) and apparent volume of distribution (V) were estimated by the non-compartmental model based on statistical moment analysis. AUC, a measurement reflecting the total amount of active drug that reaches the systemic circulation, also termed as area under plasma time vs concentration curve from t = 0 to infinity, was calculated by means of the linear trapezoidal method. AUMC is the area under the first moment of the plasma concentration-time curve. MRT, a parameter describing the average time for all the drug molecules to reside in the body, was calculated by equation as followed. CL is commonly used to describe drug elimination from the body. V is the apparent space or volume drug distributes into. MRT, CL, V, AUC and AUMC were calculated by following equations:
 $$\eqalign{{\rm AUC} = &\sum\limits_{i = 1}^n {\displaystyle{{C_i + C_{i + 1}} \over 2}} \Delta t + \displaystyle{{C_n} \over {\lambda _Z}} \cr {\rm AUMC} = &\sum\limits_{i = 1}^n {\displaystyle{{t_iC_i + t_{i + 1}C_{i + 1}} \over 2}} \Delta t + \displaystyle{{t_nC_n} \over {\lambda _Z}} + \displaystyle{{C_n} \over {\lambda _{_Z} ^2}} \cr {\rm MRT} = &\displaystyle{{{\rm AUMC}} \over {{\rm AUC}}} \cr {\rm CL} = &\displaystyle{{X{}_0} \over {{\rm AUC}}} \cr V = &{\rm CL}\cdot {\rm MRT}} $$
where X 0 is the injected dose; C i is the plasma concentration at time i; C n and t n are the last measurable plasma concentration and corresponding time, respectively; λ Z is the absolute value of terminal slope in lnC-t curve.
HPLC-MS/MS
AA and AD were separated on C8 column (Kinetx® 50 mm × 21 mm, 2.6 µm) at 25 °C. The mobile phase consisted of acetonitrile and buffer salts (90:10, V/V), including 10 mmol L−1 ammonium acetate. The flow rate was set at 0.3 mL min−1. The electrospray ionization in positive ion mode and negative ion mode was separately used to determine the content of AD and AA in plasma. The content of AA and AD was determined by multiple reactions monitoring. The transitions of the parent ions to the product ions of AD and its internal standard artemisinin (ART) were m/z 658.2 to 399.3 and 300.1 to 151.9, respectively. For AA and its internal standard artesunate (AS), it was m/z 417.2 to 178.9 and 383.2 to 116.2, respectively.
The instrument parameters of AA and AD were set as follows: the temperature of heater gas at 250 °C, ion spray voltage at 5500 V, curtain gas at 20 psi, nebulizer gas at 60 psi, auxiliary gas at 50 psi and collision gas at 50 psi, respectively.
Statistical analysis
A factorial design with analysis of variance was adopted for statistic analysis of antimalarial activities by statistical software system (SPSS 23.0) (Jia et al., Reference Jia, Li, Sharma, Li, Xie, Wang, Jiang, Cheng and Ding2017). It was found there was an interaction between doses and groups based on preliminary analysis (Table S1). So simple effects of different doses [4.4, 8.8, 17.6, 35.2, 70.4 µmol (kg·d)−1] and different treatment groups (ADLs, DHALs, AALs, AALs + CDLs isomolar mixture and CDLs) were analysed separately. (1) The differences between different treatment groups at same dose were analysed. (2) The differences between different doses in same treatment group were analysed. All groups were randomized to meet the statistical requirement of independence of observations.
The pharmacokinetic data results were represented by mean ± standard deviation (s.d.) and analysed by Least-Significant Difference (LSD) test by using SPSS 23.0.
Results
Synthesis of artelinic acid-choline derivative
The results of the FT-ICR MS (Fig. S2A), 1H-NMR (Fig. S2B) and 13C-NMR were consistent with the expected structure of AD, indicating that AD was successfully synthesized. Detailed results can be obtained from Supplementary materials.
Preparation and characterization of artelinic acid-choline derivative liposomes
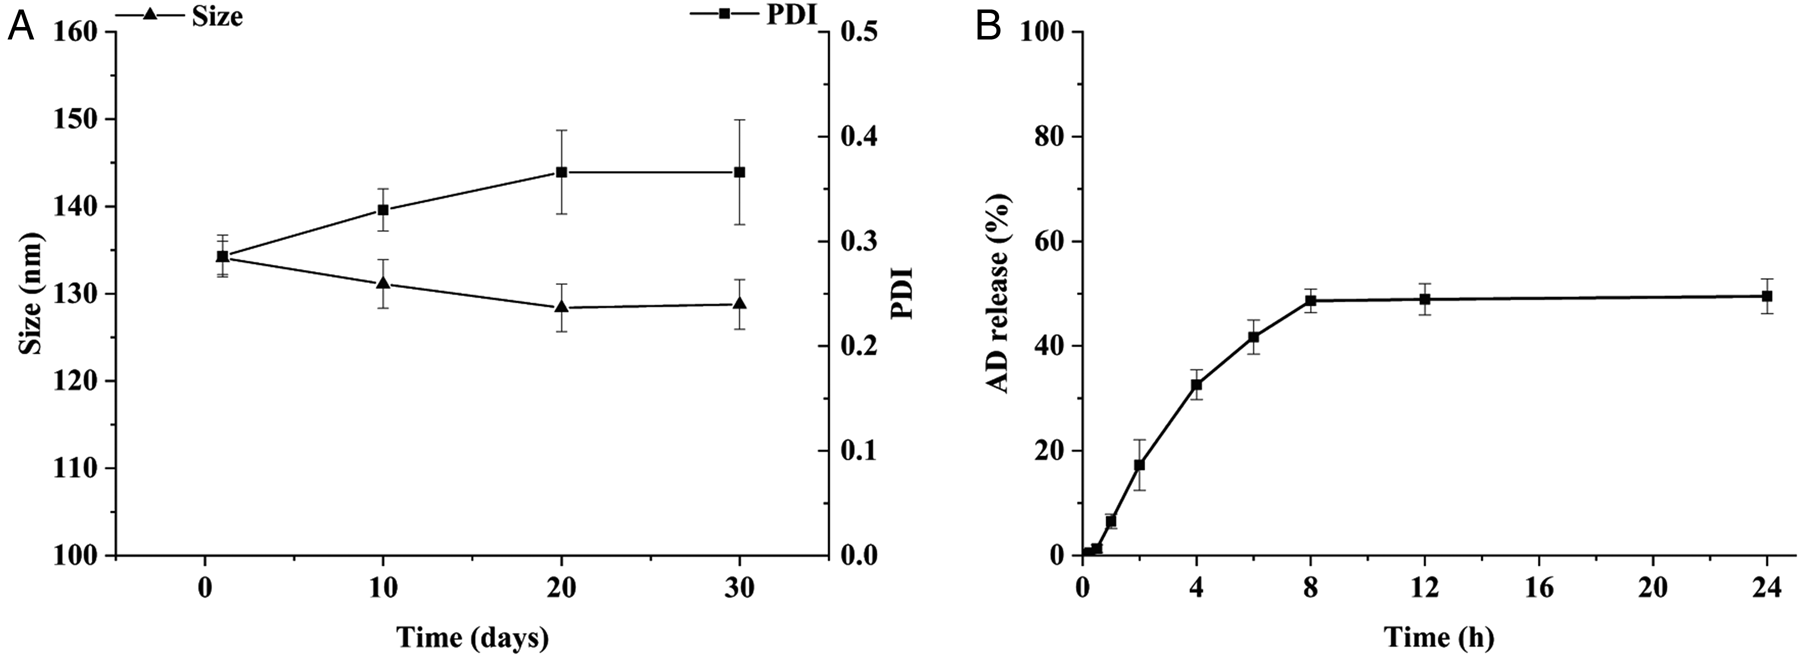
The EE, DL, size, zeta potential and PDI of ADLs were (95.74 ± 0.10)%, (12.60 ± 0.05)%, (146.4 ± 1.8) nm, + (40.87 ± 0.86) mV and 0.35 ± 0.03, respectively. As shown in Fig. S3, TEM presented that ADLs were composed of spherical nano-liposome structure and formed unilamellar vesicles and multilamellar vesicles. ADLs showed a relatively dissatisfied stability in 1 month (Fig. 1A), suggesting that ADLs should be prepared instantly when it was used.
(A) The stability of particle size and polydispersity index (PDI) of artelinic acid-choline derivative liposomes (ADLs) at −4 °C during 1 month. (B) Cumulative release percentages of artelinic acid-choline derivative (AD) from ADLs at 100 r min−1 and 37 °C. Data are shown as mean ± s.d. (n = 3).

In vitro drug release
The cumulative release percentages of ADLs were shown in Fig. 1B. At 8 h, the cumulative release percentages of AD from ADLs reached 48.64% and then reached relatively steady release (up to 24 h, the release reached 49.50%). The results indicated that the drug could be released slowly from the liposomes.
In vivo antimalarial activity results
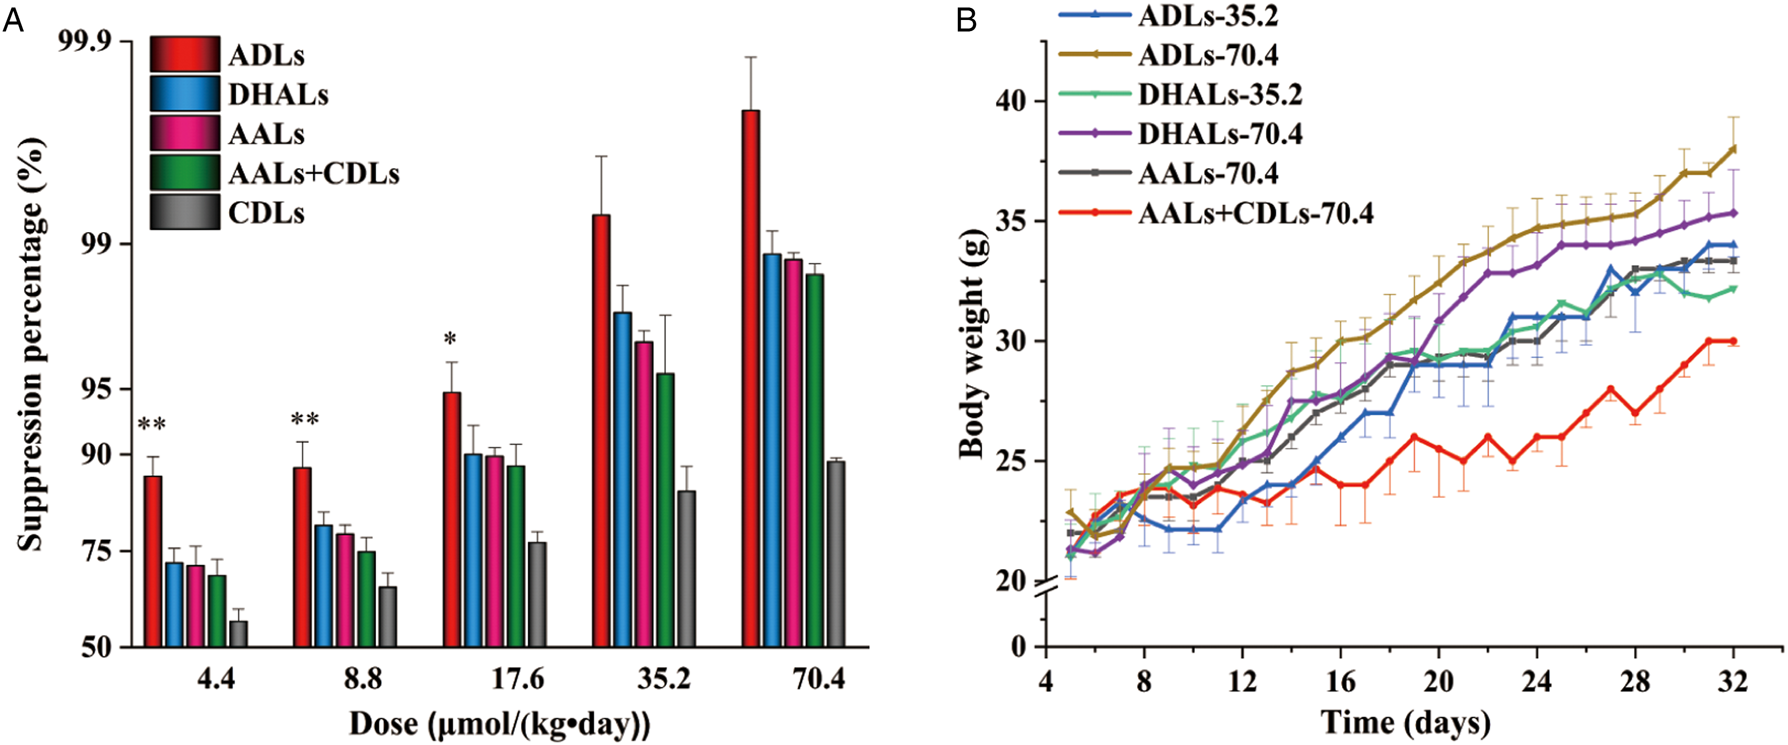
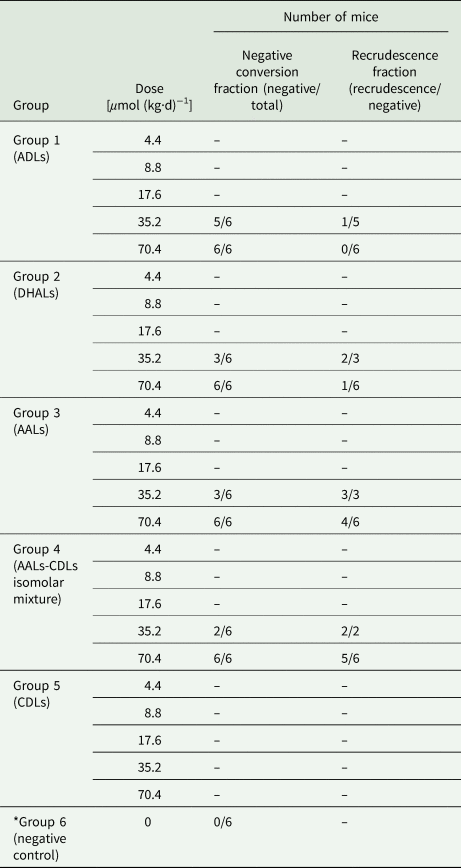
In vivo malarial rodent model was used for antimalarial evaluation, considering the possible involvement of the immune system in eradicating infection and prodrug effects (Waako et al., Reference Waako, Gumede, Smith and Folb2005). The suppression percentage, negative conversion fraction and recrudescence fraction of ADLs, DHALs, AALs, AALs + CDLs isomolar mixture, CDLs and negative control against Plasmodium yoelii BY265 in mice was shown in Table 1 and Fig. 2A. The suppression percentage of all treatment groups (group 1–5) was >50%, suggesting all treatment formulations showed significant antimalarial activity compared to negative control group. Body weight of surviving mice in group 1–5 demonstrated an increasing trend, which can be visually observed in Fig. 2B.
(A) The suppression percentage (%) of ADLs, DHALs, AALs, AALs + CDLs isomolar mixture and CDLs on day 5 (mean + s.d., n = 6). The suppression percentage (%) of ADLs was significantly higher than all other groups at 4.4 (**P < 0.01), 8.8 (**P < 0.01) and 17.6 (*P ⩽ 0.05) μmol (kg·d)−1, respectively. There was no significant difference between ADLs and DHALs or AALs or AALs + CDLs, at both 35.2 and 70.4 µmol (kg·d)−1, respectively. (B) The body weight changes of survival mice from day 5 to 32 (28 days after withdrawal), data were shown as mean ± s.d. ADLs, artelinic acid-choline derivative liposomes; DHALs, dihydroartemisinin liposomes; AALs, artelinic acid liposomes; AALs + CDLs, equimolar mixture of AALs and CDLs; CDLs, choline derivative liposomes.

The negative conversion fraction and recrudescence fraction of ADLs, DHALs, AALs, AALs + CDLs isomolar mixture, CDLs and negative control against Plasmodium yoelii BY265 in mice

ADLs, artelinic acid-choline derivative liposomes; DHALs, dihydroartemisinin liposomes; AALs, artelinic acid liposomes; AALs + CDLs isomolar mixture, equimolar mixture of AALs and CDLs; CDLs, choline derivative liposomes.
–, No data due to the death of all mice in this group.
Data are shown as mean ± s.d. (n = 6). *P < 0.01 compared to group 1–5.
The statistical results by factorial design with analysis of variance were shown in Tables S1 and S2. Among different treatment groups at each dose (Table S2), the suppression percentage (%) of ADLs was significantly higher than all other treatment groups at 4.4 (**P < 0.01), 8.8 (**P < 0.01) and 17.6 (*P ⩽ 0.05) μmol (kg·d)−1, respectively. No significant differences were found between ADLs and DHALs or AALs or AALs + CDLs at higher doses [35.2 and 70.4 µmol (kg·d)−1]. CDLs suppression percentage was significantly lower than all other treatment groups at each dose (P < 0.01). The suppression percentage of ADLs group showed a dose-dependent trend of antimalarial activity at lower doses [8.8, 17.6 and 35.2 µmol (kg·d)−1]. Between the doses of 35.2 and 70.4 µmol (kg·d)−1, there was no significant difference in the suppression percentage for each group (P > 0.05).
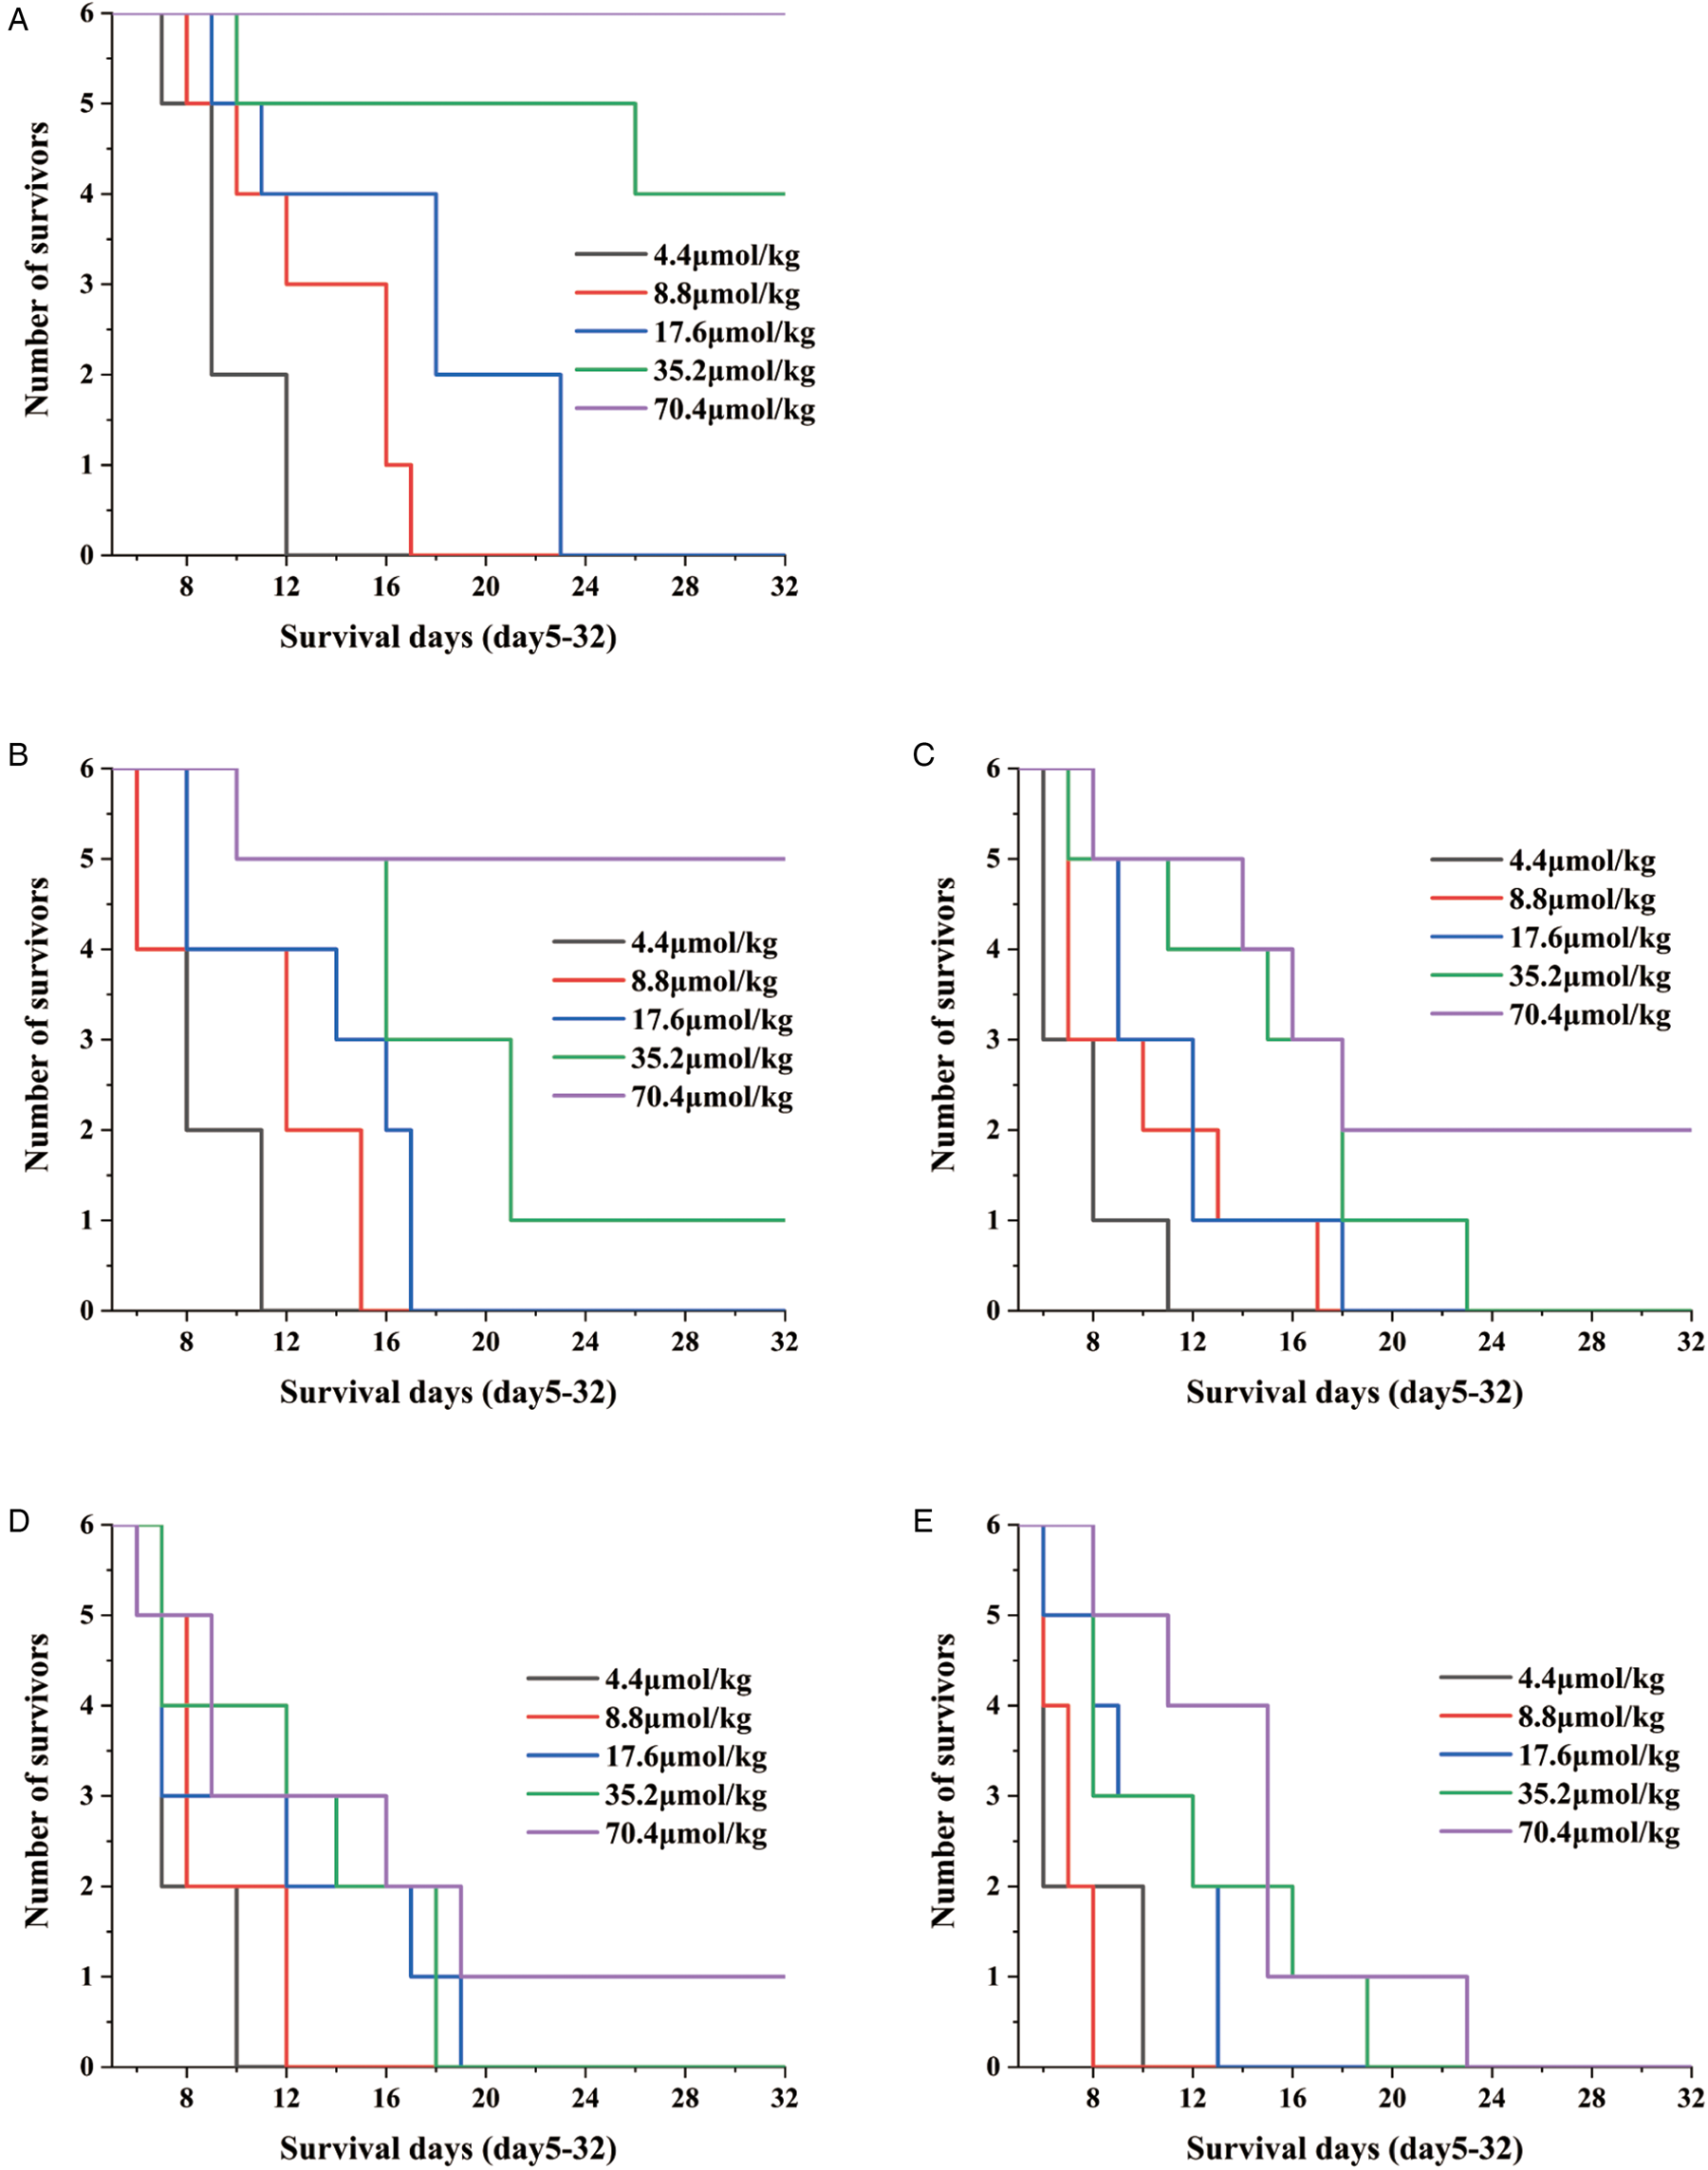
ADLs group showed the lowest ED50 and ED90 (1.92 ± 0.90 and 7.68 ± 1.26 µmol kg−1) among all groups (Table 2). Compared with other control groups, ADLs group showed higher negative conversion fraction, lower recrudescence fraction (Table 1) and higher survival fraction (Fig. 3).
Survival curves depicting mice alive from day 5 to 32. Survival curves of mice in ADLs groups (A), DHALs groups (B), AALs groups (C), AALs + CDLs isomolar mixture groups (D) and CDLs groups (E), respectively. ADLs, artelinic acid-choline derivative liposomes; DHALs, dihydroartemisinin liposomes; AALs, artelinic acid liposomes; AALs + CDLs, equimolar mixture of AALs and CDLs; CDLs, choline derivative liposomes.

ED50 and ED90 of ADLs, DHALs, AALs, AALs + CDLs and CDLs against Plasmodium yoelii BY265 in mice (n = 6, mean ± s.d.)

Acute toxicity test results
The acute toxicity test demonstrated that ADLs caused no mortality at the doses of 70.4 and 140.8 µmol kg−1 within 14 days. Observation of behavioural and physical body of mice indicated no obvious signs of overt toxicity, which suggesting the maximum dose of ADLs used in 4-day suppression test was safe for mice.
Pharmacokinetic study
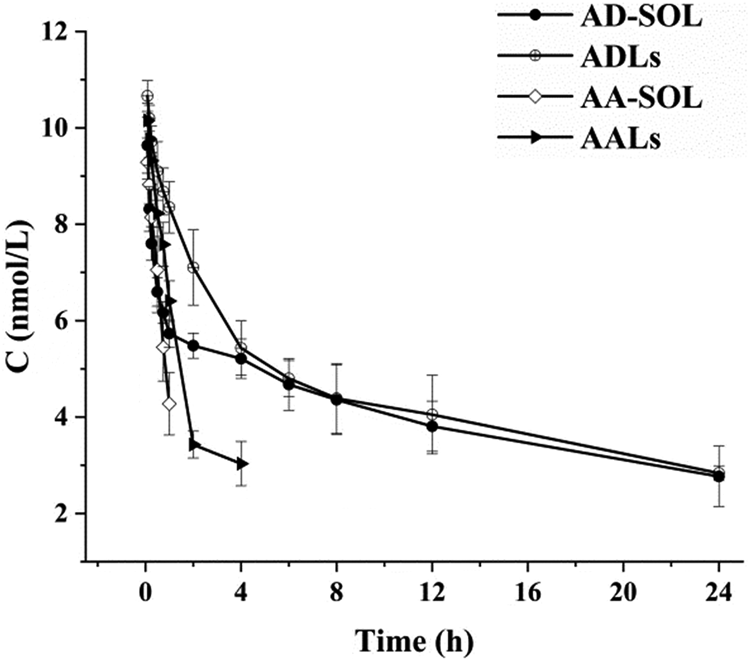
The mean plasma concentration-time curves of the ADLs, AD-SOL, AALs and AA-SOL groups were presented in Fig. 4 and the pharmacokinetic parameters were listed in Table 3.
AD plasma concentration-time curve of ADLs or AD-SOL, and AA plasma concentration-time curve of AALs or AA-SOL, after intravenous administration of 22.2 µmol kg−1 to rats. Data are shown as mean ± s.d. (n = 6). AD, artelinic acid-choline derivative; ADLs, artelinic acid-choline derivative liposomes; AD-SOL, artelinic acid-choline derivative solution; AA, artelinic acid; AALs, artelinic acid liposomes; AA-SOL, artelinic acid solution.

The main pharmacokinetic parameters of ADLs, AD-SOL, AALs, AA-SOL after intravenous administration of 22.2 µmol kg−1 to rats

ADLs, artelinic acid-choline derivative liposomes; AD-SOL, artelinic acid-choline derivative solution; AALs, artelinic acid liposomes; AA-SOL, artelinic acid solution; AUC, area under concentration-time curve; MRT, mean residence time; CL, clearance; V, apparent volume of distribution.
Data are shown as mean ± s.d. (n = 6). *P < 0.01 compared to ADLs.
ADLs showed the highest total plasma levels and the slowest eliminate rate, followed by AD-SOL, AALs and AA-SOL. Compared to the AD-SOL, AA-SOL and AALs, ADLs showed significant higher AUC values (P < 0.01). Also ADLs exhibited slower elimination than AD-SOL. In brief, the formulation of liposome could significantly increase total AD exposure levels, which was consistent with the result of pharmacodynamics.
Discussions
The ADLs prepared in this paper exhibited a relatively high drug loading (12.60%) and EE (95.74%). Pharmacokinetic results indicated ADLs had higher plasma levels of AD and reduced elimination, compared with AALs and AD-SOL. In addition, we conducted a preliminary measurement on possible metabolites AA and DHA of AD. However, DHA was undetected in the plasma of rats and AA was approximately 3% of the molar amount of AD (data not shown) using the current HPLC-MS/MS methods. The results suggested that the antimalarial effect of ADLs should be the consequence of the parent drug AD.
Considering the importance of PC synthetic pathways in plasmodia-infected erythrocytes (Itoe et al., Reference Itoe, Sampaio, Cabal, Real, Zuzarte-Luis, March, Bhatia, Frischknecht, Thiele, Shevchenko and Mota2014), we were interested in whether there was synergistic effect in ADLs or only simple addition effect of artemisinins and CD. Comparing with AALs, AALs + CDLs isomolar mixture and CDLs, ADLs exhibited superior antimalarial efficacy in suppression percentage, negative conversion fraction, recrudescence fraction and survival fraction, which suggested possible synergistic mechanism between artemisinins and CD in ADLs. On the other hand, in CDLs treatment group, although CDLs showed some antimalarial activity, all treated mice ultimately died from parasitaemia (<24 days at the highest dose) (Fig. 3), suggesting that CDLs cannot gain satisfactory antimalarial efficacy when used alone. Additionally, in vivo pharmacodynamics showed liposome formulation (CDLs and ADLs) could reduce toxicity potency, compared to CD and AD when used as free drugs (data not shown).
In summary, AD was successfully synthesized and formulated to liposomes. The pharmacodynamic results demonstrated that the antimalarial efficacy of ADLs was superior to other control groups. Pharmacokinetic results implied that ADLs had higher total exposure level in plasma and slower elimination. ADLs could be a promising preparation for malarial treatment.
Supplementary material
The supplementary material for this article can be found at https://doi.org/10.1017/S0031182019001306
Acknowledgements
We gratefully acknowledge Manyuan Wang of Capital Medical University for giving PyBY265 strain.
Financial support
This work was supported by the National Natural Science Foundation of China (grant number 81373364); the Startup Foundation for Doctors of Shanxi Medical University (grant number 03201619); the Applied Basic Research Project of Shanxi Province (grant number 201701D221162); Science and Technology Innovation Project of Shanxi Higher School (grant number 2017148) and Science and Technology Innovation projects of Shanxi Platform Base and Talent Special Project (grant number 201805D211002).
Conflict of interest
None.
Ethical standards
All animals used in this experiment were obtained from Shanxi Medical University and were performed according to the guidelines for the use of laboratory animals, which was approved by the Ethics Committee of Animal Experimentation of Shanxi Medical University.