1. Introduction
Concerns about the prudent disposal of revenues generated from the sale of non-renewable resources have been long articulated in mineral extracting economies, where mining often accounts for a large part of national income. There was, specifically, anxiety in such countries about how to cope when the mineral ran out. The concern was expressed in a contrasting range of actions, depending on specific local or regional conditions. There were, for instance, deliberate attempts to use oil revenues to industrialize and so diversify economic activity (especially among the more populous oil exporters), or efforts to create national investment funds out of the proceeds from the sale of oil, to buy financial and other assets that could generate income after the oil ran out (notably in the small emirates of the Arabian/Persian Gulf). A proclaimed desire to protect social welfare in future motivated these actions: whether in the form of the purchase of financial assets or acquiring machines (implied in industrialization), oil-funded capital accumulation can in principle generate income and hence sustain consumption in future.
This essay offers a limited study of such income sustainability for one oil exporter, namely Iraq. The essay begins with an exploration of some theoretical issues. The data and methodology of the study are presented next. This is followed by a discussion of the main findings. Finally, some conclusions are drawn.
2. Theoretical background
The concern over the sustainability of income and consumption and the related activity of income-generating capital formation implicitly recognizes that the current generation is not entitled to consume all of the revenue that results from the oil it extracts, as this would leave nothing for the consumption of future generations when the oil runs out. In Hotelling's (Reference Hotelling1931) formulation, the market mechanism offers a potential remedy to this predicament. The depletion of a resource is predicted to bid up its price, allowing its owner to dispose of the price increment as income, while using the remainder to augment capital and so guarantee future consumption. However, scarcity alone is insufficient to raise the price of a resource: if technical innovations result in reduced demand for the resource as a production input, the price of the resource may decline. Thus in order to secure future income, Hartwick (Reference Hartwick1977: 972) enjoins the sellers of non-renewable resources to:
Invest all profits or rents from exhaustible resources in reproducible capital such as machines. This injunction seems to solve the ethical problem of the current generation shortchanging future generations by ‘overconsuming’ the current product, partly ascribable to current use of exhaustible resources.
In this conception, the liquidation of the stock of non-renewable capital is offset by physical capital formation, so that the total stock of capital and hence future consumption in the economy remain sustained. Consumption would then represent an ‘interest’ or return on this stock of capital (Solow, Reference Solow1986). In practice, it is near impossible for mineral-exporting countries to follow Hartwick's rule, as it requires such countries to value the future consumption of persons yet unborn over the current consumption of the nation's (often impoverished and abundantly real) inhabitants. Moreover, the export of minerals earns foreign currency, which appreciates the exchange rate of the domestic currency vis-à-vis foreign currencies and, in turn, tends to reduce the international competitiveness of domestic goods producing sectors, agriculture, and manufacturing – the very sectors that would be required to generate income for current consumption. Using none of the revenues generated from the sale of non-renewable resources for current consumption is therefore difficult and unrealistic.
Be that as it may, a common facet of the noted formulations is the assumption that physical capital and natural assets (including non-renewable resources) are substitutes in production. For example, Stiglitz (Reference Stiglitz1974) models a single output economy with three inputs (labor, capital, and a non-renewable natural resource) with a constant returns to scale production technology. Production levels can be maintained with reduced amounts of natural capital, if adequately compensating quantities of manufactured capital are used, given a technology. In fact, the level of natural resource input can asymptotically approach zero (where the productivity of the input tends to infinity), even in the absence of technical progress. The latter, to the extent that it is resource-saving, may indefinitely prolong the exhaustion date of the resource. Before this occurs, however, it is reasoned that the adjustment mechanism of the market would identify new resource inputs. The relative scarcity of a resource would raise its price, which, in turn, brings about its substitution by more abundant resources and a change in final demand to products that use less of the scarce resource (Solow, Reference Solow and Gill1976).
Pearce and Atkinson (Reference Pearce and Atkinson1993) likewise implicitly assume such input substitutability: they posit that an economy is sustainable ‘if it saves more than the combined depreciation’ in natural and manufactured capital (p. 104). Building on this criterion and more generally the theory of ‘green national accounting’, Hamilton and Clemens (Reference Hamilton and Clemens1999) report in a time-series study the net changes in wealth or ‘genuine savings’ for developing countries in the period 1970–93. They derive the figures for genuine savings from estimates of net savings (defined as gross domestic investment less net foreign borrowing less depreciation of produced assets) to yield net savings; to this estimates of human capital formation (as reflected in expenditures on education) are added and deductions for resource depletion and environmental degradation (as expressed in the values of rents from non-renewable resources, depletion of forests and estimates of the marginal social cost of carbon dioxide emissions) are made to arrive at genuine savings.Footnote 1 Importantly, Hamilton and Clemens deduct the entire net revenue of the resource (price minus cost) in their calculations, an issue that we shall return to later.
Doubts have been raised about the ‘weak sustainability’ assumptions of these approaches. Daly (Reference Daly1990), for example, argues that natural and physical capital are better understood as complementary rather than substitute inputs.Footnote 2 This implies that for output to be sustainable, natural capital (the factor in shortest supply) has to remain intact. This is in principle easy to accomplish in the case of renewable resources, for example by planting trees to replace those that are harvested or by restraining fishing to allow depleted fish populations to recover. But non-renewable resources cannot be maintained unless they remain unused, in which case it is difficult to view them as resources. What is required, according to Daly, in the case of non-renewable resources is that their liquidation be offset with investment in renewable substitutes and in natural capital-saving technologies.
Related to the issue substitutability is the notion that some natural capital is essential and hence required for human sustainability, meaning that ‘the life opportunities of future generations are undiminished relative to the present’ (Howarth and Norgaard, Reference Howarth and Norgaard1992: 373). Critical natural capital provides ‘non-substitutable services (“keystone processes”) to the economy’, such as global processes that regulate climate or the capacity of an ecosystem to absorb and treat the waste generated through human consumption and production activities (Hanley, Reference Hanley2000: 21). As physical capital is unable to provide such services, life-preserving assets need to be identified and maintained. But natural capital that is deemed non-critical need not be preserved.
Although these issues in principle have important implications for all countries, including oil exporters, an individual exporter's ability to maintain critical natural capital globally is limited and in many instances is likely to be negligible. Certainly nations can preserve their own natural capital and encourage (or even finance) the efforts of others to do the same, but damage done elsewhere to processes that regulate climate, for instance, is likely to have negative repercussions everywhere, undermining local attempts to achieve income sustainability. It is therefore unrealistic to expect individual petroleum-exporting countries to have as a priority the preservation of critical natural capital globally – over which they have only limited control – before their first concern of income sustainability.
This study therefore seeks to assess whether Iraq was on a weakly sustainable growth path. Because of the limitations of data, neither a comprehensive study of the capital balanceFootnote 3 nor a study of the creation of renewable substitutes (as envisioned by Daly) is feasible. Moreover, the method proposed by Hamilton and Clemens is unsuitable. Because it deducts the entire value of extracted resource from the estimate of genuine savings, this method, like Hartwick's injunction, implicitly maintains that none of the revenues from the sale of non-renewable resources is treated as income. However, as El Serafy (Reference El Serafy1989) notes, oil revenues are the only means of income for some oil-exporting nations. Proposing that such countries spend none of these revenues on current consumption is unrealistic; assuming they spend none is inaccurate. Thus, building on the work of El Serafy, what follows instead is a limited study of what proportion of such revenues can be consumed in the current period without endangering future consumption prospects: it is an assessment of whether Iraq was compensating for the liquidation of its natural assets (oil) with investment in physical capital.
3. Data and methodology
The proposed method involves the division of oil receipts into a capital portion – the amount that needs to be reinvested to yield a constant income indefinitely into the future − and a consumption portion – the amount that may be consumed without endangering future consumption possibilities. The reduced consumption from the proceeds of the sale of the non-renewable resource is converted into assets that could yield a permanent income in future.
Operationally, the net revenues (receipts minus extraction cost)Footnote 4 from the non-renewable resource are converted to a permanent income stream. The finite series of revenues generated from the sale of the resource is converted into an infinite stream of future income so that the capitalized values of the two series are equal. If R* is the time series of revenues generated from the sale of the resource that (at the present extraction rate) runs out in n years time, the capitalized value of the finite series R* is given by

where r is the interest (or discount) rate. This expression is converted into a permanent stream of future income X*, so that the capitalized values of the two series are equal. So
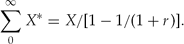
Solving, we obtain,

where X/R is the portion of oil revenues available for consumption and depends on n and r. The longer the expected longevity of the resource, the less has to be saved and reinvested today to guarantee future income, and more would be available for current consumption. Equally, the higher the interest rate, the less has to be invested for future consumption, as a high interest rate yields greater income in future. This is the rate of return that is consistent with current consumption propensities and hence also the social discount rate. If r is zero, then X/R equals zero; society expects no return to its investments and none of the income generated from the sale of oil can be used for current consumption. If either n or r approaches infinity, then X/R equals one; all the revenues generated from the sale of the natural resource are available for consumption, as either the non-renewable resource will last forever or the return to investment is so high that re-investing even a minute amount is sufficient to secure future consumption.
This method can be used to decompose income and capital portions through time and to examine whether there was sufficient re-investment in physical capital to offset the liquidation of the non-renewable resource. Conceptually, the formulation represents a modification of Hartwick's rule: instead of re-investing all the proceeds from the sale of the non-renewable resource into physical capital, only a portion is re-invested; the remainder is consumed. Much like Hartwick's method, this one implicitly assumes that natural and manufactured capital are, to some degree, substitutes; otherwise acquiring machines that substitute for resource liquidation could not generate income. Also like Hartwick's, the proposed method assumes that critical natural capital is maintained, so that there is a ‘generalized capacity to produce’ (Pearce et al., Reference Pearce, Atkinson and Dubourg1994: 463).
In applying the formulation, five points are noteworthy. First, revisions to the estimates of deposits will change the consumption portion X/R. As the formulation relates the stocks of natural resource at end of year to amounts extracted during the year, the calculation necessarily uses the ex-post estimate of reserves to assess whether investments in physical capital adequately offset the liquidation of natural assets.
Second, since it is unreasonable to correct for one type of capital depreciation, namely oil extraction, and disregard another, GDP growth rates are adjusted to account for the consumption of fixed capital. This is necessary to adequately appraise whether the nation was consuming its capital stock and is consistent with the recommendations of El Serafy (Reference El Serafy1997) to adjust GDP rather than other less frequently used macroeconomic variables such as NDP or NNP (estimates of which are incomplete for Iraq). However, to isolate the effect of capital depletion associated with the extraction of oil, GDP estimates for individual years are left unadjusted for the consumption of physical capital, but corrected to account for the depletion of natural capital.
Third, as it is also not sensible to correct for the exhaustion of oil but not other assets, other extracted minerals will be treated as if they were oil, by assuming that the reserves to extraction ratio of the entire mining sector is identical to that for oil. In 1971, before the oil price rise of the early 1970s, crude oil extraction accounted for 99.0 per cent of the value added generated in the mining and quarrying sector; this increased to 99.6 per cent in 1975, after the rise in oil prices.Footnote 5 Given the extent to which oil dominates the mining sector, any distortion that results from this simplifying assumption is likely to be negligible.
Fourth, while recognizing the issues associated with discounting – including the notion that the discount rate does not reflect the tastes of future generations, but the value that someone living today attaches to a commodity or resource at some point in future (Gowdy and Olsen, Reference Gowdy and Olsen1994) – this calculation requires a positive discount or interest rate. Iraqi real rates of interest in formal credit markets are highly distorted (often strongly negative) in this period, while international interest rates may not adequately reflect the consumption preferences of Iraqis. Consequently, neither can serve as a basis for this calculation. Instead, three arbitrarily chosen, but plausible, discount rates are used: these represent realistically moderate rather than overly ambitious expected rates of return on capital.
Finally, one needs to briefly discuss the reliability of the data, assembled largely under the Ba'th regime, in power for most of the period under study and renowned for its political repression and compulsive secrecy. So it is understandable to ask whether one can rely on the statistics that such a government released or the data that it submitted to international organizations. The nature of the regime notwithstanding, it is the experience of the author, at least in the period under study, that when there was uncertainty about whether to release data, the regime rarely indulged in partial solutions: data were withheld outright rather than massaged. Public debt and fiscal budgets, including defense expenditures, ceased to be published after the late 1970s; detailed population censuses were no longer disseminated after 1977, only summaries in the official Annual Abstract of Statistics. But not all data were suppressed: simple calculations from estimates reported in the noted abstracts confirmed what most Iraqis were experiencing, declining real incomes during the 1980s. True, the regime was accused of deliberately inflating estimates of child mortality in the 1990s to gain sympathy for its efforts to lift economic sanctions. Even here, however, those who accuse the regime of acting in this way concede that the data published before the onset of economic sanctions – which are the data that primarily concerns us – were generally reliable (Baram, Reference Baram2000). In fact, independent estimates (of health outcomes for example) and anecdotal evidence, when available, are broadly consistent with published estimates of the Iraqi government in the period under study (see al-Saadi, Reference al-Saadi1996). Of course, much like other developing countries, the data for Iraq are imperfect. On the whole, though, there is little evidence that the published data were systematically manipulated in this period.
From the ex-post estimates of petroleum reserves as they stood in 1990,Footnote 6 the amount of oil extracted annually is deducted to arrive at the reserves for each of the preceding years. These are divided by the amount extracted annually to attain the life expectancy of oil in that year, which, assuming a positive discount rate, enables the decomposition of oil revenues into capital and consumption portions. The portion of GDP that originates in the mining sector is assumed to approximate the oil revenues, net of extraction costs. GDP is then adjusted down by deducting that part of oil income that needs to be reinvested. This is done for the period 1955 to 1989. The first date is chosen as economic data become available roughly only after that time; the terminal date only just precedes Iraq's invasion of Kuwait and the imposition of economic sanctions, which (until the oil for food program became operational in 1998) precluded the export of oil. The period is sufficiently long so as to enable a limited assessment of capital re-investment.
4. Study findings
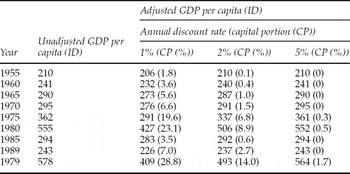
Table 1 presents a time series of real GDP as well as estimates of real GDP that are adjusted for capital depletion, computed at three interest rates: 1 per cent, 2 per cent, and 5 per cent, for the period 1955–89.Footnote 7 The table illustrates the changing fortunes of the Iraqi economy in the period and underlines that economy's dependence on oil. For most of the period the oil (mining) sector was the single largest economic activity, sometimes accounting for over 50 per cent of GDP (Yousif, Reference Yousif2001: 84). Petroleum was also Iraq's main export in this period, accounting for 93 per cent and 99 per cent of all exports in 1965 and 1983, respectively.Footnote 8
Real GDP and adjusted GDP per capita 1955–89 at constant 1975 prices

Notes: The official exchange rate for one ID was US$2.8 from 1950 to 1970, appreciated to 2.96 and 2.97 in 1971 and 1972 respectively and to 3.39 in 1973, where it remained until 1981. In 1982 the ID was devalued to 3.21, a rate that remained in effect throughout the 1980s.
Due to the prominence of the sector, changes in the price and exported volume of oil result in large fluctuations in GDP. Real per capita GDP rose almost threefold from ID 210 in 1955 to a peak of ID 578 in 1979, but declined sharply after 1980. OPEC's official price for ‘Arab Light’ crude rose from an annual average of US$3.05 per barrel in 1973 to US$28.64 in 1980 (OPEC, 1995: 122). Parallel to this, Iraq's oil output increased from 1.5 million barrels per day (MBD) in 1972 to 3.5 MBD in 1979 (OPEC, 1995: 47). Consequently, GDP rose steadily during the 1970s. The reverse trend was at play in the 1980s as the volume of exports and oil prices both declined, resulting in economic contraction. The onset of the Iran–Iraq War in 1980 caused severe disruptions to Iraq's oil exports: output fell to 0.9 MBD in 1981, but rose gradually thereafter (OPEC, 1995: 47). Meanwhile, from a peak price of US$32.51 per barrel in 1981, the price of oil steadily declined throughout the 1980s (OPEC, 1995: 122).
At any given discount rate, the capital portion (CP), given in parentheses next to the relevant estimate of adjusted GDP, is highest when the output of oil is greatest. This is because an accelerated rate of oil extraction is reflected in lower reserves to annual extraction ratio (the life expectancy of the resource), which in turn implies a lower consumption and hence higher capital portion. As oil output reached a peak of 3.48 MBD in 1979 (OPEC, 1995: 47), this year is associated with the highest capital portions at any given discount rate. The relatively small magnitude of the adjustment to GDP, evident especially at the highest rate of interest, is due to Iraq's high petroleum reserves to extraction ratio, calculated to be 98 years at the output level of 2.74 MBD in 1988 (OPEC, 1995: 10 and 47).
Not surprisingly, the capital portion is smallest at the highest discount rate, where future consumption is valued least. At the 5 per cent rate of interest, the adjustment to GDP is negligible. The largest deviation from the unadjusted estimates of GDP at this discount rate occurs in 1979, when the ratio of unadjusted to adjusted GDP is 98.3 per cent, i.e. only 1.7 per cent of GDP need be reinvested if future consumption is to be secured. The adjustment to GDP increases with the decline in the discount rate. At the 2 per cent rate of interest, the capital portion is 6.8 per cent, 14.0 per cent, and 2.7 per cent for 1975, 1979, and 1989 respectively; income is adjusted down by these percentages for the years indicated. The largest adjustments to GDP are attained at a discount rate of 1 per cent. At this rate, the capital portion of GDP is 19.6 per cent, 28.8 per cent, and 7 per cent in 1975, 1979, and 1989 respectively.
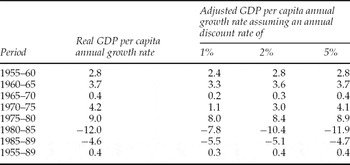
The choice of interest rate also influences the attained growth rates of adjusted per capita GDP, presented in table 2. Because of the small magnitude of adjustment to the level of per capita GDP when a discount rate of 5 per cent is assumed, the rate of growth of adjusted GDP per capita is almost identical to that of the unadjusted aggregate. At the 2 per cent discount rate, there is greater divergence between the rates of growth. In the 1970–75 period, for example, adjusted GDP shows an annual rate of growth of 3 per cent compared to an unadjusted rate of 4.2 per cent for GDP. In contrast, the decline between 1980 and 1985 is greater for unadjusted GDP, at −12 per cent per annum, than for adjusted GDP, at −10.4 per cent. As expected, the largest divergence in growth rates occurs at the 1 per cent discount rate, where the rate of growth of adjusted GDP in the period 1970–75 is 1.1 per cent per annum, much below the 4.2 per cent rise in unadjusted GDP. Conversely, the decline in adjusted GDP growth in the period 1980–85 is –7.8 per cent per annum, lower than the decline of the unadjusted aggregate, which was –12 per cent.
Comparison of growth of real per capita GDP, and adjusted GDP, at constant 1975 prices

In distinction, the capital adjustment to GDP exaggerates the decline to the growth rate of GDP in the period 1985–89, because the relatively higher rate of oil extraction in the period 1985–89, compared with that for the period 1980–85, implies a higher capital portion. The lower discount rates adjust growth rates downward in periods of expanding petroleum output but upwards in periods of contraction. As a result, for the entire period 1955–89, the annual growth rate of adjusted GDP was 0.3 per cent, 0.4 per cent, and 0.4 per cent for the 1 per cent, 2 per cent, and 5 per cent discount rate respectively, while that of the unadjusted aggregate was 0.4 per cent. That is, over the long term, the choice of discount rate makes no difference to the estimates of the rate of growth.
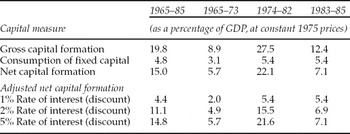
While the discussion thus far has presented estimates of real GDP and its rate of growth adjusted to account for the asset depreciation that results from the sale of oil, it does not answer the question of whether Iraq was consuming its capital stock. This is done below. To obtain an estimate of gross capital formation, gross fixed capital formation is added to any changes in stocks. When subtracted from the consumption of fixed capital, net capital formation is obtained.Footnote 9 The deduction of the capital portion from net capital formation to yield ‘adjusted net capital formation’ will give an indication of whether the liquidation of oil assets was offset by physical capital formation. Table 3 contains data regarding these physical capital aggregates.Footnote 10 For the period 1965–85 as a whole, gross capital formation and fixed capital consumption were 19.8 per cent and 4.8 per cent respectively, yielding a net capital formation level of 15.0 per cent of GDP. Within this period, however, there are considerable differences. Because gross capital formation was a high 27.5 per cent of GDP, net capital formation was 22.1 per cent in the sub-period 1974–82. In contrast, in 1983–5, gross capital formation was only 12.4 per cent of GDP, while in 1965–73 it was only 8.9 per cent.

When the capital portion of GDP is deducted from net capital formation the results in terms of re-investment are respectable. At the 5 per cent rate of interest, the capital portion is very small and the corresponding correction to net capital formation is negligible. At the 2 per cent rate of interest, net capital formation is adjusted down from 15 per cent of GDP to 11.1 per cent, for the entire period 1965–85. Within this period, this statistic is adjusted down from 5.7 per cent of GDP to 4.9 per cent for 1965–73, from 22.1 per cent to 15.5 per cent for 1974–82, and from 7.1 per cent to 6.9 per cent for 1983–85. The largest adjustment to net capital formation occurs at the 1 per cent rate of interest. At this rate, net capital formation is adjusted down from 15 per cent of GDP to 4.4 per cent for the entire period. In the sub-periods 1965–73, 1974–82, and 1983–85, net capital formation is adjusted down from 5.7 per cent of GDP to 2.0 per cent, from 22.1 per cent to 5.4 per cent, and from 7.1 per cent to 5.4 per cent respectively. Whichever discount rate is used, adjusted net capital formation is largest in the 1974–82 sub-period.
This suggests that the disinvestment arising out of petroleum extraction in general was balanced by the investment in fixed capital and stocks in the period under study. These calculations, moreover, indicate that much of the revenue generated by the oil boom in the 1970s was invested in physical capital, as evidenced by the performance of gross capital formation, which rose threefold from 8.9 per cent of GDP in the period 1965–73 to 27.5 per cent in 1974–82. In fact, because of transport bottlenecks and skilled labor shortages, the economy's ability to carry through investments could not keep pace with the rise in planned capital expenditures (Yousif, Reference Yousif2001). The observed estimates for capital formation in this sub-period thus represent a fraction of the intended investments.
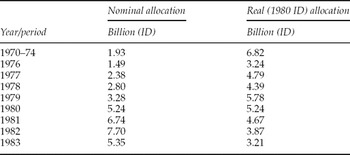
The reduced level of capital formation in the last sub-period 1983–5 is largely the result of diminished public investment. Government was the main source of investment in the period: 78 per cent of all gross fixed capital formation in 1980 and 72 per cent in 1985 was carried out by the state.Footnote 11 Much like recurrent fiscal expenditures, public investments (called the ‘development budget’) were funded through receipts from the sale of oil. But development spending was not restricted to the provision of social overhead capital, which was often paid out of recurrent expenditures, but extended to investments in the various sectors, often in state-owned enterprises. Table 4 presents estimates of such development allocations. Because actual investment expenditures of government almost always lagged behind allocations, these estimates can be considered an upper bound for expenditure. The observed decline in the real value of the allocations after 1980 reflects the effects of the Iran–Iraq war, as development spending was sharply curtailed and resources redirected to the war effort.
Public investment (development) allocations, 1970–831

Note: 1No estimates of development allocations are available after 1983.
Sources: Calculated from Alnasrawi (Reference Alnasrawi1994: 71 & 82) and UN (1989: 396).
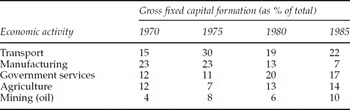
Although these findings indicate that Iraq was not consuming its capital stock and therefore not endangering the consumption of future generations, one ought to be cautious about making firm judgments. First, the results show only that there was sufficient re-investment, not that the investments that were made are associated with the highest social rate of return. Given that Iraq for much of this period (especially since the early 1970s) was a highly regulated economy, with a plethora of policy-imposed distortions and, consequently, defective price signals, it is possible, indeed likely, that some projects with fairly low or even negative social rates of return were chosen. For instance, Stork (Reference Stork, Nore and Turner1980) casts doubt about the prospective profitability of the large capital-intensive hydrocarbon-based industrial investments of the state. Of course, profitability is not the proper yardstick to evaluate state-owned firms that are concerned with social rather than private costs. Still, as these investments were intended to generate future income, profitability is not irrelevant. Moreover, there is reason to believe that at least some of the investments were made with the aim of maintaining a police state apparatus rather than future consumption. Table 5 contains estimates of the distribution of gross fixed capital formation by sector and shows that ‘government services’ received (very) roughly one eighth of total investment. Some of this ‘investment’ was arguably required to improve or rationalize public administration, but a portion of this expenditure surely served to enable internal repression.
Distribution of gross fixed capital formation by select economic activity, 1970–85

Source: UN (1988: 207–208).
Second, because of the unavailability of official data, this study does not consider the accrual or depletion of public monetary assets and liabilities, such as foreign exchange reserves or public debt.Footnote 12 Rough, and unverifiable, estimates place foreign exchange reserves at $36 billion and public debt at $2.5 billion in 1980; heavy borrowing during the Iran–Iraq war is estimated to have almost exhausted foreign exchange reserves and increased debt to $22.8 billion (Jiyad, Reference Jiyad and Mehdi2002: 87 and 101). The deduction of these amounts from the estimates of re-investment may reverse our tentative conclusions about Iraq's income sustainability.
On the other hand, if the parameters of the study were expanded to include human capital formation (which is not possible because the estimates of spending on human capital are incomplete), our tentative conclusion that Iraq was not consuming its capital stock likely would be strengthened. Largely through public investment in education and health, human development outcomes improved at an unprecedented pace in the period, especially during the 1970s and 1980s, when health and education services were provided mostly free of charge. To note only two examples of expanded human capabilities, infant mortality declined from 90 per thousand in 1970 to 63 in 1980 and reached 40 in 1990 (Pellet, Reference Pellet and Arnove2000: 161). Meanwhile, the adult literacy rate rose gradually from 18 per cent in 1957 to 47 per cent in 1977 and reached 73 per cent in 1987, the latter jump mostly the result of the public adult literacy program of the late 1970s (Yousif, Reference Yousif2001: 129). This is not to suggest that public investments in health and education were optimal – in fact, I argue elsewhere that they were notFootnote 13 – but that were these investments to be included in our considerations, they would strengthen our conclusion that Iraq was on a sustainable growth path before 1990.
5. Conclusion
This tentative conclusion that there was sufficient re-investment in physical capital to offset the depletion of natural assets is perhaps not surprising, given Iraq's large reserves to extraction ratio for oil – which implies that only a relatively small portion of the oil revenues need to be re-invested to secure future consumption – and, to a lesser extent, the comparatively high rates of capital formation, especially in the period 1974–82. One would expect countries with similar resource endowments and investment profiles to be in parallel conditions of sustainability.
This inference is however contrary to that of Hamilton and Clemens (Reference Hamilton and Clemens1999), who report consistently (and strongly negative) genuine savings rates in the period 1970–93 for oil exporters such as Saudi Arabia and Iran, which like Iraq are endowed with high life expectancy for oil and registered robust investment performance in the period.Footnote 14 This is because Hamilton and Clemens deduct the entire value of net revenues of the resource in computing genuine savings; for savings rates to be non-negative, an amount equal to net revenues would have to be re-invested. Consequently, countries where oil is a prominent economic activity exhibit negative genuine savings rates and hence are purported to be unsuccessful in achieving income sustainability. Indeed, Hamilton and Clemens report that genuine savings for the Middle East and North Africa, a region whose economies are dominated by oil, were negative throughout the period 1970–93 and reached their lowest point in the years 1979–81, when oil prices and extraction rates – and therefore net revenues – were at their highest (Hamilton and Clemens, Reference Hamilton and Clemens1999: 345). In contrast, the findings of this study are compatible with those of Eric Neumayer (Reference Neumayer2000), who criticizes the genuine savings approach on both practical and theoretical grounds. Utilizing El Serafy's approach, Neumayer shows that most of the mineral exporting economies of the Middle East and North and sub-Saharan Africa that are reported to have negative genuine savings actually show signs of income sustainability. Thus, it appears that even before exporters of non-renewable resources consider issues of the social profitability of investment – let alone substitutability and the preservation of critical natural capital – they must work out the very basic issue of how rich they really are.