1 Introduction
Today, nearly all industrialized countries are ageing. An increasing number of individuals are becoming eligible for retirement, and the maturing of the pensions system gives increasing pension levels. With the present Norwegian pension system, which is a pay-as-you-go pension benefit system, an increasing burden of work and tax payments will have to be born by a declining number of individuals in the work force over the coming decades. However, pension reforms have been proposed by the Norwegian government, with the intention to induce more people to postpone their retirement age. The reforms, if implemented, will give the individuals an incentive to postpone retirement. The unions have argued against part of the reforms and pointed to the fact that the reforms would excessively punish people who retire early compared to what happens under the current pension regime. In Norway, there is an early retirement scheme (AFP) that covers all employees in the public sector and a majority of employees in the private sector. The lowest retirement age is 62. If one decides to retire early, he or she is not punished in terms of lower annual future pension benefits.
To assess the labour market implication of pension reforms, one needs to know how potential retirees respond to the labour supply incentives present in the pension reforms and to changes that reform the pension system further, which implies that if one retires at the earliest possible age, annual pensions will be lower than if the retirement age is postponed. This is what this paper tries to answer.
In order to estimate labour supply responses among older people, we have employed a very simple model of retirement decisions that can be estimated on a single cross-section sample, and still be given a structural interpretation in terms of inter-temporal decisions. Empirical models of retirement typically use flow data (i.e. containing information on change of status) and adopt some version of the stochastic dynamic programming approach (e.g. Lumsdaine et al., Reference Lumsdaine, Stock, Wise and Wise1992; Rust and Phelan, Reference Rust and Phelan1997). Here we follow a much simpler research strategy, developed in Colombino (Reference Colombino2003). As in Burtless and Moffit (Reference Burtless and Moffit1985)and Gustman and Steinmeier (Reference Gustman and Steimeier1986)the first-order conditions of a standard inter-temporal optimization problem are employed to yield the optimal retirement age. From an empirical point of view, the advantage is that the model can be estimated on cross-section data, containing only information on current occupational status. To simplify modelling, we assume that the individual maximizes the intertemporal utility given the expected length of life instead of maximizing the expected intertemporal utility (with expectation taken as the probability distribution of life length).
We will estimate the model under two alternative assumptions with respect to constraints in the credit market. In the first alternative, we assume that the agents are facing liquidity constraints to the extent that total consumption in each period (year in this study) is equal to current disposable income (no consumption smoothing). In the second alternative, we go to the other extreme and assume that the credit markets are perfect (perfect consumption smoothing). In the dataset, income, as well as savings, is observed. In reality, the credit markets are neither totally perfect nor totally imperfect. However, it is hard to observe the factual credit constraint that each household is facing and our estimates reported below are only meant to illustrate the empirical importance of the credit constraint assumption.
The model is estimated on Norwegian register data from 1996, which covers all Norwegians aged 55–68 in 1996. In this year, we observe the individuals either in a retirement or in an employment modus and we use these observations to estimate the probability of retirement based on a structural model. Two policy reforms are analysed. First, we reduce the pension benefits in the current pension system by 10%. This change has a positive impact in terms of increases in the labour supply of people eligible for early retirement. The number of men and women choosing retirement is reduced by around 9% (women) and 10% (men), which implies elasticities of retirement probabilities with respect to pension benefits of around 1.
In the current Norwegian pension system, there is no punishment in terms of reduced future pension benefits if one retires early. However, the government has proposed a pension reform that will introduce this type of punishment. Future pension benefits will increase if retirement is postponed. The reform will start to be implemented in 2011. To assess the impact of this reform, we have increased future annual pension benefits if retirement is postponed one year. In one of the simulations, future annual benefits are increased by NOK 8,000 (as of August 2009 1 Euro~ NOK 8.6), which is around 5% of the average pension benefit in 1996. The number of men and women choosing retirement is reduced by around 5%, given that there is no consumption smoothing. When perfect consumption smoothing is assumed, the reduction is much larger: 18% in the case of men and 14% in the case of women. These reductions are really sizeable and indicate that pension reforms combined with removing constraints in the credit market may be of great importance in giving individuals an incentive to prolong their working life. The mechanism behind the result is that when the credit market is perfect, it is possible to save or to borrow money today on the premises of future increases in pension benefits, given that one signs a contract of continuing working. In the calculation of the gains if retirement is postponed, we have accounted for expected length of life, which differs across gender, with women living a little longer than men. Despite the latter, when the credit market is perfect, the reduction in the probability of retirement is predicted to be larger among men than women. The explanation is that there are many factors, other than pension benefits and own income, that affect the decision to retire. In the calculation of future gains, if retirement is postponed, we have assumed a real rate of interest equal to 3% and equal across all individuals. With higher interest rates and/or with a variation in the interest rates across individuals, the gains of postponing retirement would on average be lower and hence the overall reduction in the propensity to retire early would also be lower.
In Appendix 1, we give a brief overview of the institutional settings in Norway. Appendix 2 reports the tax structure.
In Section 2, we present the theoretical models from which we derive the optimal point in time for retirement. Section 3 gives the empirical specification of the models, while Sections 4 and 5 present data and estimation results, respectively. In Section 6, we report policy simulations performed on the model. Section 7 concludes.
2 A model of individual retirement decisions
Imperfect credit markets, no consumption smoothing
We start with the case with no consumption smoothing. Let C denote household consumption that has to be less than or equal to annual after tax household income. If retired, annual after tax income is denoted R, and if working, annual after tax income is denoted W. Because utility will be assumed to be strictly increasing in consumption and because of the assumption of no saving or borrowing, utility is derived from current disposable income and from other variables that will be introduced later. Annual consumption entering the utility function is replaced by annual disposable income.
Let


Note that besides income or consumption, utilities also depend on leisure and personal characteristics. Details will be given below.
The inter-temporal utility, V(.), is the sum of discounted future instantaneous utilities

where time is measured since the start of the working career, τ is the point in time of (for simplicity, irreversible) retirement, e −δ is the discount factor, and D is the expected length of life.
The necessary condition for a maximum of V(τ) with respect to τ is

If V(τ) is single-peaked, this condition is also sufficient.
Let
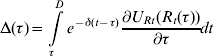
The individual will then be observed
• in retirement status in year t if and only if
(5)
• in employment status in year t if and only if
(6)


The term Δ(t), evaluated at the time of retiring, is the (future) gain in utility by postponing retirement by one more year, which is positive if the future pension level then increases. Δ(t) is the cost of early retirement. From the definition of Δ(τ) we observe that

If  > 0, then the individuals get a higher future annual pension if retirement is delayed. Hence, there will be a loss if retirement is not postponed. In the Norwegian current pension system, the pre-reform pension system, the future pension benefits are not affected at all by the retirement decision. In fact, if an individual retires early, future pension benefits are projected on the basis of the projection of future wage income, as if the individual were still working. Thus, in the current Norwegian case,
 is zero, and hence Δ(τ) also equals zero. In the proposed reform, the pension system is moved towards a system in which
 is positive. This we will come back to when we discuss policy simulations.
Perfect credit markets, perfect consumption smoothing
Next we consider the case where perfect credit markets allow the consumer to optimally smooth expenditures across different time periods. The inter-temporal optimization problem is

s.t.
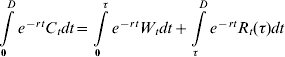
where C t is consumption at time t and e −r is the market discount rate. To this end, we assume δ=r.
Let £ be the Lagrange function associated with this problem and μ the Lagrange multiplier

The first-order conditions are

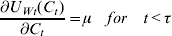
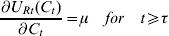
From (10) and (11) we get  for all t, and hence from (9) we get

where

As mentioned above, in the current Norwegian pension system  = 0. In the section where we discuss policy simulation, we will discuss the impact on retirement of letting
 > 0.
From (10) and (11), we observe that μ can be calculated from the empirical specification of the utility function. We also observe that μ and hence Γ(τ) depend on the consumption level  .
As in the no-smoothing case, we now observe the individuals in
• retirement status at time t if
• employment status at time t if


The model outlined above gives the constant life-cycle consumption level that can be achieved throughout life. In the model, there is a life-time budget constraint, which implies that savings in one period are either consumed later or used to repay debt. Because the model is estimated on a cross-section dataset, each person is only observed once. The life-time budget is not then readily observable. Some individuals are observed with savings and other with borrowing. However, since we observe persons at different points in their life-cycle path of earnings and consumption, and since we apply a structural model, this makes it possible to identify the model. In a sense, the cross-section data reflect the life-time budget with repayment of debt, saving for future consumption and borrowing against future income.
3 Empirical specification
Imperfect credit markets, no smoothing of consumption
The instantaneous utilities are specified as follows


where f(x) is a concave function of x and:
• R t(τ)=after-tax pension received in year t if decided to retire in year τ. This will be equal to 0 if the individual exits the employment status but is not eligible to receive either the old age pension, or early retirement pension. We let R t(τ) be the after-tax pension when the pensioner is either on old age pension or on pensions in the early retirement programme (AFP). The pension term in the utility function is given by R t(τ)E t, where E t=A t + S t, and where S t=1 if the age equals 67 or above (old age pension) and S t equals 0 otherwise, while A t=1 if S t=0 and the individual is eligible to retire early on AFP, otherwise A t=0.
• W t=after-tax employment income received in year t, if employed in year t.
• y t=exogenous (with respect to the individual) income in year t, i.e. the after-tax income of the spouse plus the after-tax capital income.
• L Wt=leisure if employed in year t.
• L Rt=leisure in year t if retired.
ε are stochastic components, identically and independently standard extreme value distributed with a scale parameter, which will be absorbed in the scale coefficients of the utility function (the α and the γ).
α and γ are parameters to be estimated. γ is expressed as a linear combination of a set of characteristics Z t

We do not model the choice of hours of work, and we thus assume that when retired the individuals do not combine retirement and say, part-time work. We therefore choose a convenient normalization: g(L Wt)=0 and g(L Rt)=1. The utility functionsFootnote 1 are given in (17) and (18)
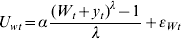

The utility function is strictly concave if λ<1. If λ=1, the utility function is linear in consumption and log-linear if λ=0.
Note that according to the conditions (3) and (4) above, the relevant comparison between utilities in the alternative states is done for τ=t.
Let P Rt be the probability of observing the individual in the retirement status at time t. From (3), (17), and (18) we then have

Given the distributional assumption made upon the ε, P Rt is

The variables in the Z-vector are personal characteristics such as age, which are assumed to be related to leisure. In the current Norwegian pension system, Δ(t)=0. In order to discuss the impact of a pension reform that gives the individuals incentives to postpone retirement, we will introduce Δ(t) in the probabilities and show the effect of this.
Perfect credit markets, perfect smoothing of consumption
In this case, the instantaneous random utilities are given by
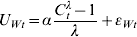
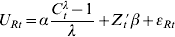
where C t is consumption at time t, defined as household disposable income at time t minus household savings at time t.
From (14), (21), and (22), we get the probability that an individual is observed in retirement status at time t, P rt

where Γ(t) is given in (13). From (21)–(23), we get

which clearly reduces to
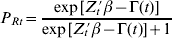
As alluded to above, since Γ(t) is proportional to the Lagrange multiplier μ, Γ(t) depends on consumption  , and it is given by

where 
Again, in the current Norwegian pension system  = 0, while in the proposed reform of the system
 > 0.
4 Data sources and summary statistics
Sample
We base our analysis on administrative data, which are merged administrative registers received from Statistics Norway, with permission from the Norwegian Data Inspectorate. We use demographic data files, old age pension registry, and tax return records. A unique personal identification numberFootnote 2 for each resident in Norway allows linking over time and across registers. From the Norwegian register datasets, we have extracted persons aged 55–68 in 1996 (born 1928–1941) and who were receiving labour income or pension of at least 1 G in 1996. G denotes minimum income (see Appendix 1 for further details). The reason why the lowest age is 55 is that in Norway there is no pension available for ‘young individuals’, at least not for individuals in their 40s and early 50s. For the sample used in the analysis, we have included all persons who were either:
(1) Retired: classified as a pensioner in July 1996 in a social benefit database in Statistics Norway (FD-trygd), and receiving an old age pension or an early retirement pension (AFP) of at least 1 G in 1996, according to the tax files.
(2) Working: not retired and with earnings of at least 1 G according to the tax files in 1996.
This means that we have excluded persons who were disabled, were on rehabilitation or were out of the labour force for other reasons, or had too low earnings. The spouse's after-tax income was added to give household income, regardless of the source of the spouse's income.
Potential pension
For all persons in the sample, we impute potential old age public pension for persons aged 67 and above, and early retirement pension for persons aged 64–67, by applying the appropriate formulae to the sequence of pension points, which are observed in our data (see Haugen, Reference Haugen2000; Hernæs et al., Reference Hernæs, Jia and Strøm2001).
Although the public pension system (old age public pension and the early retirement programme AFP) is the most important source of income for most retirees, there are also other pension programmes, as mentioned above, which influences the budget constraints of potential retirees. So far, we have not been able to impute the size of these occupational pensions, or identify eligibility, which would also require information on accrual within the company. Instead, we have represented this pension option by including among the covariates a dummy, called FIRM, which equals 1 if the individual works in a firm with a pension plan (other than AFP) and 0 otherwise. This information is derived by identifying the previous occupation of retirees who were observed receiving occupational pensions.
Potential earnings
In order to smooth out possible fluctuations in income, the potential earnings assigned to each individual is the maximum of observed earnings in 1996, earnings in 1995, and the average of earnings 1991–1995. This means that the longer a person has been retired, the lower the potential earnings will be predicted to be. Individuals who have not had earnings later than 1990 are all excluded. The after-tax wage income of the spouse and household capital income after tax is observed for 1996. In the model, these two incomes sum to the variable y t, but in Table 2 both incomes are reported. To calculate household consumption, we deduct household savings from household income after tax. Savings are observed as the value of net financial assets at the end of the year 1996, minus the value of financial asset at the end of the previous year, as reported to the tax authorities.
More than half of the wealth of Norwegian households is in the form of housing, which is not very liquid. Hence, we focus on the financial wealth, which is in the form of bank deposits and other financial assets. The year 1996 appears not be exceptional with respect to these financial assets. The main stock market index in Norway did increase more or less steadily through 1995–1997, with annual increases from 12% to 32%.
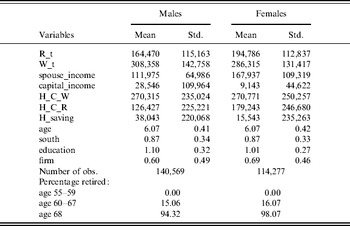
In both of the age groups, 55–66 and 67 and above, average wealth increased by an annual rate of 5% during 1996 and 1997. Since the stock market rate of increase did not vary a lot over this period, savings seem to be fairly stable over the two years. Taking into account that taxable value varies a lot, the savings reported in Table 2 of 38,043 and 15,543 (male and female headed households) comply well with the aggregate statistics and lend credibility to our data.
The large difference in consumption between working and retired households is due mostly to the age difference. The working group starts at age 55 and has a much lower average age. Therefore, there is a considerable cohort effect, which also explains most of the large difference between earnings and pension.
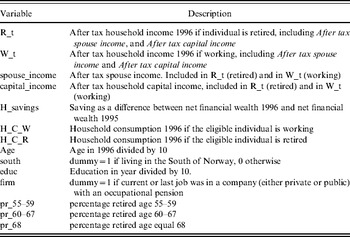
Variable description and summary statistics for the sample used in estimating the models are given in Table 1 and Table 2, respectively.
Variable description

Summary statistics for sample used in estimation, Norway 1996
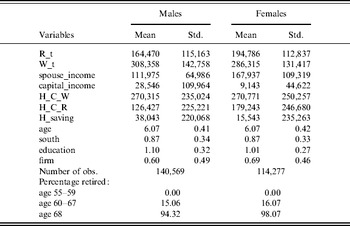
Note: t=1996. In the estimation income variables are in 10000 NOK.
5 Estimates
The models are estimated (by maximum likelihood), using the cross-section data for Norway in 1996. Let d it=1 if the individual is in the retirement status at time t, and d it=0 if the individual is in the employment status. Then the log-likelihood function to be maximized with respect to α, β, and λ, is

To measure how well our models explain data we have computed a pseudo-R2 as  , where £* is the maximized likelihood and £ 0 is the likelihood when choices of retirement are made at random, that is P Rt=(1 – P Rt)=0.5. Thus ln£ 0=nln0.5, where n is the total number of observations. This pseudo-R2 measures how much better our structural model explains data relative to pure random draws of the choices.
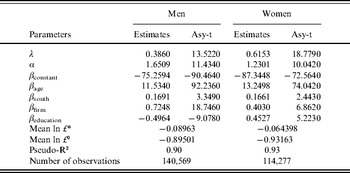
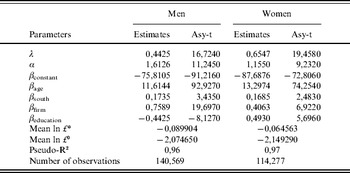
Table 3 reports the estimates of the no-smoothing model and Table 4 the estimates of the perfect consumption smoothing model. As expected with this huge dataset, the coefficients are sharply determined. The pseudo-R2 is rather high in all four cases in Tables 3 and 4 and indicates that our models explain data far better than if all choices had been made at random. Of particular interest is the result that the estimates of all coefficients as well as the fit are the same across the two extreme cases of no and perfect consumption smoothing. This means that the two extreme assumptions on smoothing fit the data equally well. It also indicates that the estimates of the utility function are robust with respect to the specification of the budget constraints. An indicator of, for example, individual specific credit rationing could improve modelling. This is, however, not available in our data, so we use both models in the following, noting reasonably good fit with both.
Maximum likelihood estimates of α, β, and λ. Norway 1996: no consumption smoothing

Maximum likelihood estimates of α, β, and λ. Norway 1996: perfect consumption smoothing

For men and women, both the deterministic part of the utility function is estimated to be strictly concave and the utility function is significantly different from a linear as well as a log-linear function. The estimates of the shape coefficient, λ, indicate that the marginal utility of consumption declines more with consumption among men than among women. For both gender, the marginal utility of leisure is increasing with age and almost to the same extent. As expected, for both men and women age has a positive impact on retiring. Living in the south and hence in the most densely populated area of Norway has a positive impact on the utility of leisure and hence on the propensity to retire.
The positive estimates of (βfirm) mean that working in a company with a company specific pension programme increases the probability of retiring. This underlines the importance of financial incentives for the retirement decision. The estimates indicate clearly that the firm-pension effect is more important among men than among women.
The estimate related to the impact of education on retirement, (βeducation), implies that for females, higher education increases the probability of retirement. For males, the impact is the opposite: the higher the education, the higher the propensity to postpone retirement.
6 Policy simulation
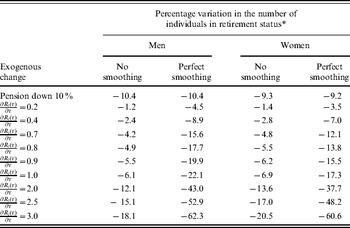
The estimated structural model can be used to simulate the effects of pension reforms. Here we limit ourselves to illustrate the implications of the models by showing the ceteris paribus effects of changes in pension benefits and a reform of the pension system that gives the individuals an incentive to postpone retirement. The simulations must be interpreted as a comparative static exercise: it shows how different the number of retired people would be as a consequence of a permanent change in some variables or parameters. For each individual, we compute the probability of being in retirement status before and after the exogenous change. The individual probabilities are then summed across the sample to get the estimate of the expected number of people in retirement status. The simulations are replicated for each of the estimated model versions. The results are given in Tables 5.
Simulations

Note:
* The point in time of (irreversible) retirement (τ) is 1996.
The reduction in pension benefits by 10% has almost the same effect on retirement among men (around 10% less retired men) and women (around 9% less retired women). These numbers imply that the elasticity of retirement to pension benefits is around 1, both for men and women.
To introduce a reform that gives the individuals an incentive to postpone retirement we let  > 0. We show nine examples, ranging from
 = 0.2, which means that pension benefits are increased by NOK 2,000 per year if retirement is postponed by one year, to
 = 3.0, which means that pension benefits are increased by NOK 30,000 per year if retirement is postponed by one year. These numbers imply that if retirement is postponed by one year, pension benefits are increased from around 1% to 15% of the average pension in the population. Table 5 gives the results in terms of reduction in number of people choosing retirement in 1996. In the new and proposed flexible pension system, actuarial adjustment implies that the pension level will increase by around 6% if retirement is postponed from 67 to 68 years and around 4.5% by a postponement from 62 to 63 (Ministry of Labour and Social Inclusion, 2009). At the average pension level for males and females, this corresponds to increases in the range of 7,000–10,000 NOK (0.7–1.0 in Table 5). With
 = 0.8, the model without consumption smoothing gives a decrease in the number of retirees by around 5%, a little more for females, since a certain percentage increase in pension corresponds to a somewhat higher absolute increase. This result implies that the share of retired individuals between 60 and 67 goes down by around 0.75 percentage points, a little more for women (from around 15% for men and around 16% for women).
The most striking result from a modelling point of view is that the responses to actuarial adjustments are much stronger when the individuals are able to smooth consumption over the life-cycle. With  = 0.8 the model with consumption smoothing yields a reduction in retirement of close to 18% for men and 14% for women. This implies that the share of retired men between 60 and 67 goes down by more than 3 percentage points (from around 15%), and a little less than 3 percentage points for women between 60 and 67 (from around 16%). This result stresses that the reduction in retirement when pension systems are reformed depends crucially on the credit market. With a perfect credit market, the individuals can save or borrow money to smooth consumption on the premises of future gains in pension benefits when retirement is postponed.
Instead of increasing future pension benefits if retirement is postponed, the government can reduce the future pension benefits if retirement is taken out early. The impact on retirement is more less the same.
There are some interesting differences across gender. When the credit market is completely imperfect, women tend to respond a little stronger to changes in future pension benefits if retirement is postponed by one year. When the credit market is completely perfect, men tend to respond stronger.
7 Conclusion
We have employed a very simple model of retirement decisions that can be estimated on a single cross-section sample, and still be given a structural interpretation in terms of inter-temporal decisions. The model is estimated on Norwegian register data from 1996, which covers all Norwegians aged 55–68 in 1996. The empirical model is employed to assess the impact on retirement of introducing incentives for individuals to postpone retirement. Future annual pension benefits are increased if retirement is postponed one year. In one of the simulations, future annual benefits are increased by NOK 8,000 as of April 2009 1 Euro~ NOK 8.6, which is around 5% of the average pension benefit in 1996. This corresponds approximately to the adjustment in the new pension system, which comes into effect 1 January 2011. The number of men and women choosing retirement is reduced by around 5%, given that there is no consumption smoothing. When perfect consumption smoothing is assumed, the reduction is much larger; a little less than 18% in the case of men and 14% in the case of women. These reductions are really sizeable and indicate that pension reforms combined with removing constraints in the credit market may be of great importance in giving the individuals incentive to prolong their working life.
Appendix 1 Institutional settings
The description of pension and taxation rules that follows is not only meant to serve as an introduction to the paper. In fact, in the estimation of the retirement models all details of pension programs and taxation are accounted for.
In 1937, the first mandatory public old age pension insurance was implemented. The system was universal, in the sense that everyone was eligible, but it was restricted to persons with relatively low income. The age of eligibility was set to 70 years. In 1957, the means testing was lifted and coordination with government pensions was introduced. An earnings-based component was added to the basic amount in 1967 and the age of eligibility was lowered to 67 years, giving the structure of the National Insurance System (NIS), which is still in operation.
Pensions are financed through taxes levied on employers and employees as percentages of total earnings and on the self-employed as a percentages of their income. There exists a central pension fund, but it is not required that this should meet future net expected obligations. The (PAYG) system is based on yearly contributions from the government. In what follows, we will briefly describe the Norwegian pension system. If not otherwise stated, all information refers to the year of analysis in this paper, 1996. More details can be found in Nordic Social-Statistic Committee (2008).
The public old age pension system
The mandatory public pension system (NIS) has two main components. One component is a minimum pension, paid to all persons who are permanently residing in the country. The pension is reduced proportionally with less than 40 years of residence.
The other main component is earnings-based pension. A crucial parameter in the system, used for defining contributions as well as benefits, is the basic amount. The basic amount (G) in 1996 was NOK 40,410. As of April 2009, 1 EURO is approximately NOK 8.7.
The earnings-based pension depends on the G and the individual earnings history in several ways. To give pensions points, earnings exceeding the G each year are divided by G. Earnings above 12 times G do not give points, and earnings between 6 and 12 times G (8 and 12 times before 1992) are reduced to one third before calculating pension points. Points calculated each year are then multiplied by a ‘supplementary pension rate’ of 0.45 (points obtained after 1992 are multiplied by a rate of 0.42), and the average yearly points over the 20 best years are calculated. These points multiplied by G give the earnings-based component, and adding 1 G gives the total public pension. If a person has had less than 40 years with earnings above the G, the earnings-based pension is reduced proportionally.
The public pension system also has a number of additional regulations, which we will briefly recount here. First, since we are still in the process of phasing in the public pension system established in 1967, a special ‘overcompensation’ program is in operation for persons born before 1928. Secondly, there is a supplementary pension for those without or with a low earnings-based pension component, giving a minimum pension level of 1.605 times the G (1 G). Because of the supplementary pension, income below 2.344 times the minimum pension does not contribute to the total public pension. Thirdly, there is a coordination of the pensions for married couples, mainly resulting in a reduction (25% in 1996, 20% in 2003) of the couple's joint pension compared to the sum for two single persons.
Keeping 1996 regulations constant, the maximum future public old age pension level will be 3.94 times the G. This pension level requires 20 years with earnings of at least 12 G and another 20 years with earnings of at least 1 G.
Government pensions
State and local government employees have occupation-based pensions, coordinated so that benefits as a main rule will be the maximum of the public old age pension and the government pension. The government pension is based on the earnings level immediately prior to retirement and not on the previous earnings history. The pension is 66% of gross income the year prior to retirement up to 8 times G (the same basic amount as in the public system) and 22% of income between 8 G and 12 G. In 2000, the rules were changed so that the pension now is 66% of gross income up to 12 G. As in the public system, income below 1 G does not count. In the government sector, there are a few groups that can retire early, such as individuals working in the police and the military.
Private sector (firm specific) occupation-based pensions
In the private sector, 36% of the work force are covered by an occupation-based pension, from which benefits are received ‘on top’ of the public old age pension without any reduction. For employers to receive tax deductions for contributions, there are regulations, implying that the pension should include all employees and that the eligibility age is at least 65.
Earnings testing of pension benefits
Pensioners aged between 67 and 70 in the public old age pension system (previously employed in the private sector), who continue to work in different job than they had when they retired, will have their pension reduced if earnings from work exceed a certain level. The same happens to pensioners in the government sector who start working in other jobs in the government or local government. However, if the government pensioners get a job in the private sector, their income does not influence their pension. For pensioners aged 70 years or more, there are no reductions in benefits, regardless of what system one receives pension benefits from.
Personal savings
Individuals can save for their retirement age. These savings are tax deductible and widespread. In 1996, 167,000 individuals received tax deductions.
Early retirement
Finally, in 1989 employers and unions negotiated an early retirement scheme (AFP). Under this scheme, persons working for employers who are participating (in 2001 about 43% of private employees and all employees of central and local government) and meeting individual requirements can retire at an earlier age than the ordinary 67, for details see Hernæs et al. (Reference Hernæs, Jia and Strøm2001). The age at which persons become eligible for AFP has been gradually lowered since the first agreement in 1989. Table A2 gives a summary of this. We observe that in the years before 1996, the eligibility age was lowered from 66 to 64 years.
The age limit for AFP eligibility

The pension under the AFP scheme is calculated in much the same way as the ordinary public old age pensions, except for some differences due to the age at which one chooses to retire and which sector one is working in. Individuals working in the private sector, who choose to retire early, get the public old age pension as described above and an additional tax-free AFP lump sum of NOK 11,400 a year.
In the government sector, both state and local, the rules are different. First, the occupation-based pension, described above, is part of the AFP scheme from the age of 65. Before that age the public sector retirees get the same pension as those retiring from the private sector. Secondly, the AFP lump sum is different. Retired people between 62 and 65 get a taxable AFP lump sum of NOK 20,400 a year, whilst from the age of 65, when they receive the occupation-based pension, they do not get the AFP lump sum. Moreover, early retirement is not penalized in the sense that future AFP pension is not affected by when the individual retires.
Taxation
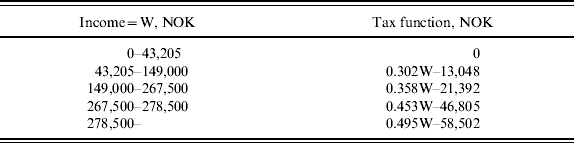
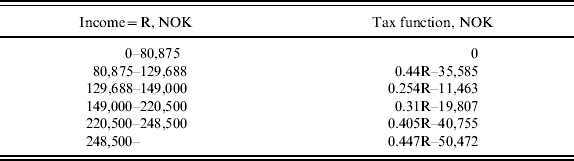
In Appendix 2, we report how different types of income were taxed in 1996. Taxation of wage income is progressive and hence re-distributive. From the tax functions in Appendix 2, we note that the marginal tax rates on pension income is not uniformly increasing with income and consequently the budget sets for retired individuals are non-convex.
Replacements ratios
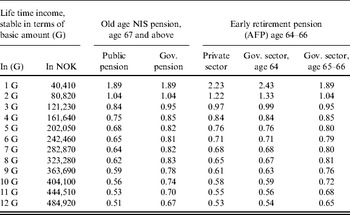
Table A2 reports replacement ratios for Norway in 1996. We show the replacement ratios for Norwegian singles, see Haugen (Reference Haugen2000) for married people and for other years. After-tax replacement ratios are defined as the after-tax-pension income divided by the after-tax wage income.
After-tax replacement ratios: single individuals, Norway 1996
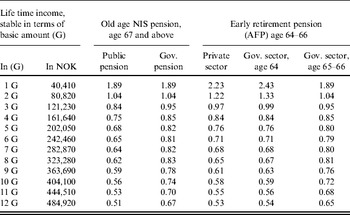
The Norwegian replacement ratios indicate that incomes after retirement are more evenly distributed than before retirement. The pension system, as well as the tax rules, contributes to this result. For individuals with very low wage income, the replacement ratio, as in Italy, is even above 1. In 1996, the average income among those working was around 6 G, and we observe that at this income level the replacement ratio ranges from 65% for individuals on old age pension to 81% for individuals on government pension. In the private sector, the replacement ratios tend to be higher for the early retiree than for the old age pensioners.
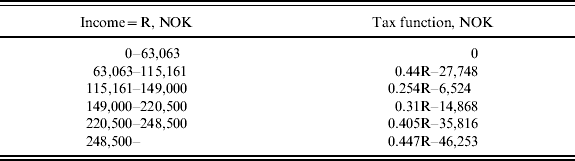
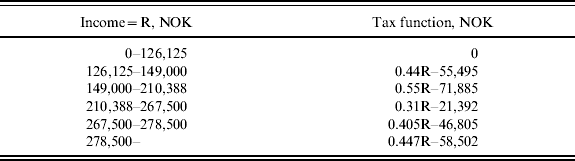
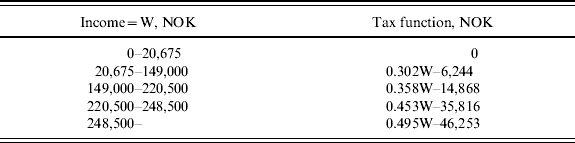
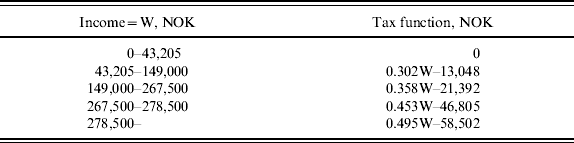
Appendix 2 Tax functions, Norway 1996
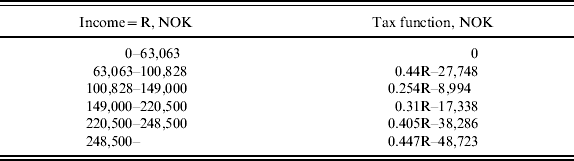
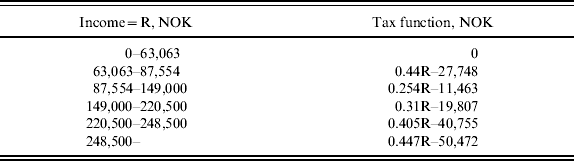
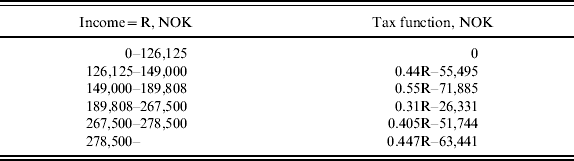
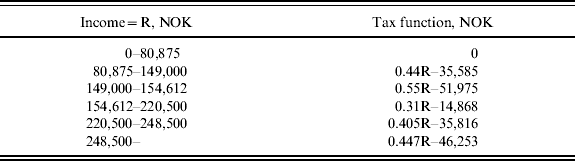
Below we give the tax functions for Norwegian individuals in 1996. According to the rules regarding tax deductions and marginal tax rates, there are nine separate tax functions that are of relevance for our study. Individuals on old age pension get tax deduction for high age (67 or above). A single individual gets the same deduction for old age as a married couple where both spouses are above 67. Moreover, individuals on old age pension or who are retired according to the early retirement programme, AFP, do not pay taxes that exceed 55% of gross income before deductions. Taxes vary also with regards to whether the individual is married or not, and they also depend on the source of income for the spouse.
Individuals on old age pension, 67 years of age or above
Single individual on old age pension, 1996
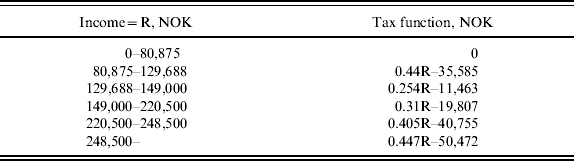
Married individual on old age pension, spouse also on old age pension, 1996
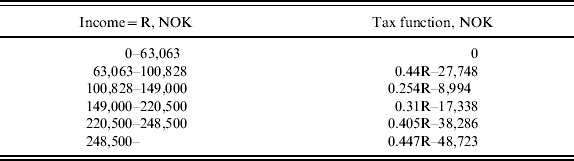
Married individual on old age pension, spouse working, 1996
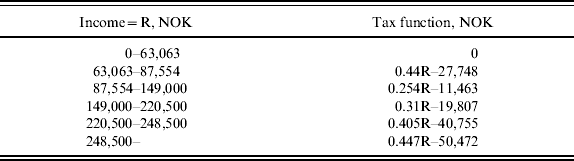
Married individual on old age pension, spouse has no income, 1996
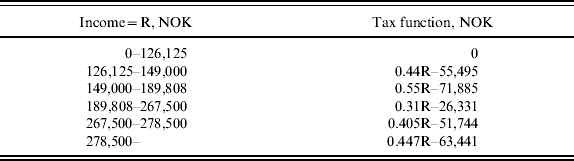
Individuals on AFP
Single individual on AFP, 1996
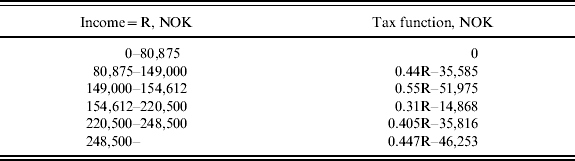
Married individual on AFP, spouse either on pension benefit, old age pension as well as AFP, or working, 1996
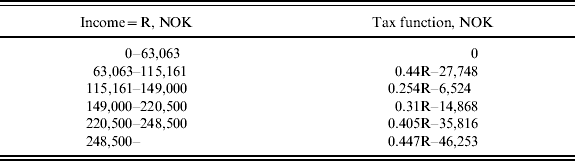
Married individual on AFP, spouse has no income, 1996
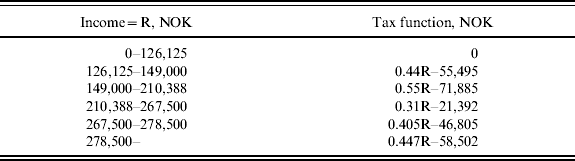
Working individuals
Working individual, either single or married with spouse working or receiving pension benefit, 1996
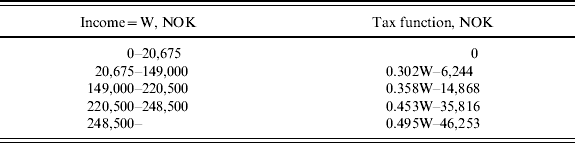
Working individual, married with spouse without income, 1996