Introduction
Efficient and timely diagnosis of crop nitrogen (N) status is crucially important for the success of many precision N management (PNM) strategies. Relying on the chlorophyll spectral absorption characteristics, many optical sensors have been used to detect N status non-invasively and guide in-season N fertilization (Yao et al., Reference Yao, Miao, Huang, Gao, Zhao and Jiang2012). However, these optical sensors are influenced by soil and/or water background noise prior to canopy closure. In addition, saturation in the measured index often occurs under high biomass conditions. The reflectance signals are more related to biomass and leaf area index (LAI) rather than plant N concentration, especially before canopy closure, resulting in low diagnosis accuracies (Huang et al., Reference Huang, Miao, Zhao, Yuan, Ma and Tan2015).
Fluorescence sensing signals are mainly affected by leaf chlorophyll concentration instead of soil and/or water backgrounds or biomass conditions; hence, they are more related to crop N status (Tremblay et al., Reference Tremblay, Wang and Cerovic2012; Longchamps and Khosla, Reference Longchamps and Khosla2014). It was therefore hypothesized that fluorescence sensing could be used to estimate N status reliably before canopy closure. In a recent study, Longchamps and Khosla (Reference Longchamps and Khosla2014) found that fluorescence sensing could detect N variability as early as at the V5 stage of maize and was not influenced by soil background. In another study, Li et al . (Reference Li, Zhang, Zhao, Lei, Xu and Lu2013) found that fluorescence sensor variables were highly related to chlorophyll meter readings in rice. The objective of this study was to evaluate the potential of using Multiplex3, a hand-held canopy fluorescence sensor, to determine rice N status at different growth stages.
Material and methods
Study site and experimental design
The study area was located in the Sanjiang Plain, Heilongjiang Province, Northeast China. In 2013, a field experiment was conducted at Jiansanjiang Experiment Station of China Agricultural University (47o15'N, 132o39'E). A factorial randomized complete block design with three replicates was adopted for the experiment. Five different N rates were applied using 0, 70, 100, 130, or 160 kg N ha−1 to two Japonica rice varieties, Kongyu 131 and Longjing 21. The N fertilizer urea was applied in three dates, 40% as basal fertilizer before transplanting, 30% at the active tillering stage, and 30% at the stem elongation (SE) stage. The phosphate (50 kg P2O5 ha−1) fertilizer calcium superphosphate was applied as basal fertilizer before transplanting, and potash (100 kg K2O ha−1) fertilizer was applied at two dates, 50% as basal fertilizer and 50% as panicle fertilizer at the SE stage. The plot size was 4.5 m×9 m. Planting density was approximately 30 hills m−2 for Kongyu 131 and 28 hills m−2 for Longjing 21, with identical row spacing of 0.3 m for both varieties.
Fluorescence measurements
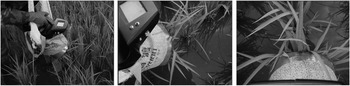
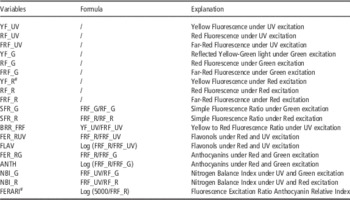
The portable chlorophyll fluorescence sensor Multiplex 3 (Force-A, Orsay, France) was used in this study. It is an active sensor with four emission light sources (UV_A, green, red or blue) that excite the chlorophyll in plant tissues to induce fluorescence. Normally, the UV_A (375 nm), green (530 nm), and red (630 nm) emission light sources are used for plant monitoring, and the blue emission light source is used for calibration. The sensor has three filtered detectors for fluorescence recording including blue-green or yellow fluorescence (447 nm) (YF), red fluorescence (665 nm) (RF) and far-red fluorescence (735 nm) (FRF). The variables recorded by the Multiplex sensors and their explanations are listed in Table 1. The Multiplex sensors readings were obtained at the panicle initiation (PI), stem elongation (SE), and Heading (HE) growth stages. At each growth stage, measurements were made by moving forward with the sensor bottom along and just touching the crop leaves on two representative rows in the center of each plot (Fig. 1). The collected data points were averaged for the two rows and were used to represent the plot.
Demonstration of the Multiplex 3 operation in the rice field.

Description of the variables recorded by the Multiplex.

# the parameter can’t be collected under “measuring in movement” mode.
Plant sampling and measurements
Plant samples were collected from the same rows where fluorescence sensor measurements had been acquired at each of the three growth stages. All the plant samples were rinsed with water and the roots were removed. The samples were separated into leaves, stems and panicles (e.g. HE stage). They were weighted after being dried in an oven at 70–80°C to constant weight. Approximately one fourth sub-samples were ground to pass a 1 mm mesh in a laboratory mill and subsequently analyzed for N concentration for leaves (LNC), stems and panicles using the Kjeldahl method. The plant N concentration (PNC) was the sum of each organ’s N concentration multiplying their weight proportions. The plant N uptake (PNU) was determined by multiplying PNC by dry aboveground biomass (AGB). The N Nutrition Index (NNI) was calculated, adopting the critical N concentration (N c ) equation developed for rice in this region (Huang et al ., Reference Huang, Miao, Zhao, Yuan, Ma and Tan2015). The NNI was defined as the ratio of the actual PNC (N a ) to the N c , i.e. NNI=Na/Nc.
Statistical analysis
Data were subjected to analysis of variance (ANOVA) and were compared using the least significant difference (LSD) test for the effects of N rates, sampling dates, and their interactions. Relationships between Multiplex variables and N status indictors were determined using the linear regression model. The coefficient of determination (R2) was calculated for comparison. All of the statistical analyses were performed with the SPSS 20.0 (SPSS Inc., Chicago, Illinois, USA).
Results
Effects of nitrogen application rates and sampling dates on Multiplex sensor variables
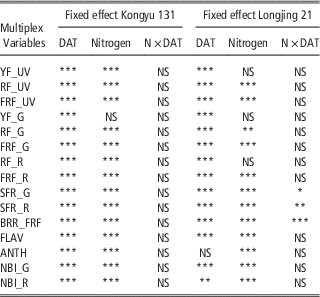
The ANOVA analysis results indicated that all variables, except for YF_G for rice variety Kongyu 131 and YF_UV, YF_G, and RF_R for variety Longjing 21, were strongly influenced by N application rates across sampling dates. In addition, the sampling dates, which were represented by days after transplanting (DAT), had significant effects on all of the Multiplex variables except ANTH for Longjing 21. No significant interaction was identified between the two independent variables (N rate and sampling date) for Kongyu 131, and for most Multiplex variables of Longjing 21 (Table 2).
Analysis of variance results of Multiplex variables as affected by sampling dates expressed as days after transplanting (DAT), N rate and their interactions for two different rice varieties.

*Significant at P≤0.05; **Significant at P≤0.01; ***Significant at P≤0.001; NS: Not significant (P>0.05).
Correlations between Multiplex variables and N status indicators
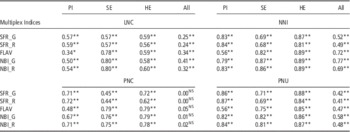
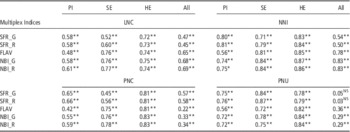
The relationships between the Multiplex ratio indices and N status indicators, including LNC, PNC, PNU, and NNI, are shown in Table 3. The ratio indices BRR_FRF and ANTH were excluded due to previous analysis (data not shown). At all the three growth stages, the five ratio indices were highly correlated according to Pearson’s coefficient (P<0.05) with the four N status indicators for both varieties (Tables 3 and 4). The performance for NNI (R2=0.56 to 0.89) and PNU (R2=0.56 to 0.87) estimation was better than that for LNC (R2=0.34 to 0.80) and PNC (R2=0.42 to 0.83) for both varieties. The same performance was observed in the estimation results across all three growth stages (Tables 3 and 4).
The coefficients of determination (R2) for the relationships between Multiplex indices and leaf nitrogen concentration (LNC), nitrogen nutrition index (NNI), plant nitrogen concentration (PNC), and plant nitrogen uptake (PNU) for Kongyu 131 across three growth stages.

**Correlation is significant at the 0.01 level; * Correlation is significant at the 0.05 level; NS: Not significant (P>0.05).
The coefficients of determination (R2) for the relationships between Multiplex indices and leaf nitrogen concentration (LNC), nitrogen nutrition index (NNI), plant nitrogen concentration (PNC), and plant nitrogen uptake (PNU) for Longjing 21 across three growth stages.

**Correlation is significant at the 0.01 level; * Correlation is significant at the 0.05 level; NS: Not significant (P>0.05).
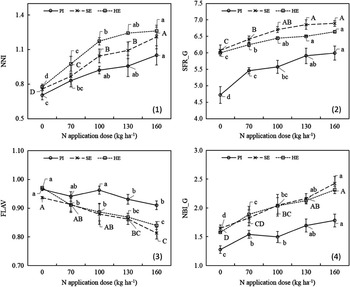
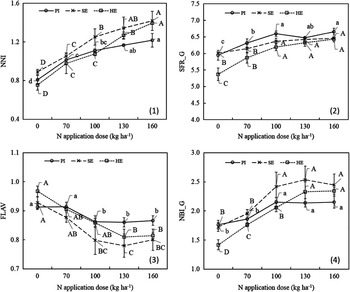
For NNI estimation, NBI_G and NBI_R showed the highest correlation, followed by FLAV, SFR_G and SFR_R (Tables 3 and 4). Figure 2 and 3 indicated that FLAV decreased with N rate for both varieties while the opposite was true for the other indices. NNI and NBI_G could differentiate different N application rates well for both varieties, followed by SFR_G and FLAV. The ANOVA results of SFR_R and NBI_R showed similar results as SFR_G and NBI_G (data not shown).
Average values of NNI (1), SFR_G (2), FLAV (3), and NBI_G (4) of rice at five different N rates at the PI, SE, and HE growth stages for the Kongyu 131 variety. The vertical line represents the standard deviation (S.D.). Means with different letters indicated that values were significantly different among N rate treatments, according to the LSD (α=0.05) test results.

Average values of NNI (1), SFR_G (2), FLAV (3), and NBI_G (4) of rice at five N rates at the PI, SE, and HE growth stages for the Longjing 21 variety. The vertical line represents the standard deviation (S.D.). Means with different letters indicated that values were significantly different among N rate treatments, according to the LSD (α=0.05) test results.

Discussion
The SFR can be considered as an important index for estimating chlorophyll concentration, which was often used as an index of area-based N canopy amount (Agati et al ., Reference Agati, Foschi, Grossi, Guglielminetti, Cerovic and Volterrani2013). The FLAV index directly reflects flavonols content, which is regulated by light regime as well as leaf thickness (Meyer et al ., Reference Meyer, Cerovic, Goulas, Montpied, Demotes-Mainard and Bidel2006). The NBI as the ratio of SFR and FLAV can be considered as a proxy of mass-based N, as well as NNI and PNU (Agati et al ., Reference Agati, Foschi, Grossi, Guglielminetti, Cerovic and Volterrani2013). This was supported by the strong relationships between SFR and PNC, and between NBI and NNI found in this study. These relationships were significantly better than those obtained using the GreenSeeker (Yao et al ., Reference Yao, Miao, Cao, Wang, Gnyp, Bareth, Khosla, Yang and Liu2014), the Crop Circle ACS 470 sensor (Cao et al ., Reference Cao, Miao, Wang, Huang, Cheng, Khosla and Jiang2013) or satellite remote sensing (Huang et al ., Reference Huang, Miao, Zhao, Yuan, Ma and Tan2015) for rice in this region. More studies are needed to further evaluate the canopy fluorescence sensor for the accuracy of rice N status diagnosis at different growth stages.
Conclusions
The results indicate that some indices provided by the Multiplex fluorescence sensor can be used to estimate rice N status at different growth stages when N is the major factor. All selected indices were highly correlated to N status indicators from the PI through HE growth stages. Especially, the two NBI indices had the highest corrections with NNI. More studies are needed to further evaluate the Multiplex canopy fluorescence sensor for the accuracy of rice N status diagnosis at different growth stages.
Acknowledgements
This study was financially supported by the National Key Research Program (2016YFD0200602) and the 973 National Basic Research Program (2015CB150405).