The coronavirus disease (COVID-19) has significantly impacted individuals, businesses, governments, organizations, and social activities on a global scale. Amid the pandemic, local and state governments in the United States used contact tracing as 1 approach to minimize the spread of the severe acute respiratory syndrome coronavirus 2 (SARS-CoV-2) within the community. Reference Spencer, Chung and Stargel1 Contract tracing is used to limit health impacts of those who have potentially been exposed, by contacting those individuals as early as possible after exposure. A key component of contact tracing is asking cases about the places they have visited and with whom they have been in proximity. Contact tracers interviewed individuals who tested positive for SARS-CoV-2, as well as the people with whom those individuals had contact. But many questions remain about important locations that people are particularly vulnerable for exposure. There have been efforts to identify “super-spreader” events, and we know that some places are more likely to be hotspots than others, but what does variation across locations look like for the prevention and spread of SARS-CoV-2?
Prior studies have utilized social network analysis to understand relationships between different variables in communities impacted by COVID-19. For example, a COVID-19 network analysis at a detention center shared findings of transmission patterns between person-to-person networks, and person-to-division networks indicated transmission clusters within a specific unit in the facility, which were then used for medical isolation. Reference Kırbıyık, Binder and Ghinai2 A network analysis conducted in Henan, China, involved COVID-19 patients and hospitals, which resulted in the detection of clustering of infected individuals and sources of transmission of COVID-19, such as during inter-hospital transfers. Reference Wang, Lu and Jin3 Another study used social network analysis and contact tracing to understand transmission of disease between patients by employing centrality measures to discover direct transmission and intermediaries. Reference Nagarajan, Muniyandi and Palani4 Contact tracing data do not always allow discovery of direct transmission, and thus we have conducted an analysis of people and places to better understand the types of hubs for transmission of COVID-19. These data help in understanding social facets, connections, and movements during the pandemic.
Thus, in this current study, we aimed to use the various types of locations visited by people who tested positive to conduct a social network analysis between people and location as well as between the locations. The analysis helped us understand the connection between types of exposed locations within San Antonio, Texas (the seventh largest city in the United States), and thus the role of those locations in the spread of the virus and its related disease.
Methods
Contact Tracing Methods
We acquired these data via a citywide contact tracing operation in San Antonio, Texas, conducted by the San Antonio campus of the School of Public Health at the University of Texas Health Science Center at Houston (UTHealth), in partnership with the local health department, the San Antonio Metropolitan Health District. Contact tracers were trained extensively, required to use a structured interview script, and monitored randomly by a quality improvement team to ensure consistent data collection. Contact tracing started with contact tracers initiating phone calls to individuals who had lab-confirmed positive tests of SARS-CoV-2. In the beginning of the phone call, contact tracers ensured the identity of these individuals with database records. During the phone call, contact tracers asked a series of structured questions to gather and document symptoms, resources needed, and people or places that the infected individual had exposed. During contact tracing, contact tracers input the data collected into the Texas Health Trace database, a state system. At the time of data collection, the following were input into the database when collected: the name of the location visited by the person who tested positive, address of that location, type or function of the building/facility, reason for the visit, presence or absence of the person’s mask use, and the date of the visit to the location. All these pertinent social and geographical pieces of data that were collected were voluntarily provided by infected individuals, and thus were not available from every infected individual. Exposed locations were inputted into the database if the infected individual was at a location during the infectious period. An individual’s infectious period was defined as up to 10 days from when the person first began displaying symptoms. 5 Contact tracers also gave recommendations to infected individuals about guidelines around isolation and social distancing.
Overview of the Data
Data on a total of 9460 infected individuals included the 11 659 places (not necessarily unique places) they visited. Some named several locations, some just 1, and some listed none between the dates of November 9, 2020, and March 14, 2021. We extracted data from the Texas Health Trace database. This time frame was based on a period when UTHealth and the Metropolitan Health District were conducting contact tracing and using the Texas Health Trace database system, and before Texas began reopening to full capacity based on the Texas governor’s orders. For this study, we excluded locations outside of Bexar County and locations for which zip codes were not discernible. We categorized the exposed locations by location/facility type such as hospitals, grocery stores, and so on. We defined 47 different types of locations in the data set.
In terms of data accuracy, it is important to note that the data collected were not originally intended for research but were collected to trace infection of COVID-19 among individuals with lab-confirmed infections in real time. Thus, while we have no gold standard to validate our data with, we recognize the real-world circumstances and consequences in which the data were collected, which provided some confidence in the accuracy of the data used in the study.
Social Network Analysis
We used the social network analysis software Pajek to conduct the analyses and to produce network graphics. We loaded spreadsheet data into Pajek with 2 columns, the person identifier, and type of facility/location. Once uploaded into Pajek, measures and graphics were generated using both 2-mode and 1-mode approaches. A 2-mode approach has connections between people and places, such that some people visited many places visited by other people—thus generating a network. The 1-mode approach turns the people into the edges or ties between the places instead of representing the people as nodes, thus generating a weighted network of only locations connected to locations. For example, if 5 people visited both a grocery store and a gym, the connection between those 2 locations would be a 5 and thus stronger (ie, weighted) than if only 1 person visited both a grocery store and a gym. We generated degree, betweenness, and authority centrality measures for the 2-mode network, and degree and betweenness centrality and path distance for the 1-mode network.
We used Fruchterman–Reingold 2D and Kamada–Kawai algorithms in Pajek to lay out the network graphics. Distances in the graphs are not based on physical distances between locations; rather, these algorithms seek node placement on the screen/page, based on particular graphical balances between having lots of ties, being connected to those with lots of ties, being a unique bridge between parts of a network, and having short paths to other points in the network. The 2-dimensional layouts employed by us force those balances of distances between nodes into a 2-dimensional space to show accurately the distances between distant nodes (ie, those that are not directly connected), but there are distortions for distances between nodes that are farther from the center—kind of like what happens with a spherical globe projection onto a flat map surface.
Co-Visited Locations
Co-visited locations were explored within the data set. Co-visited locations within this study were 2 or more locations that an individual visited while infectious. To understand co-visited locations within the data set, they needed to be imported into the software package UCINET to explore the different location combinations. The data were imported into UCINET and put into the DL editor. In the DL editor, the data format was Edgelist2 (person-to-event). Once the edge list was created, the data were converted from 2-mode to 1-mode. The method used was the sum of cross-minimums. The output data set from this method showed the connections between any 2 types of locations and the count of how many times the paired locations occurred per person. Some analyses were conducted on valued 2-mode and 1-mode networks, although we also looked merely at presence/absence of ties between locations in the 1-mode network.
Results
Descriptive Measures
Table 1 presents the percentage of total locations reported as visited by people who tested positive for SARS-CoV-2 across more than 4 months. From the months of November 2020 to March 2021, January had the highest reported exposed locations, followed by December. The remainder of the percentages (8.54%) are of those with unknown date of exposure and exposure dates that were entered outside of the time frame.
Exposed locations per month, by percentage of total

The percent of the total exposed locations are as follows: 19% school, 12% commercial store, 12% grocery store, 11% commercial services, and 11% restaurant. The reason for visit varied between 45% for work, 21% unknown, 14% other, 11% social, 5% school, and 3% health care. These categories may overlap conceptually with each other. Although the total is around 100% of reasons—with only 1 reason given per visit—we could imagine that some visits to a location could have had multiple reasons, such as an individual who works at a hospital may have been categorized by the contact tracer under “work” and not “health care.”
Network Structural Measures
Table 2 gives definitions of the measures used elsewhere in the manuscript, though more formal definitions are widely available (6).
Definitions of social network measures

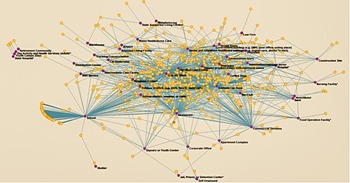
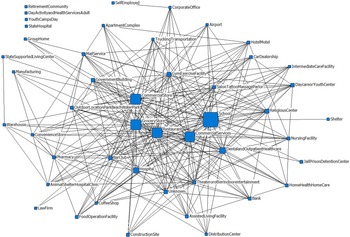
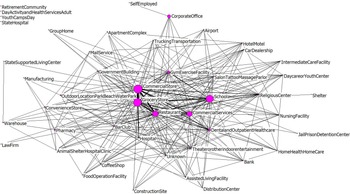
Our main interest was to create a network of people by locations and begin to understand what that network looked like. This was accomplished by creating a network map along with related centrality measures (Table 3; Figures 1–3).
Types of facility/location, by structural network measures based on 2-mode network of people to locations (top 5 bolded in each column, next highest 5 underlined for each column)

* Setting where individuals congregate (defined by state).
The 2-mode network of people (light dots) by places they visited (dark dots). Some light dots are behind others and cannot be seen. A network is created when people visit the same types of locations. This model uses the Graph Theoretic Layout in UCINET.

Network of Location Type by Location Type, by degree centrality. Node size based on degree centrality found in Table 3 (ie, degree centrality calculated from the 2-mode network not from the 1-mode location type by location type network). Node and tie placement created by using the Graph Theoretic Layout algorithm in UCINET 6.

Network of Location Type-by-Location Type, with node size based on betweenness centrality calculated on this 1-mode network. Thickness of ties indicates places that people co-visited (see also Table 5). Node and tie placement created by using the Graph Theoretic Layout algorithm in UCINET 6.

Figure 1 shows the thousands of visits people had to the 47 types of locations. Each person is a dot, and a line is created when a person visits at least 1 place during their suspected infectious period. A few people visited only 1 type of location during their supposed infectious period—school was the main type of location where this occurred. Generally, people displayed in different parts of the network map are connected to somewhat or totally different suites of location types. There is clearly at least a dozen or more types of locations with relatively few visits to them.
In Table 3, we list the types of locations by whether they are open (ie, anyone can use the location type) or closed (there are restrictions on who can enter the building, and it is generally known who the people are entering the building). Also in Table 3, we see the network structural measures created when analyzing the data that were depicted graphically in Figure 1.
Table 3 is ordered by degree centrality, or the number of times individuals named a location. In this data set, the other measures roughly mirror those of degree centrality, but some top locations that divert from that order are notable—see when an underlined value for betweenness or authority is not in the top 10 when ordered by degree.
To get a sense of which locations had connections to which other kinds of locations (rather than looking at the number of connections from each location or to it), we present in Table 4 the centrality scores associated with unvalued or binary 1-mode locations-to-locations network ties between each pair of entities. These data are also presented in Figures 2 and 3. Within only very minor exceptions, the measures track one another ordinally. Here we are using a binary (presence/absence of tie, not number of ties for each location-to-location linkage). But the authority measure we used in Table 3 requires a valued not binary network, so in Table 4 we replaced it with the average distance to any other location in terms of steps, that is, some nodes are not directly connected to others and thus require more than 1 step to get to other nodes. Using an unvalued network results in few differences ordinally between the 3 columns—specifically, the top 5 locations in betweenness centrality are a little bit differently ordered than are the other 2 columns.
Types of facility/location, by structural network measures based on 1-mode network of locations to locations (top 5 in bold in each column, next 5 or tied for 10th with underline)

* Setting where individuals congregate (defined by state).
Figure 2 presents a collapsing of the network into a 1-mode location-by-location network. We do this by making the people into ties. Thus, if any individual visited 2 locations, a tie was generated between those 2 types of locations. Nodes that fall closer to the center are frequently visited and/or help connect different sections of the network in a unique fashion. The nodes in Figure 2 are sized by how many times the locations were named by people relative to the other types of locations. The layout of the network is based on just whether or not there was a connection between 2 types of locations, as the mapping algorithm does not take into account the strength of ties or how many people constitute a link between 2 locations (ie, visited them both). Thus, there are a few moderately sized nodes that are farther away from the center.
The top 5 locations in degree centrality (ie, number of ties per node) from Table 4 can easily be seen in the center of Figure 2: school, commercial school, commercial store, grocery store, and restaurant. Nodes found near each other often have similar connections to other nodes and thus are structurally similar to one another (though, in this figure, they may not necessarily have similar strength of connections since the layout is based on present or absence of a tie not number of ties between 2 nodes).
In Figure 3, we see the same network map as in Figure 2 but with location type nodes sized by their betweenness centrality. We used the 1-mode network to calculate betweenness because we are looking for unique bridging between places rather than between people. The uniqueness of any location types as connector of other sets of location types is relatively high for a handful of location types near the center of the network graphic. Four location types were named only as individual locations—those who named those types did not visit any other locations during their specific contagious period.
Table 5 shows the nature of the connections that individuals created between locations through their movements. The counts are the number of people who tested positive for SARS-CoV-2 and visited those 2 locations during their infectious period. There were 542 total paired locations; the highest 21 pairs are shown in Table 5. The highest count of co-visited locations is 225; this indicates that 225 individuals visited both a grocery store and commercial store during their infectious period. The second highest co-visited locations are restaurant and commercial store with 122 individuals, followed by restaurant and grocery store with 105 individuals visiting both locations during their suspected infectious time. Schools are not at the top, but 3 times are in the top 7 pairs of locations and connected to the 3 locations—grocery store, restaurant, commercial store—that occupy the top 4 lines in the table.
Co-visited exposed locations

* Setting where individuals congregate, as defined by state government.
Discussion
Within the community of San Antonio, TX, the highest reported exposed locations for the study period are facilities available to the general public (eg, grocery stores) and “essential” businesses (eg, schools). Essential businesses maintained their operations throughout the pandemic, compared to non-essential businesses (eg, bars) that mainly did not stay open during at least the periods in which the Texas Governor’s office restricted certain kinds of activities (7).
The types of exposed locations reported most frequently were generally those we might think of as most essential to the average person or family. Restaurants were an exception since policy-makers did not consider them as essential to most people. But in a society that has people occupied with required school and jobs for the majority of their day, restaurants are a lifesaver for most people—and in states and municipalities that did not restrict on-site dining or the legal maximum of people allowed for on-site dining, there is little reason to believe that large portions of Americans can restrict their use of restaurants, even if just via take-out orders. In any case, policy-makers defined essential differently in different states. In Texas, Executive Order GA-14 at the end of March 2020 defined essential services as those 17 sectors identified by the United States Cybersecurity and Infrastructure Security Agency in CISA Guidance 2.0 as essential, but added religious services that cannot otherwise be conducted remotely. Restaurants were not considered essential by the U.S. Government or by the Texas governor, but Texas did allow reopening restaurants for “to go” business along with further reductions of restrictions in April through June 2020. The exception was the mask mandate July 2020 to March 2021, but, of course, the use of masks in restaurants is not very feasible and not very easily enforced.
Based on our findings, schools have the highest reported exposures. They began in-person learning in the fall of 2020, which is when our data/sample time frame began. For most non-essential businesses, there may have been greater hesitancy on the part of consumers to visit even once restrictions were lifted. Commercial services, which is a location type among the highest reported, include businesses such as electricity, plumbing, automotive, and other services. The facilities with the lowest reported locations are places that traditionally maintain less traffic.
The highest reported months for exposed locations during the study months were December and January. Holidays may increase the likelihood of individuals at more varied locations within the community and the spread of SARS-CoV-2. Additionally, the winter months in many parts of Texas could also provide better survivability for the virus.
That the rank of locations from high to low on network measures did not vary much across different measures, and that there were only 5 categories of locations that had clearly higher betweenness and degree centrality in the networks, means that focus on those categories might provide the greatest impacts from interventions. However, there were lots of different sets of co-visited locations that allow exposure to occur almost anywhere.
ln terms of pairs of co-visited location types, the highest paired locations that individuals visited were public places within the community. Commercial store, grocery store, restaurants, and schools were among the locations that people visited when they had also visited another location during their suspected infectious period. These are locations that individuals regularly visited for work, education, and necessities. With advanced technologies, some of these locations were more-or-less virtual during the time frame of the study, such as curbside grocery and curbside retail shopping, take-out from restaurants, and school that might have been attended in person by some yet not others. As a percentage of total locations (ie, all places, not just categories or types of places), 45% of the exposed places were for work. Also, the highest co-visited location types were also among the highest exposed location types. This may indicate that these locations may need better safety protocols and precautions. Individuals who test positive for COVID-19 often don’t know they have the virus until symptoms begin or until getting tested, and they continue with their daily lives of work, school, social activities, and so on. It is crucial for workplace procedures to ensure that staff, clients, and students are regularly tested and safe.
Limitations
The study had a few limitations. Like any study based on cases only, we are not able to determine how representative our sample was of the population of reference. Further, our sample was restricted to cases that were reported and we may have missed many people with COVID-19 infections that were asymptomatic, not reported, or missed during surges of cases that the contact tracers did not contact. Even though contact tracers in this study had a standardized script, there may have been variability in how interviews were conducted and the extent to which information about exposed contacts/locations was collected. Moreover, some individuals who tested positive for COVID-19 may not have been able to recall details of all exposed locations. However, we anticipate across individuals that this recall bias does not generate a substantial patterned bias in the data. Social desirability bias may have occurred during data collection if individuals were reluctant to disclose certain exposed locations or contacts. Lastly, we do not know whether these findings are generalizable to other U.S. regions since our analyses were limited to Bexar County during a particular time in the COVID-19 pandemic, so replication is needed using data from different regions and periods. These limitations notwithstanding, the strengths of this study include a social network analysis of a large sample of COVID-19 cases and their exposed contacts, identification of specific types of locations, and a contribution to the current understanding of patterns of the COVID-19 spread.
Conclusion
The social connections people have and the places they visit have been an ongoing area of research during this pandemic. This network study reveals a glimpse of time in south Texas during the height of the COVID-19 pandemic. The efforts of case investigators and contact tracers have enabled us to see where individuals congregate and disease spreads. As the pandemic has progressed, location hotspots have shifted between businesses, schools, and homes. Through case investigations, data collection, and social network analysis, the locations collected in this study can assist with future policies in similar metropolitan locations. Not only is it important to look at frequented locations and location types, but also whether those locations are between other locations and with what other locations they are visited during the window of risk. The results can also assist with preventing possible clusters or outbreaks within similar communities. The ongoing efforts of public health professionals will continue to shed light on the spread of COVID-19.
Acknowledgments
The city of San Antonio funded the services provided during this project. Dr Gimeno Ruiz de Porras was partially funded by the Southwest Center for Occupational and Environmental Health (SWCOEH), the National Institute for Occupational Safety and Health (NIOSH) Education and Research Center at The University of Texas Health Science Center at Houston School of Public Health funded by Grant No. T42OH008421 from the (NIOSH)/Centers for Disease Control and Prevention.
Author contributions
Jones created the analysis plan and outline of the initial manuscript, oversaw the analysis, wrote part of the content, and finalized the manuscript’s preparation. Rodriguez conducted the analysis with support from Jones and wrote much of the content. Gimeno and Kurian provided supervision of the data collection, offered input into interpretation of the results, and edited the final manuscript. Tsai provided administrative support, funded the staff who conducted contact tracing, supervised data collection, and helped edit the final manuscript.
Competing interests
None.