Introduction
Sexual dimorphism—differences between males and females beyond those of the reproductive tissues—is common in many sexually reproducing species, but its presence is often difficult to assess in fossil material (Knell et al. Reference Knell, Naish, Tomkins and Hone2013). Many sexually dimorphic traits, such as behavior and coloration, do not readily fossilize, and barring exceptional preservation (e.g., Siveter et al. Reference Siveter, Sutton, Briggs and Siveter2003; Matzke-Karasz et al. Reference Matzke-Karasz, Neil, Smith, Symonova, Morkovsky, Archer, Hand, Cloetens and Tafforeau2014), paleontologists can only work with differences in mineralized hard parts. Researchers have used functional considerations, comparison with extant relatives, and biometric analyses to posit hypotheses of sexual dimorphism for a variety of extinct species, including mammals (Gingerich Reference Gingerich1981), archosaurs (Chapman et al. Reference Chapman, Galton, Sepkoski and Wall1981; Lü et al. Reference Lü, Unwin, Deeming, Jin, Liu and Ji2011), ammonoids (Makowski Reference Makowski1962), trilobites (Fortey and Hughes Reference Fortey and Hughes1998; Cederstrom et al. Reference Cederstrom, Ahlberg, Nilsson, Ahlgren and Eriksson2011), and crustaceans (Astrop et al. Reference Astrop, Park, Brown and Weeks2012). Many of these hypotheses remain tentative, however, because the sparse record of the species in question can make it difficult to account for temporal, spatial, or ontogenetic variation, especially in clades without extant representatives. Identifying sexual dimorphism in fossil species is important, because when unrecognized, it can confound species-level taxonomy (e.g., Puckett Reference Puckett1996). Moreover, sexual dimorphism is often the result of sexual selection (Andersson Reference Andersson1994), and variation in dimorphism among species can be an indicator of mating system, mating behavior, and other aspects of reproductive biology (e.g., Dunn et al. Reference Dunn, Whittingham and Pitcher2001; Van Valkenburgh and Sacco Reference Van Valkenburgh and Sacco2002).
Perhaps the taxon most amenable to broadly documenting sexual dimorphism in the geological record is the Ostracoda (Ozawa Reference Ozawa2013). Brooding of eggs or juveniles occurs throughout the major groups of ostracodes, and in these taxa females can often be distinguished by their greater lateral width or other modifications to the shell for housing young (van Morkhoven Reference van Morkhoven1962; Horne et al. Reference Horne, Danielopol and Martens1998b; Ozawa Reference Ozawa2013). An additional style of sexual dimorphism characterizes the superfamily Cytheroidea. Whether or not they brood, living species of this clade have males that are relatively more elongate than females in lateral view (van Morkhoven Reference van Morkhoven1962; Cohen and Morin Reference Cohen and Morin1990), a difference that is thought to result from the need to accommodate the large copulatory apparatus in males. Each hemipenis is composed of a large, muscular sperm pump and a copulatory organ, and together these occupy a substantial proportion of the internal volume of the posterior part of the carapace (Horne et al. Reference Horne, Danielopol and Martens1998b). In addition to well-documented sex differences in extant forms, the Cytheroidea have other advantages for the study of sexual dimorphism. Perhaps most importantly, they are microfossils and can be found in abundance in small amounts of sediment across a wide range of marine environments. Substantial sample sizes allow for statistical analysis of size and shape, permitting detection of sexes even when dimorphism is modest. In addition, ostracodes have determinate growth with a fixed number of molt stages (instars), generally nine in cytheroids (Cohen and Morin Reference Cohen and Morin1990). The molt to the adult stage is accompanied by a marked increase in the size of the hinge elements and the breadth of the inner lamella, a calcified fold that lines the inner margin of the shell (van Morkhoven Reference van Morkhoven1962). From these features, adults can be distinguished reliably from juveniles independent of body size, thus allowing researchers to isolate sexual differences from ontogenetic variation.
Here we develop cytheroidean ostracodes as a model system for analyzing sexual dimorphism in the fossil record. We present a protocol for measuring cytheroid sexual dimorphism and apply this approach comprehensively to a target fauna from the Late Cretaceous of the U.S. Coastal Plain. The long-term goal of this research project is to use sexual dimorphism as a proxy for sexual selection and to understand the macroevolutionary role of sexual selection in this clade. In order to do so, however, we address several questions necessary to validate this study system: (1) Can we reliably determine the sex of cytheroid ostracodes and thereby measure their degree of sexual dimorphism? (2) How conserved or variable are dimorphism patterns within species, genera, and the entire fauna? (3) Are size and shape dimorphism correlated, and how do they relate to other variables such as body size?
Materials and Methods
Fossil Material
Material was drawn from three large, synoptic collections: (1) the Deaderick Collection of the National Museum of Natural History, Smithsonian Institution; (2) the collections of Louisiana State University, primarily the research collection of Joseph Hazel; and (3) the personal collections of one of the authors (T.M.P.). Fossil samples are of Santonian to Maastrichtian age, collected mostly from Texas, Arkansas, Mississippi, and Alabama, with lesser representation from other areas of the U.S. Gulf and Atlantic Coastal Plains. Because most species of ostracodes—like all taxa—are rare, access to large collections is crucial. By examining more than 1000 slides, we could focus on those with very high abundance and on those unusual samples in which a typically rare taxon is well represented. We tried to maximize the number of species and genera for which we were able to estimate dimorphism, but we also opportunistically collected replicate data within species.
Individual ostracodes were digitally photographed through a dissecting microscope. We used different microscope/camera setups at each repository, but all images were spatially calibrated to the same reference microslide. Isolated ostracode valves can be oriented consistently to lateral view on any flat surface. Articulated carapaces were photographed after being placed on double-sided tape or, more often, modeling clay shaped to situate carapaces in standard lateral view.
Measuring Shape
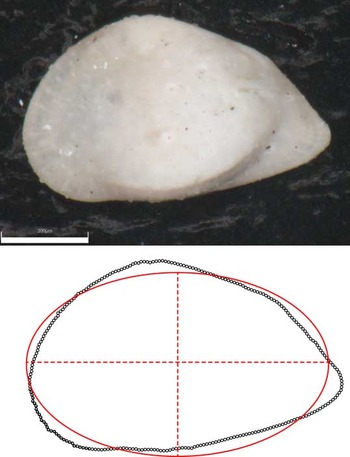
Lateral view outlines were digitized using the software TPSDig (Rohlf Reference Rohlf2013). For specimens with clear contrast with the background, we sometimes used the automatic outline algorithm in that program. But for most material we found it faster and more reliable to manually digitize using the Curves tool. The number of points in the outlines varied across specimens, and therefore outlines were subsampled to include 256 equally spaced points (Fig. 1).
Female left valve of Acuminobrachycythere acuminata shown with digitized outline (points) and fitted ellipse (solid line) with major and minor axes (dashed lines). The lengths of major and minor axes were used to measure length and height, respectively. Scale bar, 200 μm.

Small chips and breaks along the outline were reconstructed where it could be done unambiguously. Some ostracode taxa have marginal features such as spines and denticles, and these protrusions can be variably preserved. We digitized these structures as is. Taphonomic noise, while certainly present, is likely to be similar across sexes and thus should not systematically alter sex differences. We tested this by redigitizing several populations such that marginal spines were omitted, but we found this had very little effect on inferred dimorphism.
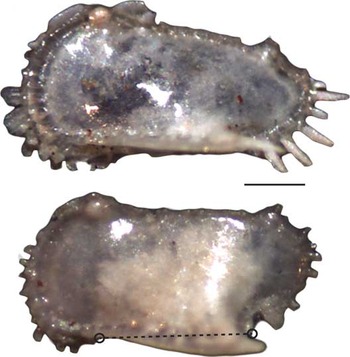
Although we found marginal spines to have little effect on inferring dimorphism, taxa whose carapaces bear well-developed lateral extensions proved more troublesome. For species of the genus Pterygocythereis with prominent ala (winglike extensions: P. serrata, P. nadeauae, P. saratogana) and some species of Amphicytherura with a prominent ventral ridge, we found that small differences in the size and orientation of these ventral extensions could greatly alter the digitized lateral outline (Fig. 2). When they protrude ventrally, these features can extend well below the ventral margin of the valve, greatly increasing the measured area and making the shape appear less elongate. We found that separate male and female clusters for these taxa were more readily discerned when the ala or ventral margins were omitted from the outlines. We accomplished this by digitizing the margin of specimens photographed from internal view. Alternatively, we used standard external lateral views but digitized two landmarks that defined the ala’s anterior and posterior extent and used an R script to remove the intervening points (Fig. 2).
Two left valves of Pterygocythereis nadeauae, drawn from the same population (PTE_NADE-1). The winglike ala in the top specimen extends laterally and does not affect the specimen outline. The ala in the bottom specimen extends more ventrally, protruding into the lateral outline. Circles indicate the landmarks that are used to digitally remove the portion of the outline from the ala. Scale bar, 200 μm.

Body size was measured as the area of the digitized outline. Shape was measured as the length to height ratio (L/H), where length and height were estimated as the major and minor axes of an ellipse fit to the outline (Fig. 1). These lengths and heights are similar to the lengths and heights traditionally employed by ostracode researchers, but we found our approach to be less subjective, because specimens did not need to be oriented by eye. Both area and L/H were natural log transformed prior to analysis.
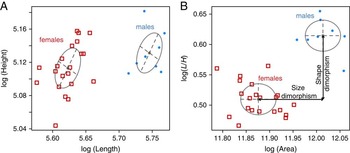
Sexual dimorphism is often examined in the ostracode literature via plots of length versus height. Here we use plots of area versus L/H, which is similar to rotating the traditional plots by 45° (Fig. 3). We found this approach more useful for several reasons. First, it decomposes male–female differences neatly into size dimorphism and shape dimorphism, which have clear biological interpretations. Because males are relatively more elongate than females in living cytheroids, the cluster with higher L/H ratios was interpreted as male. Second, we have found that using area and L/H as axes sometimes gives better statistical separation between males and females in populations with visually obvious clusters. Third, we have found that, unlike length and height, area and L/H are rarely correlated within sexes, which benefits the statistical inference, as described in the next section.
Sex clusters in a population of Phacorhabdotus texanus, as seen in plots of length versus height (A) and area versus length to height ratio. Females (open squares) and males (filled circles) shown with probability ellipses. The magnitude of sexual size dimorphism is equal to the horizontal distance between male and female means in B; sexual shape dimorphism is measured as the vertical distance between the same clusters.

Estimating Sexual Dimorphism from Mixture Models
Sex clusters were inferred using mixture models as implemented in the R package ‘mclust’ (Fraley and Raftery Reference Fraley and Raftery2002; Fraley et al. Reference Fraley, Raftery, Murphy and Scrucca2012). This approach considers combined area–L/H data as a mixture of one or more bivariate normal distributions. Parameters of these mixture models include each cluster’s mean, covariance matrix, and mixing proportion (defined as the fraction of the sample assigned to that cluster). Models with different numbers of clusters were fit via maximum-likelihood and compared using the Bayesian information criterion (BIC). Most relevant is the comparison between one-group and two-group models. We measured the support for hypotheses of sexual dimorphism as ΔBIC=BIC2 − BIC1, the support advantage of the two-group model relative to the one group model. Because ‘mclust’ reports BIC scores multiplied by −1 compared with its usual expression, positive values indicate greater support for the two-group model. Mixture models can converge on implausible solutions with a very low variance cluster when a few points happen to be close together or are nearly colinear. We used the default in ‘mclust’ that implements weak priors to avoid this behavior (Fraley and Raftery Reference Fraley and Raftery2007).
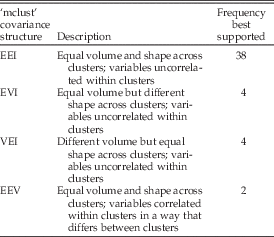
In modeling bivariate mixtures, one must specify whether the variables are correlated or not within clusters and the degree to which variance and covariance patterns are shared among clusters. Variation structure can be identical among clusters, totally different among clusters, or there can be intermediate levels of similarity in which the volume, shape, and/or orientation are the same. For multivariate data, ‘mclust’ implements 14 different models of covariance structure, all of which are described in the package documentation. To inform these modeling choices, we examined a subset of populations with the most reliable inferences of sex clusters. Specifically, we examined cases with high sample size (n≥30), clear visual clusters, and unambiguous model fits. For these n=48 highest-quality model fits, we found that only 4 of the 14 available variation/covariation models were ever best supported (Table 1).
Frequencies with which different assumptions about covariance structure implemented in ‘mclust’ are best supported among the 48 “best-case” populations. In the descriptions of covariance structure, volume and shape refer to the covariance ellipses of that model.

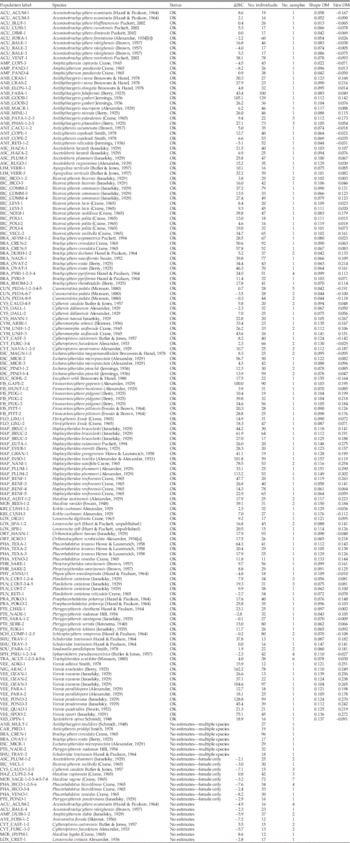
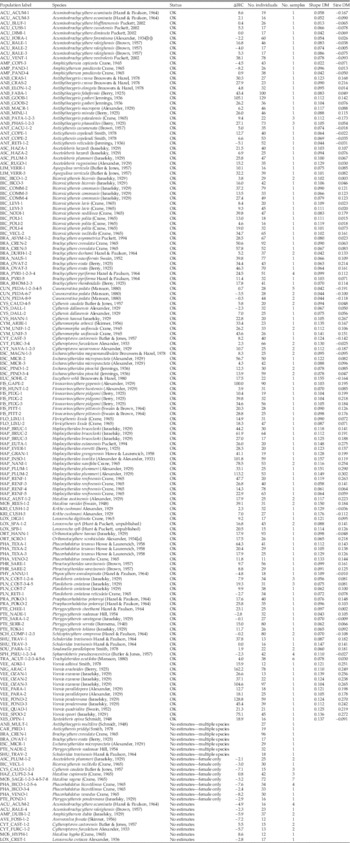
Dimorphism estimates and information about analyzed populations. Status indicates whether reasonable dimorphism estimates could be obtained ("OK") or why they could not be found. ∆BIC is the difference in support between the best one- and two-group models, with positive values indicating greater support for the two-group model. Shape dimorphism (Shape DM) and size dimorphism (Size DM) are differences between the sexes in natural log-transformed shape (L/H ratio) and size (area), respectively. Table S1 provides additional information for these populations.
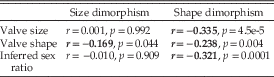
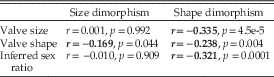
Correlations between sexual size and shape dimorphism and valve size (log of female area) and shape (log of female L/H) and the inferred sex ratio (proportion males in population). Bolded entries significant at p<0.05 level.
Two important implications follow from this short list of favored variation models. First, covariance patterns between sex clusters are always similar, and indeed identical (model EEI in Table 1) about 80% of the time. This makes biological sense, as genetic correlations between the sexes mean that they are unlikely to have radically dissimilar patterns of variation and covariation. Second, within clusters, area and L/H are uncorrelated in 46 of 48 cases. For these two exceptions, within-sex correlations between area and L/H are modest and, in one of these cases, the result of a single outlier. Together, these findings greatly reduce the number of model variations that need to be considered. For data sets smaller than the benchmark data sets included in Table 1, we often restricted the set of candidate models to those that were most often supported, especially EEI. Even for data sets in which a non-EEI model was favored, we found that assuming the EEI barely changed dimorphism estimates, and thus this assumption is unlikely to compromise dimorphism estimates.
Combining Left and Right Valves
Typically, we photographed all specimens from a species recovered in a sample. If specimens from a target species were very abundant within a sample, then we often photographed either left or right valves, typically whichever side was more abundant. In most ostracodes, left valves overlap the right, and they are correspondingly larger and usually less elongate. This left–right difference is subtle in some species but rather pronounced in others, especially in taxa such as Brachycythere and Haplocytheridea that have a dorsal extension of the valve called an accommodation groove, which increases the height of left valves. Such left–right differences must be accounted for if data from both sides of the carapace are to be combined.
Most commonly, we combined left- and right-valve data by computing the bivariate mean for specimens in each valve grouped separately and then added the difference between left and right to all the right valves. This procedure converts right-valve data to left-valve equivalents. In a few cases with low sample sizes, we used left–right offsets from other, larger samples from that species or its congeners.
When sample size is modest, one can by chance obtain rather different sex ratios in left and right valves. Mean-centering valves does not work well in such cases, because one valve’s mean will be biased toward male values while the other will be shifted toward the female mean. This bias is usually easy to recognize, because it can muddle clusters in the combined data, even when they are distinct in left and right valves viewed separately. In addition, this bias will cause left and right valves to be offset within sex clusters (Supplementary Fig. S1). In a few such cases (Supplementary Table S1), we used a different procedure to estimate the left–right offset. We wrote a custom function that (1) determines initial estimates by eye for the left–right offset and then (2) optimizes the mixture model for two groups, treating the left–right offsets (in area and L/H) as free rather than fixed parameters. In this approach, the left–right offsets are determined as those values that, jointly with other parameters, maximize the likelihood of the two-group model. This approach can produce improved estimates of left–right offset when there are skewed sex ratios between the sexes, but it does unduly favor the two-group solution. As a result, we used this approach in the relatively few cases (13%, 19/142) for which there was clear visual evidence for two sex clusters and discordant sex ratios between the valves.
Combining Samples
The unit of analysis generally consisted of specimens from a single species drawn from a single sample. In about 20% of cases (Table 2), however, it was necessary to combine multiple samples within a formation to achieve adequate sample size. If means clearly differed between samples, we computed sample offsets to center them on the first sample, similar to the procedure used to combine left and right valves.
Magnitudes and Correlates of Size and Shape Dimorphism
For each population, we considered the favored two-group model and recorded that solution if it could plausibly be interpreted to represent sexual clusters. The magnitude of sexual dimorphism was computed simply as the male mean minus the female mean, for both size (log[area]) and shape (log[L/H]) (Fig. 3). Positive values for size dimorphism indicate that males are, on average, larger than females. Because we identified males as the more elongate cluster, shape dimorphism must always be positive, with higher values indicating more extreme shape differences between the sexes. As differences on a natural log scale, our measures of dimorphism approximate proportional differences. For example, a size dimorphism of 0.1 indicates that males are about 10% larger than females in area.
Standard errors and confidence limits on dimorphism magnitudes and other parameters were generated via parametric bootstrapping. The parameter estimates of the preferred two-group solution were used to generate 2000 data sets, each of which was fit by a two-group mixture model seeded with the generating parameters as initial estimates. The 95% confidence interval (CI) on a dimorphism estimate was taken as the 2.5% and 97.5% quantiles of the resulting distribution of estimates from the bootstrapped data sets.
We used Pearson correlation coefficients and locally weighted (lowess) regressions to explore relationships among size dimorphism, shape dimorphism, sex ratios, and body size (area) and shape (L/H) of females. For these exploratory analyses, no attempt was made to account for phylogenetic dependence among the data points.
As noted earlier, left and right valves can differ systematically in size and shape, and therefore one can get somewhat different results depending on which valve is measured. The procedure described earlier for mixed left and right samples adjusts right-valve data so that the results are expressed in terms of left-valve equivalents. As a result, data from left valves and mixed left and right valves are comparable, but those from right valves are not. For the 15 populations with only right-valve data, female area and L/H data were converted to left-valve equivalents by applying a left–right offset computed from other samples from that same species. If offset estimates were not available from that species, generic means were used instead. The need to correct right-valve data only applies to the raw size and shape; neither size nor shape dimorphism require this correction, because male–female differences are always similar in both valves (e.g., Supplementary Fig. S1).
Results
Estimating Sexual Dimorphism
Of the 166 populations examined, 142 returned two-group mixture model solutions that are plausibly interpreted as sex clusters (Table 2). In over 90% of these cases (128/142), these biologically plausible solutions were also statistically favored according to BIC over the corresponding one-group solution. Even when the two-group solution was not statistically preferred, we usually have indirect support for the obtained solutions from other samples of the same or closely related species that show similar dimorphism patterns. For example, population ACU_RALE-2 from the species Acuminobrachycythere raleighensis is of modest sample size (n=17), and the two-group mixture model is not better supported than the one-group model. However, dimorphism estimates from this population are very similar to those obtained from a better sample from this species (ACU_RALE-1, n=46; Table 2). One exception is the estimate obtained for the species Physocythere annulospinata, which is the only member of the family Progonocytheridae in our data set. Our dimorphism estimates for this species, based on a modest sample of 18 individuals, are therefore somewhat provisional.
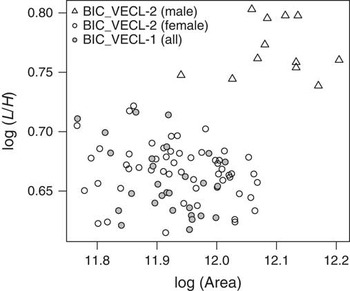
It is informative to take a closer look at the 24 samples for which we were not able to produce viable dimorphism estimates (“No estimates” in Table 2). In seven of these cases, clustering appeared to be confounded by the presence of more than one species among the sampled individuals. Additional study of these mixed samples may ultimately allow us to determine sex clusters. Some of the 17 remaining samples appeared to have rather limited shape variation and had individuals that were similar in shape to females of closely related populations. One such example comes from the species Bicornicythereis veclitella (Fig. 4). The population BIC_VECL-2 has clear sex clusters, with males more elongate and moderately larger than females. Population BIC_VECL-1, however, shows no clustering (ΔBIC=−3.0), and all its individuals plot with the female cluster from BIC_VECL-2. We hypothesize that such samples may consist entirely of females.
Individuals from two populations of Bicornicythereis veclitella. Population BIC_VECL-2 has males (open triangles) and females (open circles), whereas population BIC_VECL-1 (filled gray circles) is interpreted to consist of only females.

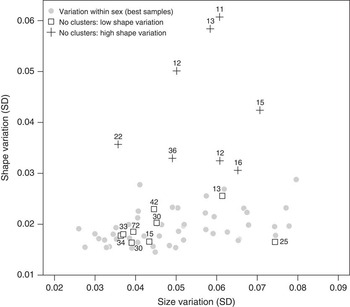
To test the hypothesis of female-only samples, we looked again to our very best samples in order to quantify typical amounts of size and shape variation seen within sexes. We plotted standard deviations for log(area) and log(L/H) within sexes for the 48 best populations described earlier (Fig. 5, gray circles). Added to this plot are the within-sample standard deviations in size and shape for the populations for which no dimorphism could be estimated, excluding the seven populations compromised by cryptic diversity. Populations hypothesized to have only female individuals (white squares) have magnitudes of within-sample variation comparable to variation observed within sexes in the best examples. Males may be absent from samples because of a failure to sample them or because the source populations lacked males and reproduced asexually. We consider this interpretation of asexuality more fully in the “Discussion.”
Size and shape variation within sexes and samples. Shown are the within-sex standard deviations for the 48 best populations—those with high sample sizes and clear clusters (filled gray circles). Other symbols show variation within entire samples in populations that did not produce viable dimorphism estimates. Some (crosses) have more shape variation than ever appears within a single sex; these are interpreted as having two sexes that we are not able to differentiate. Other populations have levels of shape variation across the whole sample that are comparable to that seen within individual sexes (open squares) and are interpreted to have only captured female individuals (see text). Numbers associated with points indicate the number of individuals in that sample.

The remaining eight populations (Fig. 5, crosses) have rather more shape variation than is ever found within a single sex in our best samples, suggesting that these populations include two sexes, even if they cannot be distinguished. Sample sizes for these putatively mixed-sex populations are modest to quite low (median n=15.5; Fig. 5), and thus it is likely that their lack of clear sex clusters is a consequence of low statistical power. This can be looked at more formally with power analysis implemented using the simulation function in the ‘mclust’ package. For example, consider the small (n=13) population from the species Cytheropteron furculatum, CYT_FURC-1-2, for which sexes could not be identified. If we take the sexual dimorphism pattern from the larger sample from this species (CYT_FURC-3-4, n=66) and simulate 1000 data sets based on these parameter estimates but with the lower sample size of CYT_FURC-1-2, we find that the two-group solution is favored by BIC only 45% of the time. Thus, we should expect that some populations with low sample sizes should not result in clear dimorphism, even when sexes are distinct.
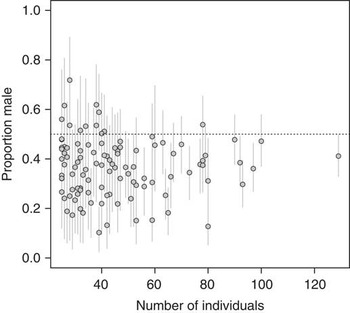
In addition to statistical support and biological plausibility, inferred sex ratios offer another check on our interpretations of sexual dimorphism. Living ostracodes typically have sex ratios that are slightly to strongly female-biased (van Morkhoven Reference van Morkhoven1962; Abe Reference Abe1990; Cohen and Morin Reference Cohen and Morin1990). These can range from nearly 50% male to less than 10% male, with most reported proportions around 30–40%. The sex ratios implied by the mixture models are very consistent with this generalization: 87% of populations are female biased, with an average proportion of males across all estimates equal to 0.37 (Fig. 6).
Inferred sex ratio (proportion male) plotted with respect to sample size. Error bars indicate 95% CIs. Dotted horizontal line indicates even sex ratios.

Variation in Dimorphism across Populations
Fauna-wide Patterns
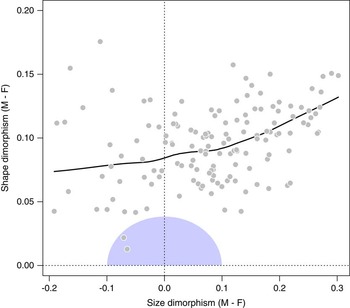
Populations across this ostracode fauna vary greatly in size and shape dimorphism (Fig. 7, Table 2). Males are usually larger than females, by about 30% in extreme cases, but can be up to 20% smaller. Males, as we identify them, are always more elongate than females, with differences in shape between the sexes that range from slight (~2%) to rather pronounced (>15%). Qualitatively, males and females are easy to distinguish by eye in strongly dimorphic populations, but sexes in populations closer to the origin in Figure 7 are difficult to discern without measurement. The shaded region of this plot includes dimorphism magnitudes that are smaller than two units of within-sex standard deviation, where size and shape standard deviations are taken as the average of the benchmark populations from Figure 5. Sex differences within this region are small enough that the underlying probability distribution is no longer bimodal, and thus males and females should be difficult to resolve without very large sample sizes.
Size dimorphism versus shape dimorphism for 142 populations of cytheroid ostracodes. Positive size dimorphism indicates males are larger than females. Black line is a locally weighted (lowess) regression. Shaded area near the origin outlines the region of dimorphism values that, given typical amounts of within-sex variation, result in distributions that are unimodal (and thus hard to detect from mixture models).

The scatter in Figure 7 indicates that size and shape dimorphism can vary independently. There is a noisy but significant relationship between the two variables (r=0.348, t=4.396, df=140, p≤0.0003). This correlation is moderately strong when size dimorphism is positive (r=0.411, t=4.68, df=108, p≤0.0001) but absent in populations with males that are smaller than females (r=−0.136, t=−0.754, df=30, p=0.456).
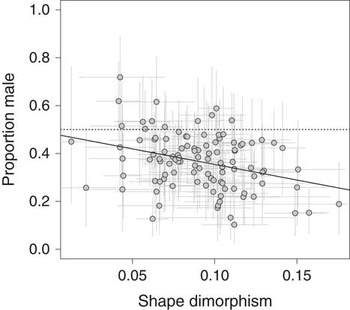
Sexual shape dimorphism is weakly but significantly correlated with valve size and shape of females, being stronger in populations with small bodies and squat shapes (Table 3, Supplementary Fig. 2). Populations with stronger shape dimorphism also tend to have more strongly skewed (female-dominated) sex ratios (Fig. 8). Size dimorphism, in contrast, has weaker and mostly nonsignificant correlations with these three variables (Table 3).
Sex ratio (proportion male) plotted against the magnitude of shape dimorphism. Error bars are 95% CIs, dotted horizontal line indicates even sex ratios, and solid line is the least-squares regression.

Patterns within Species and Genera
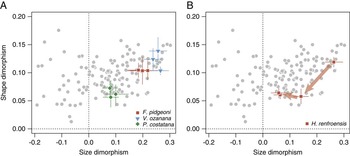
We have multiple dimorphism estimates for 35 species. Replicated dimorphism estimates are usually quite consistent within species, as illustrated by three species in Figure 9A. These replicate estimates range over different spatial and temporal spans. Three samples from Fissocarinocythere pidgeoni (Fig. 9A), restricted to the Severn Formation of Maryland, have nearly identical dimorphism estimates. The two other taxa in this panel, Planileberis costatana and Veenia ozanana (Fig. 9A), have nearly stable dimorphism patterns despite their populations spanning millions of years (late Santonian to early Campanian) and hundreds of kilometers.
Size versus shape dimorphism as in Fig. 7, with individual species highlighted. A, Data from three species for which dimorphism is consistent across replicate samples. B, Data from Haplocytheridea renfroensis, which shows marked reduction in sexual dimorphism through its history. Arrows connect older to younger populations. Error bars represent 95% confidence intervals.

The only species for which we found evidence for marked changes in dimorphism during its lifetime is Haplocytheridea renfroensis (Fig. 9B). Our oldest population, from the Blufftown Formation (early Campanian), has the very pronounced size and shape dimorphism typical of this genus (see Fig. 10). The youngest two populations, from roughly coeval Prairie Bluff Chalk (Alabama) and Arkadelphia (Arkansas) Formations of the late Maastrichtian, have much reduced magnitudes of size and shape dimorphism. A population of intermediate age, from the early Maastrichtian Ripley Formation, has reduced shape dimorphism and intermediate levels of size dimorphism.
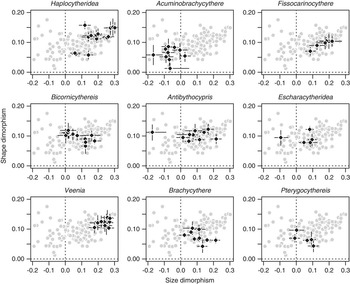
Size versus shape dimorphism as in Fig. 7, with populations from the nine genera represented by at least five dimorphism estimates highlighted. Error bars represent 95% confidence intervals.

Dimorphism patterns show greater variation within genera than species, but congeneric populations still tend to have generally similar values for size and shape dimorphism (Fig. 10). For example, in the genus Veenia, males are always much larger and more elongate than females. Acuminobrachycythere, on the other hand, has males that are about the same size or smaller than females, coupled with modest shape dimorphism. The genus Antibythocypris stands out for nearly spanning the entire range of size dimorphism values, albeit all within a narrow range of shape dimorphism.
Across the whole fauna, we noted above that size and shape dimorphism were moderately correlated, especially when males are bigger than females (Fig. 7). When genera are examined individually, a variety of relationships between size and shape dimorphism are observed (Fig. 10). In Fissocarinocythere, Haplocytheridea, and Veenia, size and shape dimorphism are positively correlated, whereas negative relationships are seen in Bicornicythereis, Brachycythere, and Pterygocythereis. For the most part, these relationships are weak, however, and other genera show no clear relationship between size dimorphism and shape dimorphism.
Discussion
Sexual Dimorphism Can Be Inferred Reliably in Fossil Cytheroids
Ostracode taxonomists have long recognized male and female morphs in certain strongly dimorphic species, including those from this fauna (e.g., Alexander Reference Alexander1932; Brouwers and Hazel Reference Brouwers and Hazel1978; Puckett Reference Puckett1994). We establish here that such male and female clusters can be discerned in nearly all species of this fauna, given sufficient data. For the relatively few cases in which no dimorphism could be estimated, the lack of sex clusters could be attributed to low samples sizes, the confounding effects of cryptic diversity, or putatively female-only populations. In short, given an adequate sample from a single species, size and shape data nearly always allowed us to confidently determine sexes.
To a greater extent than is usually possible in fossil systems, we can reject possible explanations for clustering other than sexual dimorphism. Putative male and female clusters cannot stem from ontogenetic differences, because internal features of the valves allow us to recognize and analyze individuals from the final, adult instar. Taphonomy is also unlikely to affect the inference of dimorphism. Males and females show no noticeable differences in preservation, and even when the sexes are quite distinct, their morphological differences are small compared with the range of morphologies encompassed by the taxa found within any one sample. Thus, it is difficult to see how taphonomic processes could create apparent male–female differences while at the same time allowing for the preservation of taxa that are vastly more different in size and shape. Similarly, although all of our samples have experienced some degree of time averaging, this process should not much affect our estimates of sexual dimorphism. Changes in size and shape over a time-averaged interval will increase variation, although usually by only a modest amount (Bush et al. Reference Bush, Powell, Arnold, Bert and Daley2002; Hunt Reference Hunt2004). Such noise will blur sexes together so that they may be harder to distinguish, and thus may contribute to the difficulty in establishing clusters in some samples. But time averaging by itself will not change the mean difference between males and females.
If ontogeny and taphonomy are thus eliminated as causes of statistical clustering, the only viable alternative that remains is that the clusters we interpret to be sexes actually represent different species. However, this explanation is not tenable when nearly every well-sampled species shows statistical clustering. For the presence of cryptic species to account for our results, nearly every species in the fauna would have to have a co-occurring close relative that is similar in all respects except for being somewhat more elongate. Moreover, these species pairs would need to be found in coequal abundances, with the more elongate one being slightly less frequent than the less elongate morph. All these particulars match the sex differences observed in living cytheroids but would require a string of unlikely coincidences to be explained by cryptic diversity.
More broadly, the success of finite mixture models to infer sex clusters from size and shape data in cytheroid ostracodes suggests that this general framework may also be useful for analyzing sexual dimorphism in other fossil taxa, at least for those taxa for which reasonable sample sizes can be attained.
Putatively Female-only Populations
We interpret nine populations to have sampled only female individuals on the grounds that they (1) received little support for the two-group mixture model; (2) displayed low shape variation, comparable to that seen within sexes (Figs. 5); and (3) had shapes that matched females in closely related populations. Males can go unsampled even when present in the original population when sample sizes are low. For example, if we assume a strongly skewed sex ratio of 20% males and n=15, the probability of sampling only females is not negligible (p=0.035, from the binomial distribution). This probability becomes untenably low for larger samples (p=0.0038 when n=25, and p=0.0004 when n=35), and even lower still when more typical sex ratios are used (p<0.000001 when n=35 and the proportion of males is set to the faunal average of 0.37). Thus, among the nine samples interpreted to include only females (Fig. 5), only the two with the lowest sample sizes (n=13, n=15) could feasibly be drawn from populations having both males and females. The remaining samples, however, are large enough so that is it likely that their source populations lacked males altogether.
Three of the species represented by these female-only populations are represented by other samples in our data set that include both males and females: Ascetoleberis plummeri, Bicornicythereis veclitella, and Phacorhabdotus venodus. The lack of males in some but not all well-sampled populations of a species indicates that these species reproduced asexually over parts of their range, a pattern known as geographic parthenogenesis. This condition has been observed in living marine cytheroid ostracodes, though it is rather more common in nonmarine cypridoids (Athersuch et al. Reference Athersuch, Horne and Whittaker1989; Butlin et al. Reference Butlin, Schön and Martins1998; Horne et al. Reference Horne, Baltanás and Paris1998a). Puckett (Reference Puckett2002) found a similar pattern in two species of Acuminobrachycythere for which males were recovered in nearshore facies but absent in offshore environments.
Three species remain for which we have reasonable sample sizes but for which no males seem to have been encountered: Hazelina cupiossata (n=42), Hazelina sagena (n=72), and Phacorhabdotus bicostilimus (two populations, n=67 total). These relatively high sample sizes, combined with the fact that all other species within these two genera have sex differences that are moderate to strong, suggest that the failure to detect clusters is not due to low statistical power. We have scanned additional samples and reviewed published figures for these taxa, but we have yet to see any specimens that appear to be male. Additional sampling may yet recover males for these species, or, alternatively, they may be truly asexual. Completely parthenogenetic reproduction is present but uncommon in modern marine cytheroids. In the well-known British ostracode fauna, for example, four of 111 living cytheroid species reported by Athersuch and colleagues (1989; see also Horne et al. Reference Horne, Baltanás and Paris1998a) are known only from female specimens around the British Isles, although two of these are known to be sexual in other regions. This amounts to a percentage of asexual species of 2–4%, similar to the 3% we document in this Cretaceous fauna.
An alternative explanation for the putatively female-only populations is that they are sexual but not sexually dimorphic. The very low shape variation of these samples (Fig. 5) would require that dimorphism be extremely low to absent, rather than just somewhat reduced. Moreover, whereas geographic parthenogenesis is well documented and fairly widespread among living ostracodes, we know of no reports of normally dimorphic taxa having populations with males and females with identical carapace dimensions. Thus, we consider the hypothesis of female-only populations as more consistent with the known biology of living cytheroids.
The Basis and Implications of Size and Shape Dimorphism
If we accept that the widespread finding of dimorphism within ostracodes in this fauna truly reflects differences between the sexes, can we conclude that these differences are driven by sexual selection? Sexual dimorphism is quite commonly attributed to sexual selection, so much so that the magnitude of dimorphism is commonly used as a proxy for the strength of sexual selection in macroevolutionary studies (Gage et al. Reference Gage, Parker, Nylin and Wiklund2002; Doherty et al. Reference Doherty, Sorci, Royle, Hines, Nichols and Boulinier2003; Morrow and Pitcher Reference Morrow and Pitcher2003). However, this inference should be approached cautiously, as sex differences can also arise from ecological differences between the sexes favored by ordinary natural selection (Shine Reference Shine1989). An example of the latter might be the greater development of eyes and swimming limbs in males of certain (non-cytheroidean) myodocopid ostracodes, which likely relate to their more active and dispersive ecologies relative to females, although these differences also relate to sexual roles (Cohen and Morin Reference Cohen and Morin1990). In addition, sexual dimorphism can arise through a loss (or reduction) in traits in females rather than a gain (or elaboration) of traits in females (Karubian and Swaddle Reference Karubian and Swaddle2001; Price et al. Reference Price, Lanyon and Omland2009). As trait loss in females may often result from natural selection operating against costly display traits, these patterns further indicate that sexual dimorphism will not always be a positive indicator of the strength of sexual selection.
However, in the case of valve dimorphism of cytheroidean ostracodes, several lines of evidence support sexual selection as a cause. The traditional explanation for valve dimorphism holds that male carapaces are elongated so as to accommodate their very large reproductive structures (van Morkhoven Reference van Morkhoven1962; Cohen and Morin Reference Cohen and Morin1990; Horne et al. Reference Horne, Danielopol and Martens1998b). Recently, Martins et al. (Reference Martins, Hunt, Lockwood, Swaddle and Horne2017) tested this hypothesis by assessing whether variation in valve dimorphism was correlated with the size of the hemipenis in several species of Cyprideis. (This genus is member of the Cytherideidae, a family well represented in our Cretaceous fauna.) They found that size of male valves was related to hemipenis dimensions, especially of the large and muscular sperm pump, even after controlling for the effects of overall body size. This finding supports shell dimorphism as resulting from male investment in reproduction and thus being a product of sexual selection. The high correlations with the size of the sperm pump suggest a possible relationship to the size, quantity, or transfer efficiency of sperm.
Martins et al. (Reference Martins, Hunt, Lockwood, Swaddle and Horne2017) did not find evidence that valve shape was related to male reproductive investment in Cyprideis. However, because shape varied rather little within the examined species, that study had limited power to detect such a relationship. Comparisons of larger differences across ostracode species might be more revealing. For example, Kamiya (Reference Kamiya1992) found that for sister species of the genus Loxoconcha, the more elongate form also had a proportionately larger hemipenis. Danielopol (Reference Danielopol1980) also reported that valve shape correlated with hemipenis dimensions among species of freshwater candonine ostracodes (superfamily Cypridoidea).
In the present study, the presence of more biased sex ratios in populations with stronger shape dimorphism (Fig. 8) may be an indirect indication that shape dimorphism is related to male investment. One common explanation for female-skewed populations is elevated mortality rates in males compared with females (Andersson Reference Andersson1994). Sex ratios in ostracodes often start out nearly unbiased but become more female dominated over time or ontogeny (van Harten Reference van Harten1983; Ikeya and Ueda Reference Ikeya and Ueda1988; Abe Reference Abe1990; Vandekerkhove et al. Reference Vandekerkhove, Matzke-Karasz, Mezquita and Rossetti2007), a pattern that is consistent with preferential male mortality. Elevated male mortality in some taxa may be driven by behavioral differences, especially when males are more mobile or visible to predators as they search for mates (Andersson Reference Andersson1994), but it can also be driven by physiological costs of investing in large size, weapons, ornament, or reproductive structures, or by the longer development times required to build such features (Johnstone Reference Johnstone1995). In this light, the more extreme sex ratios in populations with larger sexual shape differences may be the result of elevated male mortality associated with devoting a larger portion of the male energy budget to reproductive structures.
Sexual dimorphism with respect to body size has been particularly well studied, with good overviews of patterns of size dimorphism and the causal factors that favor one sex being larger than the other (e.g., Andersson Reference Andersson1994; Fairbairn et al. Reference Fairbairn, Blanckenhorn and Székely2007). Genetic correlation between male and female body size tends to keep them similar (Gosden et al. Reference Gosden, Shastri, Innocenti and Chenoweth2012), and dimorphism results when the balance of natural and sexual selection produces different optima for the sexes (Fairbairn Reference Fairbairn2007). The usual pattern in invertebrates is for females to be larger than males, which likely can be attributed to natural selection for fecundity coupled with a positive correlation between fecundity and female body size (Darwin Reference Darwin1871; Fairbairn Reference Fairbairn2007). We observe the opposite pattern—males larger than females—in over three-quarters of the populations in the present study. In other animal taxa, larger male size can be driven by contests among males over access to females in which larger, stronger individuals are favored (Andersson Reference Andersson1994). To our knowledge, there are no reports of direct contests between cytheroid males for access to females. The technical obstacles to observing behavior in tiny, marine animals have limited the number of taxa for which relevant observations are available (Cohen and Morin Reference Cohen and Morin1990; Horne et al. Reference Horne, Danielopol and Martens1998b), so it possible that such contests occur in some taxa. Nevertheless, males have been observed in many species to initiate mating by grabbing a female and then stimulating her into accepting the coupling by touching her with various limbs and then sexual organs (Horne et al. Reference Horne, Danielopol and Martens1998b). It is possible that large size confers some benefit to the male in successfully grabbing and immobilizing the female, or in the subsequent decision by the female as to whether or not to accept the copulation.
Large size may also be advantageous for males under sperm competition if larger males produce more or larger sperm (Andersson Reference Andersson1994). Observations of mating ostracodes have found that females will mate with multiple males (Abe and Vannier Reference Abe and Vannier1991), allowing for the possibility of sperm competition within the female reproductive tract (see discussion in Horne et al. Reference Horne, Danielopol and Martens1998b). Indeed, the finding by Martins et al. (Reference Martins, Hunt, Lockwood, Swaddle and Horne2017) that large males in species of Cyprideis tend to have especially large sperm-pumping components of the hemipenis is consistent with this mechanism of sexual selection. The evolution of sexual size dimorphism via sperm competition would be expected to be modulated by other aspects of reproductive biology, such as the degree of polyandry, as this and other factors should influence the intensity of sperm competition.
Evolutionary Patterns of Sexual Dimorphism
Patterns of sexual dimorphism do not vary much in nearly all species for which we have repeated estimates over space and time. Thus, at least for this fauna, sexual dimorphism appears to be a stable, species-level attribute. Such stasis might be seen as surprising, because investment in sexual traits should be closely tied to organismal fitness and thus potentially subject to strong natural selection. Moreover, comparisons across clades have suggested that sexually selected features can be prone to rapid and dramatic diversification (e.g., Arnqvist Reference Arnqvist1998; Emlen et al. Reference Emlen, Marangelo, Ball and Cunningham2005). However, optimal dimorphism can reflect the mating system and reproductive biology of species, and therefore species-level stability of dimorphism may follow from the conservation of these aspects of biology. We plan to pursue elsewhere a more thorough analysis of the nature of dimorphism changes within species and genera.
Among animals, there is sometimes observed a tendency for male-biased size dimorphism to become more pronounced with increasing body size, a pattern that has been called Rensch’s rule (Abouheif and Fairbairn Reference Abouheif and Fairbairn1997). The lack of a correlation between female valve size and size dimorphism (Table 3) suggests that this rule does not hold in these cytheroid ostracodes. The current standard test of Rensch’s rule relies on the allometric slope of male size versus female size, which is expected to be above unity when the rule holds (Abouheif and Fairbairn Reference Abouheif and Fairbairn1997; Blanckenhorn et al. Reference Blanckenhorn, Meier and Teder2007). This test, too, does not support Rensch’s rule; neither least-squares nor reduced major axis regressions indicate that the relevant slope differs from unity (least-squares slope=1.000, 95% CI=[0.957, 1.043]; RMA slope=1.033, 95% CI=[0.994, 1.074], RMA CI generated from 10,000 bootstrap replicates). Although Rensch’s rule appears to be common in vertebrates (Abouheif and Fairbairn Reference Abouheif and Fairbairn1997), it has been found only occasionally in arthropod groups (e.g., Blanckenhorn et al. Reference Blanckenhorn, Meier and Teder2007; Hirst and Kiorboe Reference Hirst and Kiorboe2014). As Rensch’s rule has been argued to stem from sexual selection on male size (with female size evolving as a correlated response) (Dale et al. Reference Dale, Dunn, Figuerola, Lislevand, Szekely and Whittingham2007), a rejection of this rule may imply that both male and female body sizes have been subject to sexual and natural selection.
Whereas size dimorphism has weak to zero correlations with body size or shape, sexual shape dimorphism has significant, albeit still modest, correlations with both variables (Table 3, Supplementary Fig. 1). The strongest is the negative correlation between shape dimorphism and female body size, and it only accounts for about 11% of the variation in shape dimorphism. This indicates that, rather than being explained by global scaling relationships, sexual dimorphism in size and shape are dominantly shaped by natural and sexual selection acting locally within individual lineages.
Summary
-
1. Using size and shape data from digitized outlines, we were able to infer sexual dimorphism in 142 populations from 106 cytheroid ostracode species from the Santonian through Maastrichtian of the U.S. Coastal Plain. Observations from living cytheroid species indicate that the more elongate morphs are males. The interpretation of males and females is supported by finding female-biased sex ratios in fossil populations at levels that are typical of modern populations.
-
2. We found nine populations with limited shape variation that we interpret to consist of only females. Males were never recovered for three well-sampled species (Hazelina cupiossata, Hazelina sagena, and Phacorhabdotus bicostilimus), suggesting that these species reproduced asexually, at least over the sampled parts of their range.
-
3. Dimorphism patterns were quite variable across the fauna, especially for sexual size dimorphism. Males were usually larger than females, by up to 30% in some taxa. However, in other taxa, males were similar in size to females or even up to about 20% smaller. Similarly, sexual shape dimorphism varied from modest to substantial.
-
4. Replicate samples within species produced dimorphism estimates that were nearly always quite similar over the lifetime of a species, suggesting that dimorphism generally behaves as a consistent species-level trait. Only one species, Haplocytheridea renfroensis, was found to change markedly in sexual dimorphism. Dimorphism patterns were also conserved within genera, albeit less strictly so.
-
5. Studies on extant ostracodes suggest that sexual size and shape dimorphism in cytheroids is very likely a result of sexual selection operating on male investment, along with other kinds of sexual and natural selection. Thus, this study system is one that potentially allows for tracking of the intensity of sexual selection over geological time.
Acknowledgments
This research was supported by the National Science Foundation (NSF-EAR 1424906), the Scholarly Studies program of the Smithsonian Institution, and the National Museum of Natural History. We thank C. Sanford (NMNH) and L. Smith (LSU) for assistance with collections and C. Sweeney and J. Shaw for helping to collect morphometric data. We are grateful to C. Hull, J. Huntley, and an anonymous reviewer for their careful reading of the article.
Supplementary Material
Data available from the Dryad Digital Repository: http://doi.org/10.5061/dryad.qs7ks