


What is the political legacy of a violent civil war? Can perpetrators and victims become productive citizens once the fighting stops? Policy makers are pessimistic. A recent World Bank report sees the individual impacts of civil war as so adverse that they lead to social disintegration (Collier et al. Reference Collier, Elliot, Hegre, Hoeffler, Reynal-Querol and Sambanis2003). The French foreign minister recently spoke of young exsoldiers as “a time bomb that threatens stability and growth” (BBC 2007). A New York Times editorial lamented that such youth return as “damaged, uneducated pariahs” (Editorial, 2006). Meanwhile, reintegration experts worry that excombatants face a life of crime and banditry, and remain alienated and “at war” in their own minds (Richards et al. Reference Richards, Archibald, Bah and Vincent2003; Spear Reference Spear and May2006). If these commentators are correct, then the rebuilding of society may be all the more challenging and unlikely after war, and could contribute to the well-known “conflict trap” (Collier Reference Collier2007).
Not all evidence is so gloomy. Psychologists consistently find that victims of violence are in general resilient, and a growing psychological literature finds that experiences of personal growth are more common than distress in the aftermath of violent trauma (Tedeschi and Calhoun Reference Tedeschi and Calhoun2004). A handful of studies also tie victimization by war violence to greater collective action. Wood (Reference Wood2003), for instance, argues that government violence in El Salvador prompted its victims to support and even join opposition forces out of moral outrage, whereas Bellows and Miguel (Reference Bellows and Miguel2006, Reference Bellows and Miguel2008) find that displacement and family deaths from war lead to greater political participation and awareness in Sierra Leonean households.
Little of this evidence, however, proves a causal link from violence to political engagement, and even less concerns the perpetrators. Yet, violence is endemic in the developing world; civil conflict has afflicted more than half of all nations since 1945, with one-fifth suffering ten or more years of war (Blattman and Miguel N.d.). In the burgeoning conflict literature, however, the impact of voting on violence receives more attention than the reverse (Snyder Reference Snyder2000; Wilkinson Reference Wilkinson2004).
I employ new data and a tragic natural experiment in northern Uganda to quantify the sociopolitical impacts of combat experiences and war violence. Patterns of rebel abduction during Uganda's twenty-year war appear to have generated nearly exogenous variation in recruitment. If so, causal estimates of its impact on later-life outcomes such as political participation can be identified.
The results defy expectations and suggest that forced recruitment leads to greater postwar political participation—a 27% increase in the likelihood of voting and a doubling of the likelihood of being a community leader among former abductees. Abduction, however, does not generally affect nonpolitical forms of social activity, suggesting that the effects of war on participation may be uniquely political.Footnote 1
Of course, conscription simply represents a package of war experiences: violence, military training, indoctrination, time away, and so forth. Analysis of self-reported experiences suggests that exposure to violence, in particular, violence witnessed, accounts for most of the impact of abduction on participation. No other war experiences have similar explanatory power.
This finding is good news for policy makers in wartorn nations. For social scientists, however, it presents a puzzle: why would violence lead to positive political engagement? I argue that conventional explanations—ones that focus on the costs of voting, or elite mobilization—find little support in the data. Personal interviews with local leaders and former combatants, however, reveal narratives of personal transformation that echo a psychological literature on individual growth and activation after trauma (Tedeschi and Calhoun Reference Tedeschi and Calhoun2004). I explore the alternative empirical and theoretical links between violence and voting and set out an agenda for research in political behavior and psychology.
WAR, ABDUCTION, AND POLITICS IN NORTHERN UGANDA
In 1988, a spirit medium named Joseph Kony assembled the remnants of several failed insurgent groups from northern Uganda into a new force, the Lord's Resistance Army, or LRA.Footnote 2 Locally, Kony is believed to possess great spiritual powers, and his stated goal is to seek a spiritual cleansing of the nation. Kony's movement, however, is also rooted in a long-standing political, economic, and ethnic divide. Following independence, northern peoples (including the Acholi, to which Kony and the LRA belong) dominated the military, whereas southerners dominated the commercial sector. For more than two decades, this martial power enabled a series of brutal northern dictators to govern the nation. In 1986, however, a young politician named Yoweri Museveni led a southern rebel force to overthrow the Acholi-dominated government. Several guerrilla forces in the north initially resisted Museveni's takeover, but for the most part settled for peace or were defeated by 1988. The handful of fighters that would not settle for peace gathered under Kony to continue the fight.
Despite widespread antipathy for Museveni, the LRA attracted limited support from other Acholi, and the poverty and unpopularity of the movement led to nearly complete reliance on forced recruitment. From its earliest days, the rebels looted homes and abducted youth to obtain supplies and recruits. In 1994, the Sudanese government began supplying the LRA with supplies, weapons, and territory on which to build bases—support that enlarged and invigorated a small and weak LRA. Abduction from 1995 to 2004 was large scale and indiscriminate, with 60,000 to 80,000 youth estimated to have been taken by the LRA for at least a day (Annan, Blattman, and Horton Reference Annan, Blattman and Horton2006; Pham, Vinck, and Stover Reference Pham, Vinck and Stover2007). The majority were adolescent males, although men and women of all ages were commonly taken.
Twenty percent of male abductees did not return and, sadly, can be presumed perished (as few remain with the LRA). The remaining 80% escaped, were released, or were rescued after periods of 1 day to ten years. Roughly half of these “returnees” were demobilized by the Ugandan army (the UPDF), and two in five returnees passed through a “reception center” that provided basic health services, family relocation, and reinsertion. In 2006, the Government of Uganda and the LRA reached a fragile truce. Peace talks broke down in 2008.
The two decades of instability and economic destruction in the north stand in stark contrast to the success and stability of the rest of Uganda. Outside Acholiland, violence has abated, infrastructure has expanded, HIV infection rates have fallen, and economic growth has been a robust 6% for the past decade (Government of Uganda 2007).
DATA AND MEASUREMENT
To assess the effects of combat and war violence on participation, this article compares the social and political participation of (exogenously) abducted and nonabducted youth in northern Uganda, as well as by specific war experiences within each group. Quantitative data come from Phase I of the Survey of War Affected Youth (SWAY), a representative survey of male youth (ages 14–30) in eight rural subcounties of the districts of Kitgum and Pader. Data were collected in 2005–06 by the author, a psychologist, and local research assistants.
To account for migration and mortality, the survey selected respondents from a sample frame of youth living in the region before the conflict. A total of 1,162 households were sampled from World Food Programme lists compiled in 2002, and 93% of household heads were located and interviewed. Enumerators worked with household heads to develop a roster of all youth living in the household in 1996—a year chosen because it was easily recalled as the date of the first election since 1980.
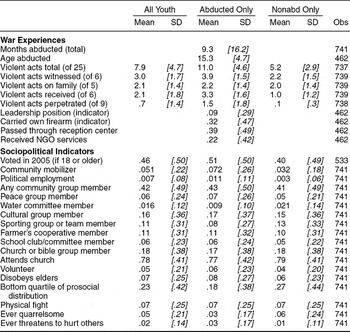
A sample of 881 surviving male youth was drawn from these retrospective rosters. Nearly half of the youth had moved since 1996 and were tracked across the region. Surveyors located 741, or 84%. Former abductees were oversampled, with 462 interviewed in total. Absentee questionnaires were conducted with the families of young men that had died or were not found to correct for observable determinants of attrition.Footnote 3 Survey summary statistics are listed in Table 1.
Summary Statistics

Note: Sample means weighted by inverse sampling and inverse attrition probabilities.
Measuring Participation
The survey includes three indicators of political participation. First, two weeks prior to the survey a national referendum was held on the question of opening Uganda to multiparty politics.Footnote 4 Forty-six percent of survey respondents older than age 18 say they Voted in the 2005 referendum, a rate comparable to national turnout levels. Second, 5% of youth report that they are a Community mobilizer—elected members of the community who are responsible for organizing the community for daily or weekly meetings.Footnote 5 Finally, four respondents (.4%) hold a Political job, such as a village councilperson.
The survey also sought indicators of community participation. Forty-two percent report Membership in any community group, including peace groups (6%), water management committees (1.6%), cultural groups (16%), sports teams (11%), farmer's cooperatives (11%), school clubs and committees (6%), and church or bible study groups (18%). Seventy-eight percent also Attend church regularly, and 5% of youth Volunteer for a community organization.
Last, the survey measured self-reported prosocial and aggressive behaviors. Acholi culture stresses obedience to elders, and 7% indicated that they Disobey elders. The survey also measured 11 self-reported prosocial behaviors (e.g., enjoying working with peers, or being helpful to the community), and we construct an indicator for those in the Bottom quartile of the prosocial distribution.Footnote 6 Finally, the survey asked whether respondents had been in a Physical fight in the past six months (7%), whether they were Ever quarrelsome (5%), and whether they Ever threatened to hurt others (2%).
Measuring War Experiences
More than two in five male youth reported an Abduction of any length. Many of these abductions were short, especially among abductees younger than 11 or older than 20. Such youth were often released after giving directions or carrying loot (Beber and Blattman Reference Beber and Blattman2008). Months Abducted ranged from 1 day to 10 years, averaging 9.3 months for a youth's longest abduction.
The LRA routinely used violence to intimidate and control civilians and abductees. To gauge respondents’ levels of exposure to violence, the survey asked about 25 of the most common Violent acts experienced, including 6 acts witnessed, 6 received, 8 perpetrated by the respondent, and 5 inflicted on family members of the respondent by the LRA.Footnote 7 The average abductee reported 11 different violent acts versus nonabductees’ 5.2 acts. Most youth, for example, witnessed killings, experienced their homes being raided, or took cover from gunfire. Among the abducted, forced labor, thrashings, and imprisonment were commonplace. Attempts to escape were punished with beatings or death, a sentence other abductees were often forced to carry out with machetes or clubs. Initiation to the LRA also involved forced violence: 25% of abductees were made to harm or kill a civilian, and 23% were made to desecrate dead bodies—a deeply held taboo. Finally, 13.5% of abductees report being forced to beat or kill family or friends. Such violence served to break down a youth's defenses, desensitize him to violence, and dissuade him from escape (Beber and Blattman Reference Beber and Blattman2008).
Other war experiences recorded include indicators for whether the youth held a Leadership position or rank (9%), ever Carried his own firearm (32%), and whether he Passed through a reception center (39%). Such centers were set up by local and international nongovernmental organizations (NGOs) after 1999 to receive youth returning from long abductions. Just 22% of abductees Received services from NGOs after returning home.
Qualitative Data
Following the survey and preliminary quantitative analysis, in 2007, I conducted semistructured interviews to explore the meaning and validity of the sociopolitical survey results. Interviews were conducted in three of the eight enumeration areas and included all survey respondents recorded as community mobilizers or having political jobs, all former abductees holding any rank, as well as a random sample of 20 respondents (half of whom voted in the 2005 referendum and half of whom did not). Interviews began with a repeat of the abduction and sociopolitical modules of the questionnaire, whereupon respondents were asked to elaborate on their closed-ended answers to explore key themes, including reasons for voting/not voting, the history of group participation and community leadership, and reasons for/for not becoming a particular group member or community leader.Footnote 8
Also interviewed in a less structured fashion were five reception center workers, six local political operatives, and two poll workers from the same three enumeration areas. These interviews focused on the role of formerly abducted youth in local politics (without revealing the positive association between abduction and participation).
Furthermore, prior to the survey in 2005, I conducted two months of unstructured interviews with approximately 120 youth (including 80 abductees), plus more than 60 community members and leaders. The interviews focused on abduction patterns, LRA organization, and return and reintegration experiences. Interviews aimed to understand the conduct of the war, investigate the validity of the causal identification strategy, and develop reintegration metrics and hypotheses. Interview subjects were typically contacted through community leaders and reception center staff. fifteen former LRA junior officers (e.g., a lieutenant) were also purposefully located via these channels.
Finally, concurrent with the survey, a psychologist and a local social worker conducted systematic, semistructured interviews and psychosocial assessments of a nonrandom subsample of 30 youth and their families. The details of this qualitative psychosocial study are reported in Annan, Brier, and Aryemo (Reference Annan, Brier and Aryemo2008), and relevant results are highlighted in this article.
THE IMPACT OF ABDUCTION ON PARTICIPATION
Empirical Strategy
Estimating the impacts of military service and war violence is a difficult task. Combatants are usually unlike noncombatants in unobservable ways, and so any comparison will conflate the impacts of war with preexisting differences that led the youth to join or be selected by the armed group. This is especially true if the characteristics associated with being a combatant (e.g., poverty, social exclusion, or malleability) are traits that also affect social consciousness or political activity.
One solution is the counterfactual approach, where a relevant control group is found for recruits. The estimated impact, however, is only as reliable as the counterfactual. Causal estimates will be unbiased only when recruitment is “conditionally unconfounded” or exogenous—that is, when all selection is on observed traits (Imbens 2004; Rosenbaum and Rubin Reference Rosenbaum and Rubin1983; Rubin Reference Rubin1978).
In most wars, such stringent conditions would not hold. Evidence from Uganda, however, suggests that the most common types of selection into armed groups are not present in the case of the LRA. First, volunteering (or self-selection) into the LRA was virtually unknown. What few volunteers did exist tended to join before 1991, and most come from a neighboring district, Gulu (and so do not influence this article's sample).
Second, interviews with the leaders of LRA raiding parties suggest that by neither design nor accident did they abduct a select group of youth. From their Sudanese bases, rebels ventured into Uganda for weeks at a time in groups of roughly 15 fighters. Raiding parties had two aims: ambushing government forces and raiding homesteads along their path for food and recruits. Abduction targets tended to be unplanned and arbitrary, and homesteads were raided regardless of wealth or makeup. Typical of East Africa, rural Acholi households live in relatively isolated homesteads in their fields, arrangements that made them particularly vulnerable to LRA raids. Rebels usually invaded such homesteads at night, abducting all able-bodied people to carry looted goods. These abduction parties were under instruction to release only young children and older adults, but to keep all adolescent and young adult males.
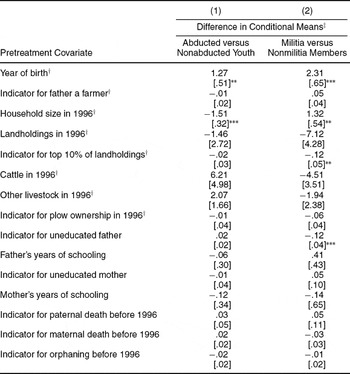
The data support these claims. The survey gathered data on prewar household wealth (including land and livestock) and parent's education, occupation, and death—traits that are believed to be reliable predictors of participation in armed groups in Africa (e.g., Cohn and Goodwin-Gill Reference Cohn and Goodwin-Gill1994; Honwana Reference Honwana2005; Humphreys and Weinstein Reference Humphreys and Weinstein2008). If we compare the abducted and nonabducted along such prewar traits, we observe little difference in conditional mean differences at even the 10% significance level (Table 2, Column 1). Abducted youth differ only by year of birth (as expected) and prewar household size.Footnote 9
Determinants of LRA Abduction and Recruitment into Government Militias

Notes: Robust standard errors in brackets, clustered by location.
All estimates weighted by inverse sampling probabilities and inverse attrition probabilities.
*Significant at 10%; **significant at 5%; ***significant at 1%.
†Mean differences include data from unfound and nonsurviving youth, and omit inverse attrition weights.
‡The unconditional difference is a simple difference in means, whereas the conditional difference is the coefficient on abduction from a weighted least squares regression of the covariate on abduction and all other pretreatment covariates.
These same household traits, however, help predict participation in a voluntary government militia, implying that if abduction were associated with these prewar traits we would have the statistical power to observe it. Five percent of youth were current or past militia members. A comparison of prewar traits shows that militia members came from poorer and more agricultural households (Table 2, Column 2), and collectively, the prewar covariates strongly predict government militia membership—the effects are larger than in the abduction case and jointly significant at the 5% level.
A remaining concern is selective attrition. There are two main types of “attritors”: nonsurvivors and unfound migrants. The 84% tracking success rate meets or exceeds the rates achieved by several “gold-standard” youth tracking surveys in poor countries (Hamory and Miguel Reference Hamory and Miguel2006; Thomas, Frankenberg, and Smith Reference Thomas, Frankenberg and Smith2001). Also, similar proportions of abducted and nonabducted youth were found (29.7% vs. 28.3%). Even so, differential attrition patterns raise concern: nonabducted youth are more like to have migrated and gone unfound, whereas abductees are uniquely likely to have been abducted and not returned (and can be assumed perished given the small number of abductees still with the LRA). Estimates of the impact of abduction will be biased if qualities that determine migration or survival also shape political action.
To correct for attrition on observables, we collected demographic data and data on current activities and well-being from the surviving family members. Following Fitzgerald, Gottschalk, and Moffitt (Reference Fitzgerald, Gottschalk and Moffitt1998), these data were used to calculate attrition probabilities, and regression estimates are weighted by the inverse of these attrition probabilities to eliminate bias from attrition on observed traits.
Results
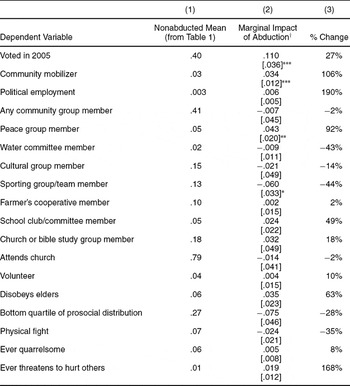
Assuming conditional unconfoundedness, consistent estimates of the causal impact of abduction can be calculated using an index model such as a logit, weighted by a nonparametric estimate of the selection probability, or propensity score (Hirano, Imbens, and Ridder Reference Hirano, Imbens and Ridder2003).Footnote 10 The results are displayed in Table 3.
Impact of Abduction on Social and Political Participation

Notes: Each item in Column 2 is the product of a separate regression.
Robust standard errors in brackets, clustered by sampling location.
†Calculated as the coefficient on an abduction dummy variable in a weighted probit regression of the dependent variable on the abduction dummy, age (including the square and cube), location dummy variables, and prewar household traits. The regression is weighted on inverse selection, sampling, and attrition probabilities.
*Significant at 10%; **significant at 5%; ***significant at 1%.
To begin, abduction leads to an 11.0 percentage point increase in the probability a youth older than 18 voted in the 2005 referendum (Column 2), significant at the 1% level. Because just 40% of eligible nonabducted youth voted (Column 1), this ATE represents a 27% increase in voter turnout (Column 3).
Abduction also leads to a 3.4 percentage point increase in the likelihood that a youth is a community mobilizer, significant at the 1% level. Just 3% of nonabducted youth are leaders, and so the impact of abduction represents a 106% increase in levels of leadership.
Abduction is also associated with a 190% increase in the likelihood of holding a political job such as a community council member or appointee. The estimate, however, is not statistically significant due to sample size: only four respondents reported such employment, three of whom are former abductees. But the direction and magnitude of the result is consistent with the other political results.
Turning to others forms of community participation, the causal impacts of abduction on various forms of group membership are either small or not statistically significant. Participation in a sporting organization is lower among abductees, although the result is only significant at the 10% level. Only in one instance, peace groups, is there a significant impact of abduction. Peace groups are clubs of youth that stage cultural dances, dramatic presentations, debates, and talks, often with peace-building or reconciliation themes, and abducted youth are nearly twice as likely to be members (92%).
Finally, there is little evidence of heightened asocial or aggressive behavior among abductees. Abductees are slightly less likely to report that they engaged in a fight or exhibit antisocial behavior, but are more likely to report that they disobey elders, threaten others, or are quarrelsome. None of these results are statistically significant. One risk, of course, is that hostile attitudes and behaviors are systematically underreported, thus increasing standard errors and biasing coefficients downward (especially if measurement error is higher among abductees). Nonetheless, even underreporting of a grand magnitude—such as two in three youth failing to report aggressiveness—would still imply that aggression is small in absolute terms.
All estimates are robust to alternative specifications, including the removal of the control variables, the nonparametric selection weights, and the attrition correction (results not displayed).
Discussion
First and foremost, the popular picture of former combatants—damaged, alienated, and potentially violent—finds little support in these data. Rather, former abductees are just as likely to belong to social groups as the nonabducted and just as unlikely to report antisocial behaviors.
Several qualitative studies echo these results. For instance, a psychosocial study of northern Ugandan youth by Annan, Brier, and Aryemo (Reference Annan, Brier and Aryemo2008) finds that abductees commonly reported problems with family or community immediately on return, but that such reintegration problems diminished rapidly with time. Families and communities were generally welcoming, and more than 95% of the abducted youth in the sample returned home. In their studies of Acholi cosmology and reconciliation processes, Baines (Reference Baines2005) and Harlacher et al. (Reference Harlacher, Xavier Okot, Obonyo, Balthazard and Atkinson2006) argue that such reintegration was facilitated by a cultural ethos of reconciliation and a public campaign for forgiveness and acceptance by public officials, religious leaders, and NGOs. Similarly high rates of community reconciliation and acceptance have also been reported in countries such as Sierra Leone (e.g., Wessells Reference Wessells2006; Williamson Reference Williamson2006).
Most surprising, the analysis suggests that abduction leads to a substantial increase in levels of political engagement. The survey's measures of political participation are admittedly limited in scope, confined to voting, community leadership, and political jobs, and hence, some caution is warranted. In each case, however, the impacts of abduction on political participation are relatively large. The increase in voting among abductees is comparable to the average effect of compulsory voting laws in a sample of 324 international elections (Blais and Dobrzynska Reference Blais and Dobrzynska1998). Abduction's impact is also orders of magnitude greater than the average impacts of canvasing and other turnout efforts in U.S. elections (Gerber and Green Reference Gerber and Green2000; Green and Gerber Reference Green and Gerber2004). Unfortunately, comparable African benchmarks do not exist.
The evidence also suggests that abductees’ community engagement is generally positive and civic in nature. Community mobilization is a productive role in the village, undertaken by the most confident and public-minded youth. Voting in the 2005 referendum was peaceful overall, and the measure received broad support, with 92% of national voters supporting the measure (IFES 2007). The survey did not track politically contentious outcomes, however, and so we cannot exclude the possibility that abductees are also more politically contentious or polarized.
We do observe some evidence of elevated aggression in abductees in the form of threats (although not in reports of fighting or asocial behavior). Self-reported threats are not significantly correlated with voting and community mobilization, however, suggesting the more aggressive youth are not the same as those that are politically active. The incidence of such hostility is also very small in absolute terms. Indeed, psychosocial studies in Uganda have emphasized the contrary: abducted youth tend to respond passively in response to harassment or aggression in order to avoid stigma, signal their peacefulness to the wider community, avoid painful memories of the war, and, in some cases, for fear of their own potential for aggression (Annan, Brier, and Aryemo Reference Annan, Brier and Aryemo2008; Veale and Stavrou Reference Veale and Stavrou2007).
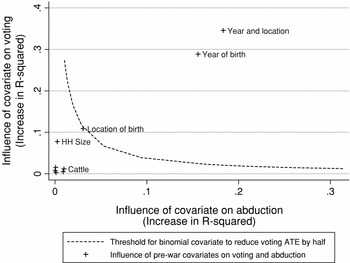
The remainder of the article explores possible rationales for the relationship between abduction and political participation. Before doing so, however, it is worth asking whether the impacts we observe could be spurious—the result of unobserved selection effects rather than changes in behavior. Several plausible sources of bias exist. For instance, the impacts on political participation would be overstated if more politically active youth were more likely to join (or be targeted by) the LRA, or if the less clever, confident, or politically engaged abductees were more likely to be killed. Although such selection is unknowable, we can engage in a thought experiment, asking how influential such bias would have to be in order to account for the effects we observe. The Appendix describes the results of two forms of formal sensitivity analysis. One analysis, displayed in Figure 1, models unobserved selection into the LRA, and finds that even an unobserved factor as influential as our primary determinants of abduction—age and location—would reduce but not eliminate the impact of abduction on voting, leaving the general conclusion intact. A second method estimates the degree of selective nonreturn from abduction that would be required to generate the impact we observe, and finds that rates of turnout among nonreturned abductees would have to be zero in order for the selection story to drive the impacts we observe. Such scenarios are extremely unlikely.
Impact of Relaxing the Assumption of Unconfoundedness

UNPACKING THE CAUSAL MECHANISM
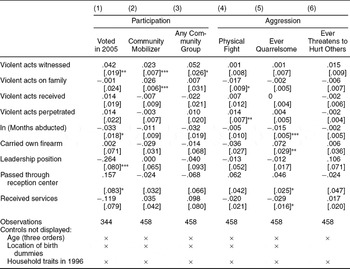
Abduction by the LRA includes a multitude of war experiences. To unpack the mechanism linking abduction to participation, we can look for relationships between participation and war experiences among former abductees. Table 4 displays regressions of a subset of the participation and aggression indicators on war experiences, including violent acts, the log of months abducted, and indicators for whether the abductee carried his own firearm, held a leadership position, passed through a reception center, or later received NGO services.
Impact of War Experiences (Former Abductees Only)

Notes: Each column represents a separate regression.
Robust standard errors in brackets, clustered by sampling location.
*Significant at 10%; **significant at 5%; ***significant at 1%.
Two caveats are in order. First, unlike abduction, war experiences may not be exogenous, meaning the estimates could be biased. War experiences, violence in particular, are also measured with error. Our indices of violence record incidence, not frequency, and so they systematically understate the number of acts ever experienced. Abductees may also not admit their most terrible experiences. Such systematic error would increase standard errors and bias the violence coefficient toward zero, in which case the Table 4 estimates should be considered a lower bound on the influence of violence on participation.Footnote 11
Results
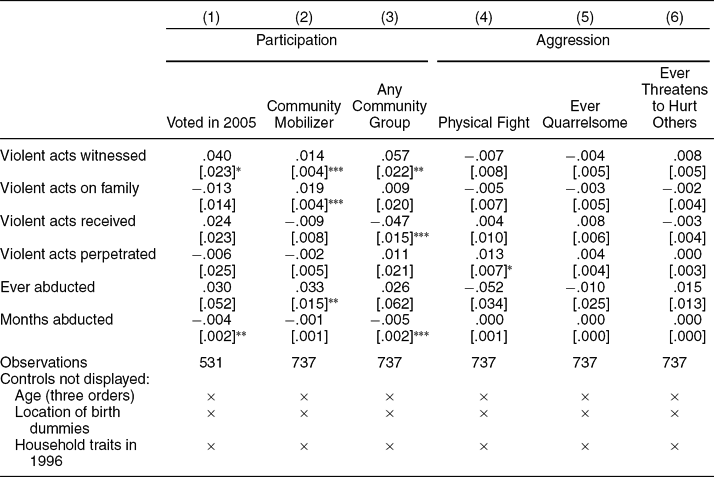
Abductees who witnessed the most acts of violence are the most likely to participate politically later in life. Each additional act of violence witnessed is associated with a 4.2 percentage point increase in the probability of voting and a 2.3 percentage point increase in the probability of being a community mobilizer, both significant at the 5% level at least (Columns 1 and 2). Are these effects large? The average abducted youth reports 1.8 more acts of violence witnessed than nonabducted youth, and so the coefficients in Table 4 imply that violence witnessed is associated with a 7 percentage point increase in voting among abductees (67% of abduction's total impact, as seen in Table 3) and a 4 percentage point increase in community mobilization (119% of abduction's impact).
We also see a somewhat significant relationship between violence witnessed and community group membership (Column 3); each act of violence witnessed is associated with a 5.2 percentage point increase in group membership, significant at the 10% level. We do not, however, see a consistently significant relationship between violence witnessed and aggression, whether measured by physical fights, quarrels, or having ever threatened others.
Abductees who experienced more family violence are also more likely to be a community mobilizer. Although the coefficient, .026, is large in absolute terms, abductees and nonabductees report nearly identical levels of family violence (Table 1). Thus, such acts cannot be responsible for the impact of abduction on political participation we observe in Table 3.
Looking at other war experiences, none are as robustly and as consistently related to our measures of political participation as is violence witnessed. Neither the violence received, violence perpetrated, nor abduction length measures consistently with political participation, community group membership, or aggression.
Having carried a firearm is not significantly related to participation. Having held a leadership position in the LRA, however, is associated with a large, 26.4 percentage point decrease in the probability of voting. There is no substantive relationship between leadership and the other measures of participation and aggression, however. Finally, former abductees who passed through a reception center are somewhat more likely to vote but not become community leaders.
Discussion
The analysis suggests that violence, especially violence witnessed, is the main mechanism by which abduction impacts participation: acts witnessed are strongly and significantly associated with voting and mobilization, acts witnessed differ between abducted and nonabducted youth, and they can account for the bulk of the impact of abduction on voting and mobilization. Violence against family is a key determinant ofparticipation among abductees, but it cannot explain the gap with nonabductees.
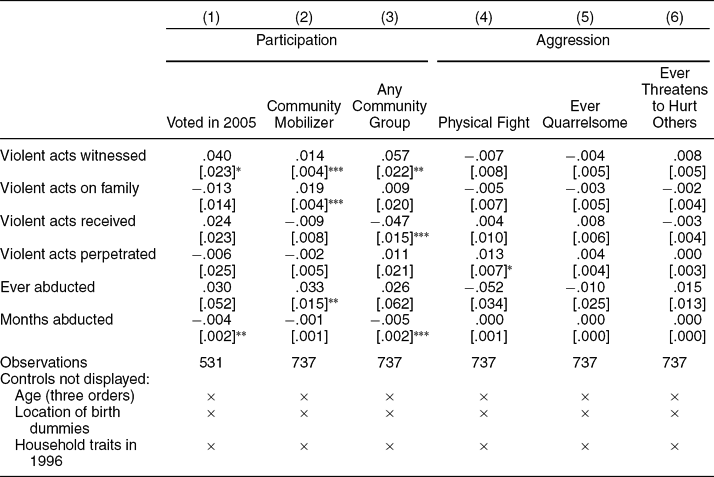
This pattern holds if we examine the relationship between abduction and violence among all youth, including the nonabducted. In a regression of voting and community mobilization on violence, abduction, and abduction length (Table 5), a youth who witnessed an additional act of violence is 4.0 percentage points more likely to vote and 1.4 percentage points more likely to be a community mobilizer. Youth whose family experiences an additional act of violence are also 1.9 percentage points more likely to be a community mobilizer. As with abductees alone, youth who receive or perpetrate greater violence do not appear to participate any more or less. Violence is not significantly associated with any of our measures of aggression in the full sample.
Impact of War Experiences on Participation (All Respondents)
Notes: Robust standard errors in brackets, clustered by sampling location.
*Significant at 10%; **significant at 5%; ***significant at 1%.
The remainder of the article explores the possible explanations between violence witnessed and political participation.
ALTERNATIVE EXPLANATIONS AND MECHANISMS
What theories of political behavior could explain such patterns? Although it is difficult to prove a particular mechanism or channel is at work with the evidence at hand, we can begin by eliminating some of the plausible alternatives.
Mobilization by Elites or NGOs
Mobilization of youth by elites, parties, and NGOs is common in Africa, and the mobilization of excombatants has been documented in instances such as the 2007 election in Sierra Leone (Christensen and Utas Reference Christensen and Utas2008). Such groups can mobilize participation using social pressure or material goods (e.g., Green and Gerber Reference Green and Gerber2004; Shachar and Nalebuff Reference Shachar and Nalebuff1999; Uhlaner Reference Uhlaner1989).
Mobilization is an unlikely account of abductee participation in Uganda, however. First, no voter mobilization efforts were observed by the author, local research assistants, or the community leaders interviewed. Indeed, at the time of the referendum, opposition parties were not yet allowed to organize, and turnout efforts are also outlawed on voting day. Second, community mobilizer elections are held outside the normal political cycle and are unrelated to party affiliation. Community members typically nominate several candidates, followed by a vote. None of the leaders interviewed could recall interference from political elites or discussion of political affiliations during these informal elections.
Third, the main indicators of interaction with NGOs—having passed through a reception center or received NGO services—are not strongly correlated with voting and community participation (Table 4). Passing through a reception center is associated with higher rates of voting (significant at only the 10% level), but the result is quite fragile to the specification employed (unlike our other results), and we were more concerned that NGO interaction would lead to community leadership positions rather than voter mobilization (of which there was none). If NGOs mobilized former abductees, they did not do so using their registries.
Finally, participation is associated with a relatively unobservable trait—violence witnessed—and not with a more easily observed marker of abduction, such as abduction itself or length of abduction. It is difficult to believe that youth were mobilized on the basis of such a hidden trait.
Differential Costs
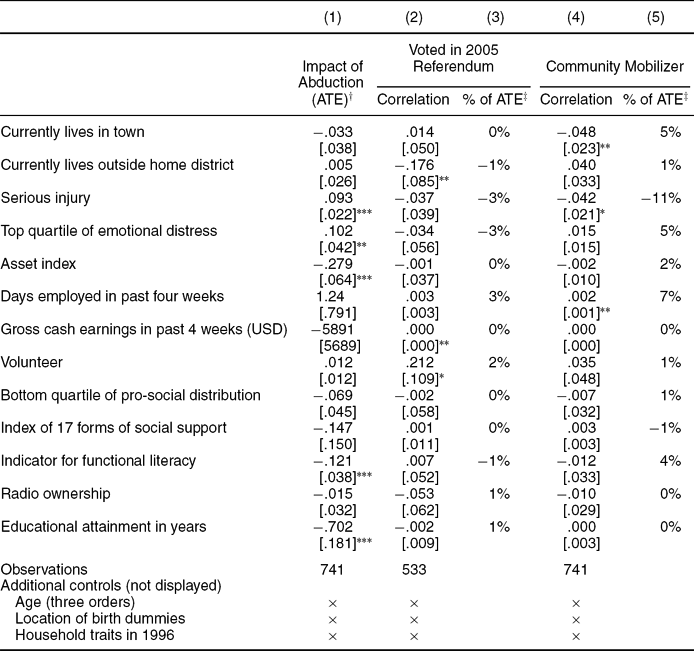
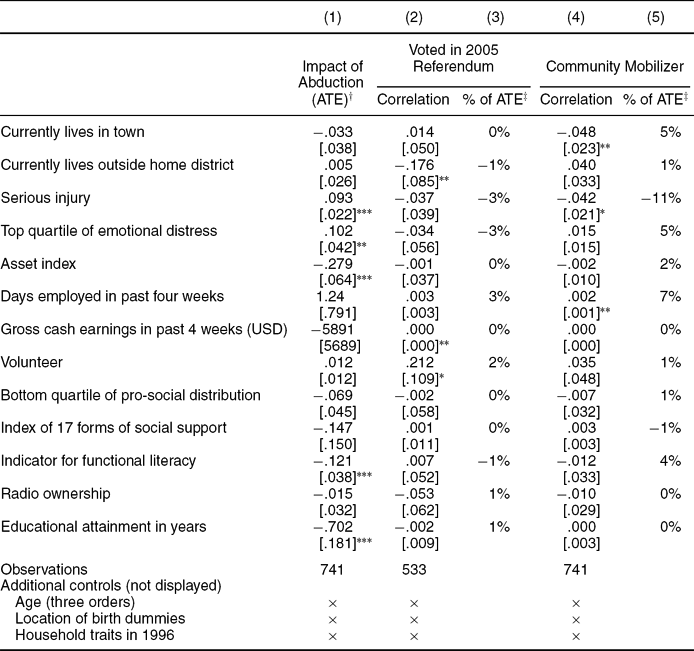
Simple rational theories of participation suggest that it is decreasing in shoe leather and opportunity costs (Feddersen Reference Feddersen2004; Riker and Ordeshook Reference Riker and Ordeshook1968). If these costs are lower among abductees, or the recipients of violence, it might account for the higher participation we observe. Proxies for higher shoe leather costs include indicators for not living in one's district of origin—for instance, having Migrated to a town or Migrated out of district. Bad health could also impede participation, measured using an Injury indicator and an indicator for being in the Top quartile of emotional distress proxy. Finally, opportunity cost is proxied by an Asset index, Days employed, and Gross earnings.
Logically, any factor responsible for the patterns we observe must meet three conditions: (1) it must differ between abducted and nonabducted youth, (2) it must be correlated with voting and mobilization, and (3) it should be associated with violence witnessed. Table 6 assesses the explanatory power of each proxy, calculating the difference between abductees and nonabductees and the correlation with three participation variables. Only one proxy, serious injuries, meets the criteria, albeit the sign is in the “wrong” direction: abductees are more likely to be injured, but injured youth are less likely to be mobilizers. Hence, abductees’ heightened leadership comes despite their costly injuries, not because of them. None of the other proxies for shoe leather and opportunity costs appear influential.
Relative Explanatory Power of the Correlates of Participation
Notes: Robust standard errors in brackets, clustered by sampling location.
*Significant at 10%; **significant at 5%; ***significant at 1%.
Figures in bold represent correlates that exhibit a statistically significant ATE (at the 5% level) in Column 1 and a statistically significant relationship with the measure of participation (either Columns 2 or 4).
†Each item in Column 1 is a separate regression. Each ATE is calculated as the coefficient on an abduction indicator variable in an ordinary least squares regression of the dependent variable on abduction and controls (age and location dummies, age/location interactions, and pretreatment individual and household characteristics). Weights include inverse sampling probabilities and inverse attrition probabilities.
‡Calculated as the ATE in Column 1 multiplied by the coefficient in Column 2, divided by the relevant ATE in Table 3.
Altered Social Preferences
Other participation theorists have proposed that individuals have altruistic preferences and take into account the benefit of their actions to others (e.g., Edlin, Gelman, and Kaplan Reference Edlin, Gelman and Kaplan2007; Feddersen and Sandroni Reference Feddersen and Sandroni2002; Harsanyi Reference Harsanyi1977, Reference Harsanyi and Hart1992). Military conditioning, or violent or near-death experiences, could in principle alter such preferences and increase participation among abductees. If so, we should observe that individuals who participate politically also make other social contributions, such as public goods management (e.g., school and water groups) or being a volunteer. We might also expect to observe higher levels of prosocial behavior, such as respectfulness and cooperation. The survey measures both Prosocial behavior and an Index of social support received. According to the estimates in Table 6, abductees do not exhibit greater social contributions or group participation, and prosocial behavior and social support are actually lower. We see no evidence of a general shifts in altruism.
Augmented Information
Finally, a set of theories proposes that informed voters are more likely to participate (e.g., Feddersen and Pesendorfer Reference Feddersen and Pesendorfer1999). Information is proxied by indicators for Functional literacy, Radio ownership, and Educational attainment, all included in Table 6. Abductees, however, are considerably less (not more) likely to be literate, educated, or own a radio. Moreover, none of these traits are closely associated with voting, suggesting that formal education and information are not the channel of impact. Naturally, this analysis does not preclude the influence of other types of information or experience. War and abduction are undoubtedly learning experiences that may transform the perceived costs and benefits of participation. But the simple education–voting correlation seen in the United States is not replicated here.
WHAT THE ABDUCTEES SAY
To better understand the role of abduction and violence in political participation, we turn to interviews with former abductees, leaders, social workers, and political party operators. As discussed previously, the qualitative evidence is limited in scope. Even so, several patterns emerged from the semistructured interviews.
First, several abducted youth described, after return, a sense of power over their lives and events. Abductees commonly witnessed terrible acts and even came close to death themselves. One youth emphasized that after such experiences, he felt he could face anything in civilian life. Another spoke of “making up for lost time”, and a third spoke of finding purpose after the violence—a sense he was “chosen”.Footnote 12
The decision to escape from the LRA in particular was framed in language of self-determination and control. Several youth described a turning point where the “scales fell from their eyes”, whereupon they realized that the propaganda fed to them by the rebel leadership—the righteousness of violence, or the seizure of the government—was false.Footnote 13 In some cases, this realization was associated with witnessing or experiencing a terrible and seemingly senseless act of violence. In a crucial act of self-determination, the youth took back control of their lives and decided to run away.
Interviews with elders and other community leaders yielded similar sentiments. According to a reception center social worker, who also worked as an election poll supervisor during the previous two elections, formerly abducted youth “feel like they can take control of their lives,” and “are subjected to hardship where. . . they mature very fast.”Footnote 14 Asked their opinion of formerly abducted youth, elders and leaders from several different villages explained that abduction (and violence in particular) is an experience that “matured” abducted youth and made them “more serious.”Footnote 15 These same terms are ones commonly used in Acholi culture to describe the difference between a boy and a man. The experience of violence was thus associated with local processes of maturation.
Not all abducted youth expressed an increased sense of control. The majority of youth (abducted or not) took pains to highlight their idleness, helplessness, and despair. At the time of the field work, respondents (like the entire district rural population) had been displaced from their homes and livelihoods for at least four years. Few places on Earth are poorer or more desperate. Abductee accounts of marginal gains in control and outlook must be considered against this backdrop of misery.Footnote 16
A second rationale for abductees’ leadership is their comfort with public speaking and airing their opinion to others. Acholi leaders commonly attributed their own role in the community, and their nomination to elected positions, to such confidence and skills. Likewise, one elder suggested that war trauma gave abducted youth “courage to speak their minds,” whereas a poll and social worker emphasized that former abductees “comfortably speak their views in a group of people or a crowd.”Footnote 17 The informants attributed these behaviors to the training and experience in the LRA, as well as the confidence borne of experience as a fighter.
Such accounts suggest a change in both perspective and ability. That is, in addition to a change in self-regard, abductees may have acquired leadership skills in the bush, and so they lead at home because they are more able (rather than simply more optimistic or confident). The evidence for skills and experience, however, is weak. First, we do not observe a strong correlation between political participation and leadership roles in the LRA. If anything, leadership is associated with less participation, at least in the form of voter turnout (Table 4). Second, there is little systematic relationship between abduction length (another reasonable proxy for experience) and political engagement. Third, if skills are the relevant channel, the link to violence witnessed is not clear. A change in personal goals, perspective, or self-regard, although impossible to prove, is more consistent with the patterns we observe.
Theoretical Interpretations
There are at least three plausible interpretations of the interview accounts. The first draws on a body of psychological research the potential for growth after traumatic experiences. Traditionally, psychologists have focused on the damaging effects of violent trauma (as well as the widespread resilience to such experiences).Footnote 18 Yet, in case after case of traumatic experience—including fatal diseases, rape, assault, house fires, plane crashes, war violence, and loss of a loved one—reports of “posttraumatic growth” experiences consistently outnumber reports of psychiatric disorders (Tedeschi and Calhoun Reference Tedeschi and Calhoun2004).
Indeed, a growing body of case evidence suggests that there are five major domains of personal growth after traumatic experiences: a greater appreciation of life and changed sense of priorities; warmer, more intimate relationships with others; a greater sense of personal strength; recognition of new possibilities or paths for one's life; and spiritual development (e.g., Emmons, Colby, and Kaiser Reference Emmons, Colby, Kaiser, Wong and Fry1998; Haidt Reference Haidt2006; Nolen-Hoeksema and Davis Reference Nolen-Hoeksema, Davis, Snyder and Lopez2002; Tedeschi and Calhoun Reference Tedeschi and Calhoun1996).
A small number of these studies look specifically at the victims of war violence, finding self-reported levels of personal growth among Yugoslav refugees (Powell et al. Reference Powell, Rosner, Butollo, Tedeschi and Calhoun2003), U.S. World War II veterans (Elder and Clipp Reference Elder and Clipp1989), U.S. prisoners of war in Vietnam (Sledge, Boydstun, and Rabe Reference Sledge, Boydstun and Rabe1980), and Israeli adolescents exposed to terror incidents (Laufer and Solomon Reference Laufer and Solomon2006). In most cases, the degree of growth is positively associated with the harshness of the violence. These studies argue that surviving a traumatic event unleashes several processes: it reveals hidden abilities and changes one's self-concept, it initiates a personal evaluation and shifts goals and priorities, and it shatters previous belief systems and leads to a struggle to make meaning from the experience.
These studies do not, however, distinguish between different forms of victimization—whether violence witnessed, received, or on the family. Accounts of posttraumatic growth also have several weaknesses: they are typically self-reported, difficult to verify, and must be taken at face value (Tennen and Affleck Reference Tennen, Affleck, Tedeschi, Park and Calhoun1998). Comparison groups are also seldom employed. The parallel to abductees’ political accounts is nonetheless striking.
A second possible interpretation come from “expressive” theories of participation, where individuals are presumed to value the act of political expression itself (Downs Reference Downs1957; Fiorina Reference Fiorina1976; Riker and Ordeshook Reference Riker and Ordeshook1968). The origin of such preferences, and the reasons for variation across people and time, are poorly understood. If posttraumatic growth theorists are correct, however, the reordering of personal goals and priorities after witnessing a traumatic event could alter one's information set, expectations, or tastes for participation in proportion to the trauma received. Like theories of posttraumatic growth, however, expressive preferences (and changes) are difficult to test or disprove. Also, the specific link to violence witnessed remains a puzzle.
Finally, traumatic events may not simply change perceptions, but actually provide concrete information and experience. Former abductees may be better informed of the costs of conflict than their peers. They have also traveled widely and met people of different countries and cultures. They have learned to fight and work as a group toward common goals, and have proven their mettle in escaping from the rebel group. Such experience may not only change the calculus of participation, but also the personal returns to collective action. Although the potential relationship between these abilities and violence received is not clear, we cannot dismiss the possibility of a link.
CONCLUSION
Survey evidence from Uganda suggests that the victims of violence are just as likely as their peers to participate socially and behave aggressively. They are considerably more likely, however, to vote and lead in their communities.
This link from violent trauma to increased participation has been observed elsewhere after war. Bellows and Miguel (Reference Bellows and Miguel2008) observe similar patterns in Sierra Leone: civilians whose household experienced a killing, maiming, or displacement are more likely to attend community meetings; more likely to join political groups; and more likely to vote than peers. Similarly, Shewfelt (Reference Shewfelt2009) interviews households in postconflict Aceh, Indonesia, and finds a strong positive correlation between an index of 43 traumatic events and political participation (e.g., political party membership) and other social groups (e.g., cultural, recreational, religious, and service groups). Finally, Carmil and Breznitz (Reference Carmil and Breznitz1990) survey Jewish Holocaust survivors alongside a control group of their Israeli peers and find that survivors support more centrist political parties and express a greater belief in God and in a better future. Thus, the link we observe in Uganda could be part of a more general phenomenon linking trauma to activation.
It is a link, however, that is difficult to decipher. Several obvious channels of impact, such as mobilization of the disaffected, find little support. Meanwhile, interviews with the youth yield narratives of newfound self-control, confidence, and skills. Such accounts, although far from conclusive, nonetheless mesh with psychological theories of posttraumatic growth and political evidence on expressive voting. The evidence thus focuses attention on a relatively unexplored area of study: the psychological foundations of political engagement, the sources of interpersonal variation, and the effects of experience, particularly traumatic experiences, on political attitudes and participation.
Such traumatic experiences are tragically common. Violence is endemic in developing countries. Among excombatants, in particular, forced recruitment and the controlled use of violence is at least as common in fighting forces as the use of voluntary participation and rewards (Beber and Blattman Reference Beber and Blattman2008; Humphreys and Weinstein Reference Humphreys and Weinstein2008; Weinstein Reference Weinstein2007). The LRA, which is frequently mischaracterized as an irrational and barbaric rebel group, is far from unique in this regard.Footnote 19 Hence, these findings may have (hopeful) implications for millions of fighters in dozens of wartorn countries, especially in Africa. To the extent that positive political engagement also springs from violence against civilians, many more millions may be affected in the same way.
There are important limits, however, on this article's results. First, the political outcomes measured in the survey are few in number, so we should take caution in generalizing the findings to political participation more broadly. The determinants of other forms of political engagement could differ. Second, the results arise from data on male Ugandan youth, and may not apply to females or older adults, or other regions. Even so, the similarity between the Ugandan results and those from refugees and victims of war violence in other countries suggests some degree of external validity. Generalization of the results awaits more data collection in more situations of violence and conflict.
Finally, a more important question remains unanswered: why in Uganda did violence lead to peaceful and productive rather than contentious participation? The answer is undoubtedly societally and institutionally specific. Several aspects of Ugandan institutions and culture may have led to the generally positive political engagement we see: a functioning, relatively democratic government at the national and local level, vigorous and open local political systems that are inclusive of youth, and a society that generally welcomed former abductees back into the community. In the absence of any of these conditions, posttraumatic participation may have been muted or even destructive. Studies of young excombatants in Sierra Leone and Liberia, for instance, are considerably less optimistic about youths’ positive political engagement, and even find evidence of violent electoral participation (Bøås and Hatløy Reference Bøås and Hatløy2006; Christensen and Utas Reference Christensen and Utas2008; Utas Reference Utas2003). There are few more important questions in politics about who works peacefully within the system, who turns to violence, and why.
Despite these caveats, this article's findings suggest some important general lessons. If nothing else, we have seen that the proclivity for participation varies among individuals, they are malleable, and they can be shaped in systematic and predictable ways. Violence and hardship may be particularly influential, and in an unexpected direction, a positive one. In this conclusion, we may have been preceded by Shakespeare: “Sweet are the uses of adversity,” he wrote, “Which like the toad, ugly and venomous/Wears yet a precious jewel in his head.”Footnote 20
APPENDIX: SENSITIVITY ANALYSIS
This appendix explores the sensitivity of the impacts of abduction (estimated in Table 3) to violations of some of the fundamental identification conditions, and illustrates that only under extreme and unlikely circumstances could the results we observe be generated by unobserved selection into the armed group, or selective attrition.
First, we can employ a method of sensitivity analysis based on Imbens (Reference Imbens2003) that explicitly models a degree of unobserved selection into the armed group. Figure 1 plots each of the observed prewar control variables on two axes: a vertical axis that indicates the increase in explained variation (i.e., the increase in the R 2 statistic) that comes from adding the control to a regression of voting on all other controls, and a horizontal axis that indicates the influence of each control in explaining variation in abduction. Influence in both is a prerequisite for inducing a selection effect. As expected, only the year and location of birth indicators substantially influence both abduction and voting.
We can also engage in a thought experiment: model a hypothetical unobserved variable U, and ask how influential it would need to be to reduce the impact on voting by a substantial amount. In essence, this U represents any source of self-selection, or selection on the part of the LRA, which we fear may lead to bias in the result. The question is then how much bias, relative to the observed covariates, would be enough to change out conclusions?
The downward sloping curve in Figure 1 represents all the combinations of (a) correlation between U and abduction, and (b) correlation between U and voting, that would be sufficient to halve the observed impact of abduction on voting.Footnote 21 The curve is therefore a threshold, beyond which our hypothetical U is influential enough to significantly reduce our result (although, we should note, still leave the direction and general magnitude of the impact intact). Only our age and location indicators exceed the threshold, implying that our hypothetical unobservable would need to be as influential as the primary determinants of abduction just to halve the observed treatment effect.
Another form of sensitivity analysis allows us to consider the potential effects of selective attrition. One option would be to follow Manski (Reference Manski1990) or Lee (Reference Lee2005) and estimate nonparametric bounds on the impact of abduction. Doing so leaves the general conclusions relatively unchanged, however, because attrition levels are nearly identical in the two groups. It is attrition patterns that differ. In particular, the abducted are uniquely likely not to return from abduction (almost all of whom can be presumed perished), whereas the nonabducted are more likely to have otherwise died, or migrated, and remain unfound.
We can perform a second thought experiment to consider whether the treatment effects we observe could be accounted for by different forms of selective attrition. For instance, what if voter turnout among nonabductees (40%) is the “true” level of turnout among all youth, observed or not? What degree of selective return from abduction would be required to lead us to erroneously observe 51% turnout among former abductees? The answer is none: rates of voter turnout among unreturned abductees would have to be zero in order for there to be no difference in turnout between abducted and nonabducted youth.Footnote 22 A hypothetical turnout of 25% among unreturned abductees, meanwhile, would be sufficient to halve the estimated impact of abduction on voting, from 11 percentage points to 5.5. Even under such extreme assumptions, the general direction, magnitude, and significance of the impacts would not change.





Comments
No Comments have been published for this article.