


Introduction
Avalanche-simulation models are increasingly important in risk and crisis management. It is common practice to use simulation models as a tool to delineate dangerous areas in hazard zoning. Two- (2-D) or three-dimensional (3-D) avalanche-simulation models offer a wide range of applications (e.g. hazard zoning, and risk and crisis management); however, a challenging model-verification process is demanded, accompanied by a reliable determination of model-input parameters. Traditional methods to measure snowpack variables (snow depth and snow density) in an avalancheprone area are time-consuming and dangerous. Usually, field observations mainly provide point information or spatial information with only a rough resolution. Several attempts to apply or develop remote-monitoring techniques have been undertaken to overcome these limitations. In contrast to the measurement of geomorphologic structures (Reference Deems, Painter and GleasonDeline and others, 2004; Reference Barbolini, Biancardi, Cappabianca, Natale and PagliardiConforti and others, 2005; Reference LuziMikoš and others, 2005), glacier surfaces (Reference Baltsavias, Favey, Bauder, Boesch and PaterakiBaltsavias and others, 2001) and ablation and accumulation of snow and ice at an annual time-scale (Reference GauerGeist and others, 2003, Reference Geist, Lutz and Stötter2005; Reference Jörg, Fromm, Sailer, Schaffhauser and GleasonLippert and other, 2006), the use of laser scanners in the field of snow and avalanche research is rare. So far only a few projects have been carried out. The aim of the Snow Avalanche Monitoring and Prognosis by Laser Equipment (SAMPLE) project was the development of a fuzzy-logic-based expert system for snow avalanche forecasting, based on terrestrial laser scanning (TLS) measurements (A. Moser and others, unpublished information). Reference Naaim, Naaim-Bouvet, Faug and BouchetProkop (2006) determined spatial snow-depth distributions in the Austrian Alps. Snow-depth mapping in a forested area has been carried out with airborne laser scanning (Reference Conforti, Deline, Mortara and TamburiniDeems and Painter, 2006). The European Union-funded GALAHAD (Advanced Remote Monitoring Techniques for Glaciers, Avalanches and Landslide Hazard Mitigation) project is aimed at a further development and application of remote-monitoring techniques (Schaffhauser and others, unpublished information). The focus lies on the use of a terrestrial laser scanner (Reference Geist, Elvehøy, Jackson and StötterJörg and others, 2006) and a ground-based interferometric synthetic aperture radar (GB SAR) (Reference Lippert, Wastl, Stötter, Moran, Geist and GeitnerLuzi and others, 2007).
For the snow- and avalanche-related sections of GALAHAD, a test site was instrumented in the Wattener Lizum, an Austrian Army training center in Tyrol, Austria (Fig. 1). The study area is equipped with four automatic weather stations (AWS) at different elevation levels, two of which also record radiation balance. In addition to the standard meteorological variables, snow depth is measured using ultrasonic sensors at the AWS and can be used to verify the TLS data. The distance in line from the remote-sensing base station in the valley bottom to the boundary of the research area is about 1900 m. The release area of the avalanche as well as the avalanche run-out zone is within the range of the laser scanner. A terrestrial laser scanner, operating in the near-infrared spectrum, measures the beams reflected from the snow surface. The penetration depth amounts to only a few millimeters (Reference Deline, Diolaiuti, Mortara, Pavan, Smiraglia and TamburiniDozier and Painter, 2004), thus allowing a high degree of accuracy. TLS measurements deliver snow depths reliably. In this paper, the measurement of the snow depth before and after an avalanche event is used to quantify the mass balance of the avalanche.
Location of Wattener Lizum test site, Tyrol, Austria.

Laser scanning provides the opportunity to measure precisely the key input parameters in avalanche simulations, such as the release depth or potential entrainment depth (Reference Conforti, Deline, Mortara and TamburiniDeems and Painter, 2006; Reference Geist, Elvehøy, Jackson and StötterJörg and others, 2006; Reference Naaim, Naaim-Bouvet, Faug and BouchetProkop, 2006). Subsequently, the release mass and the potential entrainment mass can be calculated, assuming that the mean snow densities are known. This procedure is accurate enough to assess the avalanche mass balance Schaffhauser and others, unpublished information. Up to now, both quantities have been estimated using traditional methods for the verification of avalanche-simulation models as well as for the fit of internal avalanche-simulation parameters. The importance of implementing snow entrainment in avalanche simulation and its influence on the simulation results is described by Reference Salm, Burkard and GublerSovilla and others (2001, Reference Sampl and Zwinger2007), Reference RammerSailer and others (2002) and Reference Sailer, Rammer and SamplSovilla and Bartelt (2002).
SamosAT, the latest version of SAMOS (Snow Avalanche MOdeling and Simulation (Reference RammerSailer and others, 2002; Reference Sovilla and BarteltZwinger and others, 2003; Reference Randeu, Riedler and OkornSampl and Zwinger, 2004)), is a physical avalanche-simulation model developed by the company AVL List (Graz, Austria) for the Federal Ministry of Agriculture, Forestry, Environment and Water Management in cooperation with the Austrian Federal Service for Torrent and Avalanche Control and the Federal Research and Training Center for Forests, Natural Hazards and Landscape. The assumption in SamosAT is that a dry snow avalanche has two main components, a dense flow component and a powder component. In the model, these two components are handled separately. The dense part is computed as a shallow flow in two dimensions along the terrain surface, the powder part in three dimensions as a turbulent flow of a mixture of air and ice particles of varying density. Mass and momentum transfer between the two parts is computed by a resuspension model (Reference Randeu, Riedler and OkornSampl and Zwinger, 2004). SamosAT is able to incorporate a potential entrainment mass along the avalanche path (Sailer and others, 2002). Overviews of snow entrainment and its role in avalanche-simulation models in general are given by Reference Dozier and PainterGauer and Issler (2004), Reference Mikoš, Vidmar and BrillyNaaim and others (2004), Reference Barbolini, Gruber, Keylock, Naaim and SaviBarbolini and others (2005), Naaim-Bouvet and others (2005) and Reference Gauer and IsslerGauer and others (2007).
The pulsed Doppler radar technique may be used to measure avalanche velocity, on the basis of which avalanche-simulation models, including the best parameter fit (e.g. for the entrainment process), can be validated (Reference RammerSailer and others, 2002). A dual-frequency radar (Reference ProkopRandeu and others, 1990) was designed for the acquisition of avalanche dynamics (velocity and turbulence) and manufactured at the Institute of Broadband Communication at the University of Technology, Graz. The technical principle of this pulsed Doppler radar is described by Reference Naaim-BouvetRammer (2007) and Reference Naaim-BouvetRammer and others (2007).
On 25 April 2007, an avalanche was artificially released at the GALAHAD test site Wattener Lizum (Fig. 2). The run-out length (from the fracture line to the furthest deposition) of this avalanche was about 1100 m; the respective fall height from the fracture line at 2570 ma.s.l. to the terminal run-out point in the valley bottom at 2050 ma.s.l. was 520 m. Good weather conditions before, during and after the event made several snow- and avalanche-related investigations possible (e.g. in situ density and fracture depth measurements shortly after the event).
Wattener Lizum test site: target area, instrumentation and avalanche release areas.
Our main objective here is to show the benefit of remote monitoring to avalanche simulations. The most important results are gained from TLS and field investigations to quantify the model-input parameters (i.e. snow depth and density).
Methods
Avalanche mass balance
Spatial snow-depth surveys at the Wattener Lizum test site were performed using the long-range Laser Profile Measuring system LPM-i2K manufactured by the Austrian company Riegl. The principle of TLS, together with post-processing and accuracy considerations, are described in Schaffhauser and others (unpublished information). TLS snow-depth measurements differed from ultrasonic sensor and geodetic snow-depth survey by, at most, ±0.05m. This degree of accuracy permits the measurement of the mass balance (i.e. release volume, potential entrainment volume and deposition volume) of the avalanche. The original irregular TLS point cloud of the snow surface before (t1) and after (t2) the avalanche event is represented as regular grids with a cell size p (m) and snow surfaces H t1 and H t2 (m), respectively (for details see Schaffhauser and others, unpublished information). The projected snow depth at each point is

The outline of the release area is assumed to be known, where ψi denotes to the local inclination angle of the slope. The release area is divided into n regular gridcells. The total release volume V R (m3) can be calculated with

For the calculation of the release mass M R (kg)

where ρ̄R kgm − 3 is the mean snow density.
In the current version of SamosAT, the release area is defined by an arbitrary number of sub-areas, each defined by its polygonal outline, mean snow depth and density. The mean release depth (m) for each release area j is computed according to

Both the delineation of the entire release area and the subdivision of this area must be performed manually.
The consecutive determination of the mass balance of the avalanche is based strictly on the TLS measurements of the release area, the track and the deposition zone (indicated by the index D). Similarly to Equations (2) and (3), the deposition volume V D (m3) and deposition mass M D (kg) can be calculated as

and

where, in a calculation analagous to Equation (3), d D i refers to snow-depth changes due to avalanche snow accumulation, and ρ̄D to the corresponding snow density.
The mass balance B M of an avalanche is

which takes into account the release mass and the deposition mass as well the entrainment mass M E (kg). M R and M E are negative in the mass-balance calculation. If M D and M R are identified by TLS measurements, the entrainment mass can be described as

Small-avalanche modifications and entrainment formulation in SamosAT
The dense-flow part of the avalanche is computed in SamosAT based on the 2-D, depth-averaged (shallow-water) mass and momentum balances, as in SAMOS (Reference Sovilla and BarteltZwinger and others, 2003; Reference Randeu, Riedler and OkornSampl and Zwinger, 2004). However, in SamosAT, a modified model for the bottom friction is used. The bottom shear stress τ b, directed against the flow direction, is prescribed by the relation

where τ 0 is a minimal shear stress, μ the coefficient of Coulombian friction, p b the pressure at the base and normal to the base, ρ the bulk density (fixed to a constant value of 200 kgm 3 ), u the bulk velocity and c dyn a turbulent friction coefficient.
In SamosAT, c dyn is a function of the bed roughness k and the avalanche depth d F, according to the theory of turbulent boundary layer flows at rough walls

In this equation, κ (0.43) and B (4.13) are empirical constants and a value of 0.1 m is used for k.
The aim with SamosAT is to use the same set of constants for a large variety of avalanches. The value μ = 0.155 is chosen for the Coulombian friction coefficient, which is a value for large avalanches according to established Swiss guidelines for the computation of dense-flow avalanches (Reference Rammer, Kern, Gruber and TiefenbacherSalm and others, 1990). As a consequence, the model, without τ 0, predicts excessive run-outs for small, shallow avalanches, even in cases where the turbulent friction is effective in reducing the velocity. This was the reason for introducing
the minimal shear stress τ 0, which can stop specifically shallow avalanches in terrain with an inclination angle ψ larger than arctan μ. The effect of introducing τ 0 is evident from the momentum balance for a fluid element in the flow direction, which reads
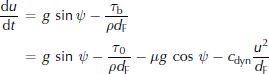
after division by the mass of the element, setting p b = ρgd cos ψ (neglecting the pressure due to centrifugal forces for brevity) and neglecting lateral forces. Hence, the acceleration is strictly negative if

(i.e. at increasingly higher inclination angles with decreasing avalanche flow depth d F).
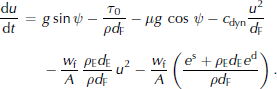
In SamosAT, it is assumed that snow entrainment occurs at the front of the avalanche only. If the depth of the entrained snow is d E and its density ρ E, the mass entrained by a fluid element per second is

with w f (m) the width of the front within the element, measured perpendicular to u. (For elements not at the front, w f is set to zero.) The entrained mass gives rise to the additional term

at the righthand side of the momentum balance (Equation (11)), where A denotes the bottom area of the fluid element. This term reflects the retarding effect of the entrained mass, resulting from having to accelerate it to the speed of the avalanche.
Furthermore, SamosAT allows us to consider an additional resistance force F ent, required to break the entrained snow
from the ground and to compress it (since the dense-flow bulk density is usually larger than the density of the entrained snow, i.e. ρ E < ρ):

In this relation, e s (Jm − 2 ) denotes the required breaking energy per fracture surface unit and e d (J kg − 1) the deformation energy per entrained mass element (s and d are superscripts, not exponents). For simplification, e d was set to 0. This resistance force yields an additional term at the right-hand side of the momentum balance, which finally reads
The model constants in SamosAT, except for τ 0, e s and e d, have been calibrated with observed, larger avalanches, for which entrainment is assumed to be of minor importance.
Parameter optimization
In order to reduce the number of simulation runs, parameter identification can be performed with the Newton algorithm for e s to fit the numerical run-out length of an avalanche branch to the observed event. In this case, the Newton algorithm solves the function R = f e s= 0 with

which represents the residuum calculated with the observed run-out length L of the avalanche branch and the corresponding simulated run-out length L̂. The residuum depends on e s and other input parameters. Here, we want to find an optimal e s for fixed values of the other input parameters. Starting with an initial guess of e s(j), an improved e s(j+1) is calculated as

The partial derivative  is approximated by finite differences:

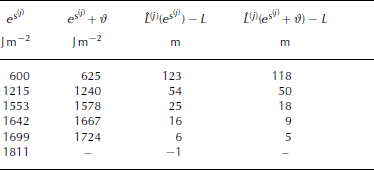
In the SamosAT model, the selected numerical disturbance ϑ must be rather large, because of the grid size (in our case 5 m), to ensure that L̂L(e s + ϑ) − L̂L(e s) ≥ 2 times the pixel size. The following iteration is proceeded until − L≤ A tol (a predefined tolerance factor), which cannot be smaller than the grid size (here, ϑ = 25 and A tol = 5 m). We are searching for the best fit of e s at τ 0 = 1125 Nm − 2 to show the difference to the best parameter fit (with τ 0 = 1125 Nm − 2), gained from the simplified gradient method (see below). With six iterations (11 simulations) − L= 1 m ≤ A tol and the root is reached (Fig. 3; Table 1). Quadratic convergence is not achieved, owing to the large ϑ, which yields a rough approximation in Equation (19).
Results of the application of the Newton method to find an optimal e s = 1811 Jm − 2 for the run-out length in profile 1 and related residuals
Map showing simulated (N) and measured (TLS) avalanche run-out. The parameter e s was optimized with the Newton method at profile 1 (τ 0 = 1125Nm − 2 and corresponding optimal e s = 1811 Jm − 2).
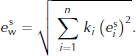
The avalanche from 25 April 2007 is characterized by two main branches, only one of which can be fitted with the algorithm described above (Fig. 4). A simplified gradient method, based on the principles of the Newton method, must be introduced to take the second branch into account. A weighted average ecan be defined for n profiles along the avalanche branches with
TLS measurements from release zone (23–25 April 2007) (a) and avalanche deposition area (25 April 2007 to summer terrain) (b).
The weighting factors 0 < k< 1 denote the weights given to each profile with
The residuum of each profile in the iteration step j is defined as

with the weighted average  used in the SamosAT simulations.
The iteration starts with an initial assumption  and the setting
 (in this case, we chose a value of ϑ = 100). The following increments of
 for j ≥ 1 are calculated as
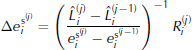
and the updated values for each profile are

According to Equation (20), the weighted average over all profiles
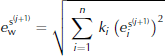
is used in the subsequent simulation. The iteration proceeds while  with
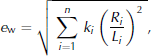
A bisection method is overlaid on the gradient method to find an optimal τ 0.
Results
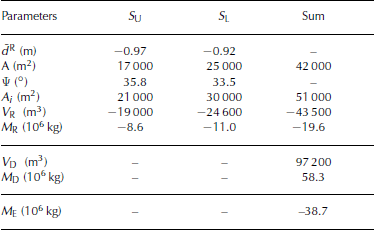
TLS data are used to derive remotely one of the key parameters for avalanche simulations: the mean snow depth d̄R (Equation (4)). The distinct release area is divided into two sub-release areas (Fig. 2). In the case of the avalanche event on 25 April 2007, this procedure is based on photo-documentation that shows two distinct sub-release areas (S U upper section and S L lower section). The projected area A (m) of S U is 17 000 m2, and that of S L is 25 000 m2. The inclined (true) area A i is 21 000 m2 for S U and 30 000 m2 for S L (Fig. 5).
Maps showing simulated (A–F) and measured (TLS) avalanche run-outs. The parameter combinations (see Table 3) were produced using the simplified gradient method (e s) and the overlaid bisection method (τ 0) for profiles 1 and 2.
The released snow volume V R of S U is 19 000m3, and that of S L is 24 600 m3. The corresponding average snow depths are –0.97m for S U and –0.92m for S L. The snow depth at the fracture line was measured in situ shortly after the event; the maximum snow depth at the fracture line was –1.85m and the mean fracture depth was –1.1 m. The snow depth and the snow density were measured at or close to the fracture line. Under late winter condtions, the snow density is relatively high and homogenously distributed over the entire slope. Eight density core profiles show a minimum snow density of 398 kgm − 3, a maximum of 470 kgm − 3 and a mean of 450 kgm − 3. The density of the deposition mass sampled from the density core ρ¯D was, as expected, even higher at approximately 600 kgm − 3. Taking into account a measured deposition volume V D of 97 200m3, the deposition mass M D was 58.3×10⁶ kg (Fig. 5). However, the entire triggered mass M R (based on S U and S L) was only 19.6× 10⁶ kg. Following the considerations of Equations (7) and (8), the difference leads to an entrainment mass of 38.7 × 10⁶ kg, which was incorporated along the path into the moving avalanche mass during the event (Table 2).
Mass-balance parameter of the avalanche from 25 April 2007 derived from TLS (for details, see Equations (1–7))
Owing to the characteristics of the avalanche of 25 April 2007, the simulations are concentrated exclusively on the dense-flow layer. This means that the simulation of the avalanche uses only the dense-flow module of SamosAT. The average snow depths d̄R used in SamosAT are calculated with Equation (4) as –0.97m for S U and –0.92m for S L. The use of these mean snow-depth values result in a V R of −48 300 m3, which differs by 4700 m3 from the V R derived from Equation (2) (i.e. −43 600 m3).
The bisection method was used to approximate τ 0, whereas Equations (22–24) were used to approximate e s. Assuming that 1125 Nm − 2 is the best choice for τ 0, five iteration steps were needed to fix e s at 1652 Jm − 2 within a reasonable time expenditure. Table 3 shows the ranking of the six best parameter combinations used to calculate the avalanche that occurred on 25 April 2007 with SamosAT. E W was calculated using Equation (25) and taking into account that the parameter test is based on two profiles (profiles 1 and 2 in Fig. 4). Equation (24) was used to derive e s with weightings of profiles 1 and 2, reflecting the relative importance of the avalanche branches, of two-thirds and one-third, respectively.
The six best parameter combinations for the minimal shear resistance τ 0 and the breaking energy e s with the weighted average of the relative errors E W
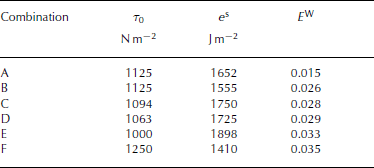
All parameter combinations showed opposite trends in the calculated run-out distance. A satisfying match on the left (profile 1), as derived from combination F, leads to a truncated run-out along profile 2 (see Fig. 4). Conversely, a good result on profile 2 involved a shortened run-out distance at profile 1 (combinations B, C and D). Parameter combination A identified the least-weighted relative error when both main avalanche branches are considered. The remaining combinations are characterized by a good fit of only one branch. The lateral spreading of each simulation is in good agreement with the observations, particularly the small gully between 2140 and 2190m (Fig. 5) marking the orographic right boundary of the lower avalanche track.
At 2210ma.s.l., a rock barrier (orographic left) and a shallow gully (orographic right) delineate the lower slope from the gently inclined and undulating region in the center. In the flatter terrain, snow accumulation occurred during the avalanche. These depositions are reproduced with the simulations as well as the depositions on the orographic left immediately below the release zone (Fig. 6). The photo-interpretation and the TLS measurements indicate a cone-like distribution of the avalanche deposition mass below the gentle gullies, while the simulated snow accumulation is concentrated along the avalanche front.
(a) Simulation result (coloured: flow depth) with parameter combination A and (b) a photo taken shortly after the event.
The velocity deduced from the photo sequence shows a total run time, from the artificial triggering to the halt of the main avalanche branch, of 50–52 s. Taking into account an avalanche track (from the stauchwall to the boundary of the deposition) of approximately 800 m, the velocity averages at 16ms − 1. The SamosAT best-guess velocity profile (Fig. 7) is characterized by three distinct maxima. The absolute velocity maximum of 25 ms − 1 is reached in the upper part of the avalanche track and is followed by a deceleration along the gently inclined area in the center. As a result of a subsequent steepening, the second velocity peak is observed after the above-mentioned rock barrier. The third peak, of approximately 23ms − 1, is reached in the lower part of the avalanche track. After 54 s, the model avalanche reaches its end position in the bottom of the valley and has an average velocity of 15ms − 1. This mean velocity is in good agreement with the velocity derived from the photo-documentation as well as those measured with Doppler radar. Four unequal long velocity profiles, each corresponding to distinct avalanche branches, were obtained from the Doppler radar, but their spatial location could not be precisely pinpointed. Figure 7 shows the velocity variances along profiles I–IV. It is assumed that radar profiles I and II are coupled with the main avalanche branch represented by profile 1 (Figs 2 and 4), and radar profiles III and IV are associated with the lateral branches. The radar velocities are slightly higher than the velocities gained from the SamosAT best-guess simulation. For example, the absolute maximum of radar profile II exceeds the corresponding third SamosAT velocity peak by 5 ms − 1. In general, the simulated acceleration and deceleration are in good agreement with the measured values.
Velocities of SamosAT simulation with parameter combination A and from Doppler radar; error bars indicate measurement uncertainties.
Conclusions And Outlook
Remote-sensing techniques, in particular the TLS measurements described here, are advanced tools for avalanche mass-balance calculations. Snow-depth changes due to initially released avalanche snow or entrainment along the track as well as avalanche depositions are calculated using the introduced method of mass-balance calculations in combination with traditional fieldwork. The deposited avalanche mass of 58.3×10⁶ kg is approximately 2.5 times larger than the release mass (19.6 × 10⁶ kg). This increase is attributed to the steady entrainment of snow along the avalanche track and within a reliable range (cf. Reference Salm, Burkard and GublerSovilla and others, 2001; Reference RammerSailer and others, 2002; Reference Sailer, Rammer and SamplSovilla and Bartelt, 2002; Reference Sampl and ZwingerSovilla and others, 2007). A study of TLS measurement validation (Schaffhauser and others, unpublished information), based on data gained 1 day before the avalanche was triggered, underlines the reliability of the applied dataset. Consequently, the release mass, the shape (run-out and width) and the deposited mass can be used for the evaluation of avalanche-simulation models such as SamosAT. SamosAT requires a mean release depth, which is acceptable for the homogenous release zone of the investigation area. However, complex topographies lead in general to heterogeneous snow-depth distributions. The next software update of SamosAT will allow the measured, heterogeneous depth distribution to be taken into account, both for the release area and the entrainment area.
Two approximation methods are applied to structure the parameter fit and reduce the number of simulations. The Newton method requires approximately 11 simulations and subsequent data post-processing routines. This method can be used to find an exact match between measurement and simulation, but only for one profile (e.g. see Fig. 3) and one parameter. The gradient of the residuum can be approximated only roughly because of the relatively large grid size of the SamosAT model and the resulting loss of quadratic convergence of the iterations.
According to the nature of the avalanche that was artificially triggered on 25 April 2007, a simplified gradient method is introduced for parameter identification by taking up information from two profiles. In general, it is not possible to find an exact match using this method, but an optimization for more than one profile is shown in Figure 4. Here, as the gradient is approximated with information from a previous iteration, the number of simulations can be halved. In our case, five simulations lead to a satisfying result with a relative error E W = 0.015. The proposed simplified gradient method is robust against runout disturbances which are mainly caused by topographic effects. A bisection method was overlaid to find an optimal τ 0. This additional parameter fit improves the results significantly, but an increasing number of simulations have to be taken into account.
The best parameter fit with τ 0 = 1125Nm − 2 and e s = 1652 Jm − 2 leads to a satisfying avalanche simulation with SamosAT. The introduction of e s and τ 0 to SamosAT was an important step towards the improvement of avalanche simulations. The mean avalanche velocities, based on photo-documentation and on the velocity profiles gained from Doppler radar measurements, are in good agreement with the simulated values. An accurate check of avalanche simulation results would be difficult to make without velocity information as presented here.
A complex verification process is required with 2-D and 3-D avalanche-simulation models. The first step may be performed using the methods described here, although further advancements are needed, particularly with respect to the fit of more than one model parameter. Further work should apply more sophisticated non-linear optimization methods. Reliable model verification requires reliable input parameters (e.g. release depth and release density) and fitting parameters (avalanche shape (run-out and width) and velocity). In particular, weather-independent observation of snow depth and snow density or snow water equivalent is needed.
Acknowledgements
The GALAHAD project is funded by the European Union (Specific Targeted Research Project FP6-2004-Global-3, N. 018409). We thank Colonel Knoll, commander of the military training camp in Wattener Lizum, and his team for support. We appreciate the correction work by A. Zeidler and M. Adams, as well as the helpful and constructive comments of two anonymous reviewers.



