Implications
With a larger data set and a greater diversity in diets than reported in previous publications, the current study shows that milk fatty acids (MFAs) only modestly predict methane (CH4) emissions from dairy cattle. The inclusion of dry matter intake (DMI) improves the prediction of CH4 emissions (g/day) compared with models based solely on MFA. Models combining MFA and DMI performed better than predictions based on DMI only. The traditional regression approach may not be able to reliably predict CH4 emissions, therefore, another approach explored the ability of MFA to differentiate observations within the 25% highest emissions from those within the 25% lowest emissions, however, few improvements were found.
Introduction
Of the total agriculture-related greenhouse gases emissions, ~38% derive from enteric fermentation (FAOSTAT, 2015). The relevance of these emissions and their potential impact has been highlighted by several authors (see e.g. Knapp et al., Reference Knapp, Laur, Vadas, Weiss and Tricarico2014). Mitigation alternatives have been explored in recent years and will continue to be investigated, which also requires a reliable and practical method to quantify emissions and assess decreases of it.
Several techniques have been developed to measure enteric CH4 emissions (Storm et al., Reference Storm, Hellwing, Nielsen and Madsen2012), but most of them are not applicable at the farm level, turning the attention toward possible biomarkers of enteric emissions. In this regard, the potential of MFA to predict CH4 has been studied before from direct in vivo measurements (Chilliard et al., Reference Chilliard, Martin, Rouel and Doreau2009; Dijkstra et al., Reference Dijkstra, Van Zijderveld, Apajalahti, Bannink, Gerrits, Newbold, Perdok and Berends2011; Mohammed et al., Reference Mohammed, McGinn and Beauchemin2011; Rico et al., Reference Rico, Chouinard, Hassanat, Benchaar and Gervais2016) and from meta-analysis approaches (Van Lingen et al., Reference Van Lingen, Crompton, Hendriks, Reynolds and Dijkstra2014; Castro-Montoya et al., Reference Castro-Montoya, De Campeneere, De Baets and Fievez2016).
However, two main shortcomings can be identified in preceding studies. First, models have been developed from a rather limited number of observations or from experiments including treatments directly influencing the MFA profile (e.g. fat supplements) potentially hampering a robust relation with CH4 emissions. Second, models were not validated on a data set not used for model development, and their determination coefficients reflect the variation explained by MFA as well as random effects of, for example, experiment. These two conditions impair an effective assessment of the real potential of MFA as predictors of CH4.
Furthermore, CH4 emissions have been traditionally associated with MFA by regressing the former on the MFA proportions intending to generate a prediction of the actual amount of CH4 emitted by an animal, but, so far, when efforts have been done to identify animals producing less CH4, the main focus has been on associated traits like residual feed intake (e.g. De Haas et al., Reference De Haas, Windig, Calus, Dijkstra, De Haan, Bannink and Veerkamp2011). Milk fatty acid (FA) might be an alternative to discriminate high from low emitters. This might be done by characterizing MFA by their distribution profile, rather than by their concentrations, in a similar fashion that species evenness of bacterial communities within an ecosystem is studied (e.g. Mertens et al., Reference Mertens, Boon and Verstraete2005; Marzorati et al., Reference Marzorati, Wittebolle, Boon, Daffonchio and Verstraete2008). This is of particular interest in cases where a limited number of predominant microbial species are present, coupled with a large number of microbes present in small amounts. As MFA show similar patterns with few MFA representing a large proportion of milk fat and many FAs at small concentrations, the cumulative distribution of MFA was estimated and associated with CH4 production.
In that regard, the objectives of this study were (i) to develop CH4 prediction models for CH4 expressed as daily emissions, relative to DMI and relative to milk yield from a larger number of observations and experiments; (ii) to highlight the variance of CH4 emissions that is explained exclusively by MFA; and (iii) to propose and explore a novel approach to relate changes in MFA distributions to CH4 emission categories.
Material and methods
Data set
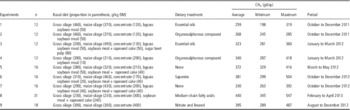
Data from nine experiments designed to study the mitigation potential of dietary components (Table 1). The data set included 145 observations from 41 Holstein-Friesian cows, after exploration for the presence of outliers five observations were removed from the data set. Eight of the experiments were carried out at ILVO (Institute for Agricultural and Fisheries Research, Belgium). The experimental procedures were approved by the ethical commission of ILVO (Agreement EC, 2011, 154). The set-up of experiment 1 is described in detail by Castro-Montoya et al. (Reference Castro-Montoya, Peiren, Cone, Zweifel, Fievez and De Campeneere2015), with all the other ones following a similar design. Briefly, cows first adapted to an experimental diet during 4 weeks. Then 10 days before the first CH4 measurements (control period) DMI was restricted to 95% of the ad libitum intake. From then, the trial lasted 6 weeks (treatment period), and CH4 was measured in weeks 0, 2, 4 and 6 by keeping the animals in individual open circuit chambers (De Campeneere and Peiren, Reference De Campeneere and Peiren2012).
Overview of experiments included in the data set used for the current study (Experiments 1 to 8, Institute for Agricultural and Fisheries Research, Belgium; Experiment 9, Aberystwyth University farm in Trawscoed, UK)

CH4=methane; DM=dry matter.
A ninth experiment was conducted at the ruminant metabolism research unit of the Trawsgoed IBERS Aberystwyth University farm in Trawscoed (UK) and has been described in detail by Veneman et al. (Reference Veneman, Muetzel, Hart, Faulkner, Moorby, Perdok and Newbold2015). All procedures used in this experiment were licensed and regulated by the United Kingdom Home Office under the Animals (Scientific Procedures) Act of 1986. Enteric CH4 was measured in open circuit chambers as explained by Veneman et al. (Reference Veneman, Muetzel, Hart, Faulkner, Moorby, Perdok and Newbold2015). A total mixed ration-based diet was offered ad libitum intake once a day (0800 h), with refusals removed just before feeding.
For all experiments, water was freely available at all times. Dry matter intake and milk production (a.m. and p.m.) were recorded daily throughout the duration of the experiment, however, only those records for CH4 measurement days were considered for this study (3 days). Milk samples were obtained at each milking, pooled by cow (weighted by production) to one sample, and stored at −20°C until being analyzed for FA composition. These analyses were done at the facilities of the Laboratory of Animal Nutrition and Animal Product Quality (LANUPRO, Belgium) as described below.
Milk FA were quantified by gas chromatography (GC) after extraction (Chouinard et al., Reference Chouinard, Girard and Brisson1997) and methylation (Stefanov et al., Reference Soyeurt, Dehareng, Gengler, McParland, Wall, Berry, Coffey and Dardenne2010) and were expressed as g/100 g of MFA methyl esters. Details of the GC condition, FAs identification and use of internal standard were according to Colman et al. (Reference Colman, Khafipour, Vlaeminck, De Baets, Plaizier and Fievez2013). One peak was found to be the result of coelution of trans-14 C18:1 and cis-9 C18:1, however, it is known that the concentration of trans-14 C18:1 is minimal compared with the amount of cis-9 C18:1 and therefore, we refer to this peak as cis-9 C18:1 only. This was verified by fractionation of aliquots of methylated samples by thin-layer chromatography on silica plates impregnated with silver nitrate as described in detail by Vlaeminck et al. (Reference Vlaeminck, Gervais, Rahman, Gadeyne, Gorniak, Doreau and Fievez2015).
Statistical analysis
Multiple linear regression
The data set (n=140) was randomly divided into a training data set (80% of the observations; n=112) and a validation data set (n=28) using a stratified scheme by experiment using the SURVEYSELECT procedure of SAS. Milk FA⩽0.02 g/100 g fat were not included in the statistical analyses. Summary statistics are presented in Supplementary Table S1.
The regression analysis was done by fitting a generalized linear mixed model, which deals with correlations from repeated measurements and/or shared random effects from an experiment (Pinheiro and Bates, Reference Pinheiro and Bates2000). This was done using the GLIMMIX procedure of SAS with CH4 emissions (expressed in g/day, g/kg DMI and g/kg milk) as dependent variables and individual MFA as independent variables (fixed effects). Experiment and cow were included in the model as random effects. A stepwise variable selection was used having the P value (P<0.1), the Akaike information criterion (AIC) (higher value) and the marginal coefficient of determination (R 2 (m)) (higher value) as selection criteria. Only those variables with P value<0.1 were retained in the final model. Variables highly correlated (r>|0.6|) with a variable already retained in the model were excluded to avoid collinearity. Interaction and quadratic effects were also tested and included in the final model if P<0.1 and if AIC and (R 2 (m)) increased. Pearson’s correlations among all variables were determined using the PROC CORR procedure of SAS. Conditional (R 2 (c)) and marginal (R 2 (m)) coefficients of determination were calculated as explained by Johnson (Reference Johnson2014) based on Nakagawa and Schielzeth (Reference Nakagawa and Schielzeth2013) using the function lmer in the R package lme4 (version 0.999375-42; Bates et al., 2011). The marginal R 2 (m) represents the variance explained by fixed effects (i.e. MFA) in our models, whereas the conditional R 2 (c) accounts for the variance explained by fixed effects and random effects combined (Nakagawa and Schielzeth, Reference Nakagawa and Schielzeth2013).
The models developed with the training data set were validated with the test data set and a coefficient of determination of the validation (R 2 (v)) was estimated to assess the potential of the model to predict CH4 on an independent set of observations. Further models including MFA together with DMI, forage proportion in the diet and concentrate intake were also developed and evaluated following the same procedures mentioned above.
Cumulative abundance of milk fatty acid
The Lorenz curve and the Gini coefficient (Morgan, Reference Morgan1962) were used to estimate the cumulative abundance of MFA. Knowing that milk fat is mainly dominated by a small number of MFA and a larger number of MFA have a relatively low concentration, Gini coefficients were calculated for the total set of MFA (All MFA) and for subsets of MFA based on common chemical properties (i.e. saturated fatty acid (SFA), unsaturated fatty acid (UFA), mono-unsaturated fatty acid (MUFA), poly-unsaturated fatty acid (PUFA), odd- and branched-chain fatty acid (OBCFA)), or according to their proportion in milk fat (i.e. MFA<0.2 g/100 g fat, MFA between 0.2 and 1.0 g/100 g fat, MFA>1 g/100 g fat). The group MFA<0.2 g/100 g fat did not include MFA with concentrations below 0.02 g/100 g fat, as these may be below a reliable limit of detection for our methodology.
The Gini coefficient is defined as a ratio of the areas under the Lorenz curve, and was calculated according to the formula of Gastwirth (Reference Gastwirth1972):
 $$G{\,\equals\,}{1 \over \mu }{\,\minus}{\int}_0^{y{\asterisk}} {\left( {1{\minus}F\left( y \right)} \right)} ^{2} {\,\rm dy}$$
where F(y) is the cumulative probability distribution of MFA abundance, µ its mean, assumed finite and y* its upper limit, which may be infinite.
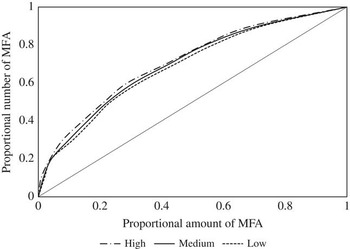
The Gini coefficients were calculated using the Gini function of the reldist package of R. An example of a Lorenz curve from our data set is presented in Figure 1.
Example of a Lorenz curve of the distribution of odd- and branched-chain fatty acid for observations categorized as HIGH, MEDIUM and LOW daily methane emissions. MFA=milk fatty acid.

Categorization of observations by amount of methane produced
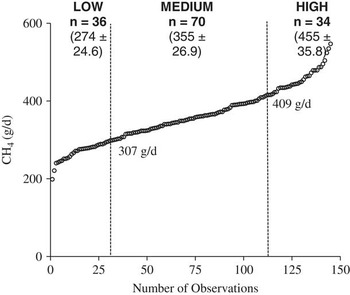
All the observations in the data set were classified into three categories according to their daily CH4 production (g/day) (Figure 2): HIGH (CH4 production within the 75% quantile), MEDIUM (CH4 production between the 25% and 75% quantile) and LOW (CH4 production within the 25% quantile). This was also done for CH4 relative to DMI and milk. Gini coefficients for each of the nine MFA groups were calculated for each observation. An ANOVA (PROC MIXED, SAS) was performed using categories as independent variable (fixed effect) and MFAs or Gini coefficients as dependent variables. Experiment and cow were included as random variables.
Distribution of observations into LOW, MEDIUM and HIGH daily methane (CH4) (g/day) producing observations. Means±SD for each category are presented in brackets. Thresholds for each category are presented.

The potential of both individual MFA and Gini coefficients to classify observations into high or low emissions was validated by re-classifying all observations according to the MFA proportion or Gini coefficient into HIGH, MEDIUM and LOW, following the same procedure explained above. The classification of the observations according to the MFA and Gini coefficient was then compared with the classification based on CH4 emissions to find the number of observations correctly (and wrongly) classified as HIGH or LOW. This was done for every single MFA and Gini coefficient and for every unit used to express CH4.
Results
Relationships of milk fatty acid with methane emissions
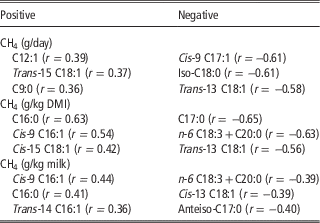
Correlations between CH4 emissions and individual MFA were modest with absolute values ranging from 0.1 to 0.6, with some exceptions. Highest positive and negative correlations (P<0.05) between MFA and CH4 are presented in Table 2.
Pearson’s correlations between methane emissions and proportions of individual milk fatty acids (MFAs) (g/100 g MFA) (P<0.05)

CH4=methane; DMI=dry matter intake.
The final equations of the stepwise regression analysis for CH4 expressed in each of the three functional units are presented in equations (1) to (3). The standard error of each regression coefficient is presented between brackets. Marginal (R 2 (m)), conditional (R 2 (c)) and validation (R 2 (v)) coefficients of determination are also provided for each equation (n=112; MFA in g/100 g FA).
 $$\eqalignno{ & {\rm CH}_{4} \,\left( {{\rm g}/{\rm day}} \right)\,\,{\equals}\,\,471_{{(\!\pm34.2)}} -{\rm }137_{{(\!\pm79.8)}} {\times}cis{\rm {\minus}}13\,{\rm C}16\colon\!1\cr&\!\quad\quad-824_{{(\!\pm348.7)}} {\times}trans{\rm {\minus}}14\,{\rm C}16\colon \!1{\plus}138_{{(\!\pm80.8)}} \cr &\quad \quad{\times}trans{\rm {\minus}}10\,{\rm C}18\,\!\colon\,\!\!1-280_{{(\!\pm77.8)}} {\times}trans{\rm {\minus}}12\,{\rm C}18\,\!\colon\,\!\!1\cr&\!\quad\quad-325_{{(\!\pm79.6)}} {\times}trans{\rm {\minus}}11,\,cis{\rm {\minus}}15\,{\rm C}18\,\!\colon\,\!\!2 \cr & R^{2} _{{\,\,\,(c)}} \,{\equals}\,0.82\,\,\,\,\,\,\,\,\, R^{2} _{{\,\,\,(m)}} \,{\equals}\,0.42\,\,\,\,\,\,\,\,\,\, R^{2} _{{\,\,\,(v)}} \,{\equals}\,0.33\,\,\,\,\,\, \cr &\quad\quad {\rm RMSPE}\,{\equals}\,49.6{\rm g}/{\rm day} $$
 $$\eqalignno{ & {\rm CH}_{4} \,\left( {{\rm g}/{\rm kg}\,{\rm DMI}} \right)\,{\equals}\,-\!5.37_{{(\!\pm4.582)}} -151_{{(\!\pm50.4)}} {\times}{\rm C}7\,\!\colon\,\!\!0\cr &\quad\quad{\plus}1.21_{{(\!\pm0.650)}} {\times}{\rm C}12\,\!\colon\,\!\!0{\plus}0.56_{{(\!\pm0.075)}} {\times}{\rm C}16\,\!\colon\,\!\!0 \cr & \quad\quad{\plus}13.1_{{(\!\pm3.28)}} {\times}cis{\rm {\minus}}7\,{\rm C}16\colon\!1 \cr &\, R^{2} _{{\,\,\,(c)}} \,{\equals}\,0.77 \,\,\,\,\,\,\,\,\,R^{2} _{{\,\,\,(m)}} \,{\equals}\,0.64\,\,\,\,\,\,\,\, R^{2} _{{\,\,\,(v)}} \,{\equals}\,0.41\,\,\cr &\quad\quad {\rm RMSPE}\,{\equals}\,2.08\,{\rm g}/{\rm kg}\,{\rm DMI} $$
 $$\eqalignno{ & {\rm CH}_{4} \left( {{\rm g}/{\rm kg}\,{\rm milk}} \right)\,{\equals}\, -\!122_{{(\!\pm52.7)}} {\plus}20.1_{{(\!\pm13.80)}} {\times}{\rm C}4\,\!\colon\,\!\!0\cr &\quad\quad{\plus}2355_{{(\!\pm888.5)}} {\times}{\rm C}7\,\!\colon\,\!\!0{\plus}4.74_{{(\!\pm1.318)}} {\times}{\rm C}16\,\!\colon\,\!\!0\cr &\quad\quad{\plus}64.9 _{{(\!\pm17.92)}} {\times}cis{\rm {\minus}}9\,{\rm C}17\colon\!1-53.8_{{(\!\pm22.62)}} \cr & \quad\quad{\times}cis{\rm {\minus}}13\,{\rm C}18\,\!\colon\,\!\!1{\plus}19.4_{{(\!\pm13.63)}} {\times}n{\rm {\minus}}3\,{\rm C}22\,\!\colon\,\!\!6 \cr & \quad\quad {\plus}435 _{{(\!\pm222.6)}} {\times}{\rm C}4\,\colon\,0{\asterisk}{\rm C}7\,\!\colon\,\!\!0-0.91_{{(\!\pm0.340)}} \cr& \quad\quad {\times}{\rm C}4\,\!\colon\,\!\!0{\asterisk}{\rm C}16\colon\!0-87.0_{{(\!\pm16.57)}} {\times}{\rm C}7\,\!\colon\,\!\!0{\asterisk}{\rm C}16\,\!\colon\,\!\!0\cr&\quad\quad \!-3349 _{{(\!\pm759.1)}} {\times}{\rm C}7\,\!\colon\,\!\!0{\asterisk}\,cis{\rm {\minus}}9\,{\rm C}17\,\!\colon\,\!\!1 \cr& R^{2} _{{\,\,\,(c)}} \,{\equals}\,0.82\quad \quad R^{2} _{{\,\,\,(m)}} \,{\equals}\,0.50\quad \quad R^{2} _{{\,\,\,(v)}} \,{\equals}\,0.18\quad \quad \cr&\quad\quad {\rm RMSPE}\,{\equals}\,3.52\,{\rm g}/{\rm kg}\,{\rm milk} $$
The equation predicting daily emissions (equation (1)) had the lowest marginal R 2 (m), with only 42% of the variance in daily CH4 explained by fixed effects (i.e. MFA), whereas CH4 relative to DMI equation (2) had the highest R 2 (m) (0.64).
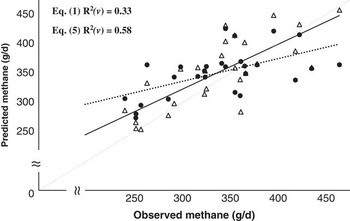
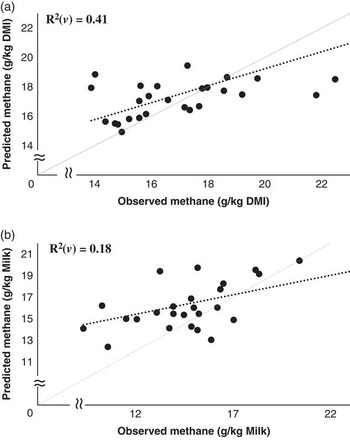
When the models were fitted to the validation data set, the equations based on MFA poorly predicted CH4 emissions (Figures 3,4), with CH4 relative to DMI (equation (2)) having the highest validation R 2 (v) (0.41), whereas CH4 relative to milk had the lowest (R 2 (v)=0.18).
Observed and predicted methane emissions (g/day) from the model using milk fatty acid (MFA) proportions (g/100 g fatty acid (FA)) (equation (1), ● dashed regression line) and for the model including dry matter intake (kg/day) and MFA proportions (g/100 g FA) (equation (4), ∆ solid regression line). R 2(v)=coefficient of determination of the validation.

Observed and predicted methane emissions relative to (a) dry matter intake (DMI) (g/kg DMI, equation (2)), (b) and milk yield (g/kg milk, equation (3)) from the models using milk fatty acid proportions (g/100 g fatty acid). R 2(v)=coefficient of determination of the validation.

Furthermore, it was tested whether inclusion of predictors such as DMI (kg/day) (equation (4)), dietary forage proportion (as fraction, on DM basis) in the diet (equation (5)) or concentrate intake (kg DM/day) (equation (6)) in addition to MFA proportions could improve predictions of daily CH4.
 $$\eqalignno{ & {\rm CH}_{4} \,\left( {{\rm g}/{\rm day}} \right)\,{\equals}\,282_{{(\,\!\pm\,38.7)}} {\plus}16.6_{{(\!\pm1.79)}} {\times}{\rm DMI}-\cr& \quad 189_{{(\!\pm52.9)}} {\times}{\rm C}17\,\!\colon\,\!\!0-32.3_{{(\!\pm6.12)}} {\times}trans {\rm {\minus}C}18\,\!\colon\,\!\!1\cr&\! \quad -146_{{(\!\pm48.0)}} {\times}cis{\rm {\minus}}13\,{\rm C}16\,\!\colon\,\!\!1-117_{{(\!\pm63.4)}} {\times}iso\,{\rm C}17\,\!\colon\,\!\!0 \cr & R^{2} _{{\,\,\,(c)}} \,{\equals}\,0.86\,\, \quad \quad R^{2} _{{\,\,\,(m)}} \,{\equals}\,0.76 \,\, \quad \quad R^{2} _{{\,\,\,(v)}} \,{\equals}\,0.58\,\, \cr & \quad {\rm RMSPE}\,{\equals}\,41.6\,{\rm g}/{\rm day} $$
 $$\eqalignno{ & {\rm CH}_{4} \,\left( {{\rm g}/{\rm day}} \right)\,{\equals}\,533_{{(\!\pm95.3)}} -179_{{(\!\pm143.8)}} \cr&\quad {\times}{\rm forage}{\plus}4279_{{(\!\pm2966.3)}} {\times}trans {\rm {\minus}}14\,{\rm C}16\,\!\colon\,\!\!1-235_{{(\!\pm52.5)}} \cr&\quad{\times}trans{\rm {\minus}}11,\,cis{\rm {\minus}}15\,{\rm C}18\,\!\colon\,\!\!2-8044_{{(\!\pm4687.1)}} \cr&\quad{\times}{\rm forage}{\times}trans {\rm {\minus}}14\,{\rm C}16\,\!\colon\,\!\!1 \cr& R^{2} _{{\,\,\,(c)}} \,{\equals}\,0.85 \quad \quad R^{2} _{{\,\,\,(m)}} \,{\equals}\,0.54 \quad \quad R^{2} _{{\,\,\,(v)}} \,{\equals}\,0.28 \cr & \quad{\rm RMSPE}\,{\equals}\,53.1\,{\rm g}/{\rm day} $$
 $$\eqalignno{ & {\rm CH}_{4} \,\left( {{\rm g}/{\rm day}} \right)\,{\equals}\,118 _{{(\!\pm48.2)}} {\plus}32.1_{{(\!\pm5.66)}} \cr& \quad {\times}{\rm concentrate}\,{\rm intake}{\plus}18.8_{{(\!\pm8.34)}} {\times}{\rm C}12\,\!\colon\,\!\!0- 223_{{(\!\pm48.8)}} \cr& \quad {\times}trans{\rm {\minus}}11,\,cis{\rm {\minus}}15\,{\rm C}18\,\!\colon\,\!\!2 \,\,\cr &R^{2} _{{\,\,\,(c)}} \,{\equals}\,0.96 \quad \quad R^{2} _{{\,\,\,(m)}} \,{\equals}\,0.72 \quad \quad R^{2} _{{\,\,\,(v)}} \,{\equals}\,0.29\quad \quad \cr & \quad {\rm RMSPE}\,{\equals}\,354\,{\rm g}/{\rm day} $$
Equations developed using DMI, forage proportion in the diet or concentrate intake together with MFA had a higher marginal R 2 (m) than the prediction based solely on MFA (Figure 3), but R 2 (v) only improved when including DMI.
Differences in milk fatty acid proportions for different categories (HIGH, MEDIUM, LOW) of methane emissions
The average MFA proportion for each category and the result of the ANOVA are presented in Supplementary Table S2 to S4. For daily CH4 several MFA showed differences in their proportions between the three categories, with the clearest separation found for cis-9 C17:1, iso-C18:0, cis-13 C18:1, total SFA and total UFA. When the observations were classified according to CH4 in g/kg DMI the clearest separation between the three categories appeared for iso-C17:0, C17:0, trans-13 C8:1, n-6 C20:3 n-6 C22:5. Of all MFA, only C16:0, cis-9 C16:1, cis-9 C17:1, cis-13 C18:1 showed a difference between categories for all units of expression of CH4.
Cumulative distribution of milk fatty acid for different categories (HIGH, MEDIUM, LOW) of methane emissions
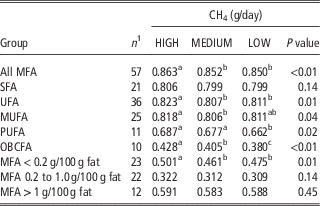
The calculated Gini coefficients of MFA for the three categories (i.e. HIGH, MEDIUM and LOW) according to daily emissions (g/day) and for each MFA group are presented in Table 3 along with the results of the ANOVA. Gini coefficients of MFA profiles belonging to observations in the category HIGH were different from those of categories MEDIUM and LOW for groups All, UFA, OBCFA and MFA<0.2 g/100 g FA; with the clearest separation between the three categories appearing for the Gini coefficients of the group OBCFA, this pattern was also observed when the observations were categorized according to CH4 expressed in the other functional units. A summary of these results is presented in Supplementary Table S5.
Means of Gini coefficients in different milk fatty acid (MFA) categories of daily methane (CH4) production (HIGH, MEDIUM and LOW) and results of the ANOVA

SFA=saturated fatty acids; UFA=unsaturated fatty acids; MUFA=mono-unsaturated fatty acids; PUFA=poly-unsaturated fatty acids; OBCFA=odd- and branched-chain fatty acids.
a,b,cWithin the same row different superscript letters indicate significant differences (P<0.05).
1 Number of MFAs included in each group to calculate the Gini coefficient.
No differences in Gini coefficients between the three categories were observed for groups SFA, MFA 0.2 to 1.0 g/100 g FA and MFA>1.0 g/100 g FA, whereas classification of the Gini coefficient based on the MUFA group allowed differentiation of the category HIGH from the other two categories, but MEDIUM and LOW could not be distinguished from each other.
Discussion
Pearson’s correlations
Correlations between CH4 and individual MFA were generally weak across the complete data set which has been also observed in other studies considering multiple experiments (e.g. Dijkstra et al., Reference Dijkstra, Van Zijderveld, Apajalahti, Bannink, Gerrits, Newbold, Perdok and Berends2011; Rico et al., Reference Rico, Chouinard, Hassanat, Benchaar and Gervais2016) or diets (Mohammed et al., Reference Mohammed, McGinn and Beauchemin2011). Higher correlations were reported for studies containing data from a single experiment with limited dietary diversity (Chilliard et al., Reference Chilliard, Martin, Rouel and Doreau2009; Mohammed et al., Reference Mohammed, McGinn and Beauchemin2011). Similar to our findings, Mohammed et al. (Reference Mohammed, McGinn and Beauchemin2011) and Rico et al. (Reference Rico, Chouinard, Hassanat, Benchaar and Gervais2016) found the highest correlation between CH4 (g/day) and cis-9 C17:1. Cis-9 C17:1 is a desaturase product of C17:0, a FA that particularly occurs in the membrane lipids of amylolitic bacteria, in line with its negative relationship with CH4.
Multivariate analysis
Although the current multi-experiment approach attempted to largely represent common dairy cows’ diets in Western Europe, it should be mentioned that ranges of several MFA were wider in the literature survey of Castro-Montoya et al. (Reference Castro-Montoya, De Campeneere, De Baets and Fievez2016) compare with the current study, particularly for some MFA present in smaller proportion in milk fat. This might indicate that the current data set is still not completely representative of the full range of MFA proportion that can be found with more diverse diets, although this might be also related to the variation in analytical methods at different laboratories represented in the literature survey. Out of the 140 observations, three were derived from cows supplemented on linseed (Experiment 9), which could potentially influence the MFA profile, however, these observations did not appear as outliers and no statistical differences were observed between the MFA proportions of these three observation and its corresponding control, and were, therefore, kept in the data set. For the current study, all MFA analysis where done in the same laboratory and with the same methodology.
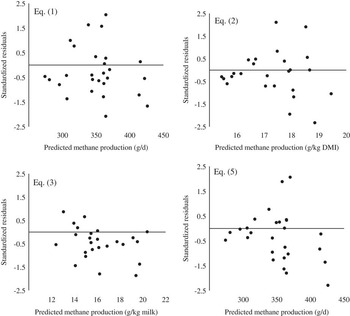
Previous studies predicting CH4 emissions from MFA have reported similar or slightly higher coefficients of determination than the R 2 (c) found in the current study. However, in those studies it is not possible to assess the proportion of the variation actually attributed to MFA or to random effects. This was addressed in the current study by computing a marginal R 2 (m) and a conditional R 2 (c). The current approach better reflects the real potential of MFA in predicting CH4 production. More of the variation in CH4 emissions (64%) could be explained by MFA when expressed relative to DMI (equation (2)), whereas MFA only explained a minor proportion (42%) of daily emissions (equation (1)). When testing the models developed on an independent set of observations, it is clear that, based on the R 2 (v), the ability of MFA to predict CH4 emissions is lower than what would be assumed from R 2 (c) or even R 2 (m). Additional regression was done expressing CH4 relative to BW, but similar to the findings of Castro-Montoya et al. (Reference Castro-Montoya, Peiren, Cone, Zweifel, Fievez and De Campeneere2015), the model developed and its evaluation reflected those of daily emissions and were not presented here. Figure 5 shows standardized residuals plots for selected equations where it can be seen that overall our models under-predicted CH4 emissions, but still do not show strong patterns of clustering across the predicted CH4, indicating a general good fit through all the experiments. It should be noticed that for equation (2) equation (4) lower residuals appear to be related with lower CH4, whereas errors associated with larger emissions are more variable.
Standardized residuals plot for equations predicting daily methane emissions from milk fatty acids (equation (1)), and emissions relative to dry matter intake (DMI) (equation (2)), milk yield (equation (3)) and from milk fatty acids and DMI (equation (4)).

Similar to the current results, Rico et al. (Reference Rico, Chouinard, Hassanat, Benchaar and Gervais2016) found that the model including DMI and MFA was better than the model based on MFA only (e.g. R 2=0.8 v. 0.58). However, individual DMI is currently not monitored under practical conditions, therefore, along with DMI, dietary forage proportion and concentrate intake were also considered as possible alternative predictors for CH4 emissions, but these could not improve predictive performance.
Ideally, MFA used for predictions should be easy to determine on a routine basis, which has been the focus of other research groups working with spectrometry (e.g. Soyeurt et al., Reference Stefanov, Vlaeminck and Fievez2011; Eskildsen et al., Reference Eskildsen, Rasmussen, Engelsen, Larsen, Poulsen and Skov2014) with relative success for a number of FAs. The determination of most MFA retained in our equations remains out of the scope of routine analysis. In an effort to address this, a model was developed considering only those MFA that can be determined on a routine basis. However, the final model (not shown), containing C4:0, C12:0 and total trans-C18:1, performed poorly (R 2 (m)=0.17, R 2 (v)=0.06) compared with the model in equation (1).
Finally, few common MFA occurred in the models predicting CH4 emissions expressed in different units, with some similarities appearing between equations for CH4 relative to DMI (equation (2)) and relative to milk yield (equation (3)), as previously observed by Castro-Montoya et al. (Reference Castro-Montoya, De Campeneere, De Baets and Fievez2016). For daily emissions isomers of C16:1 and of C18:1 seem to be of major relevance, whereas for equations (2) and (3) short- and medium-chain SFA were more relevant.
Milk fatty acid proportions and cumulative distribution to categorize milk fatty acid for HIGH-, MEDIUM- and LOW-methane emissions
Milk FA appear to have a modest potential to predict amounts of CH4 emitted by dairy cows. However, it remains unknown if MFA hold potential to distinguish cases of, for example, low- v. high-CH4 emitters, which could be of interest for selection purposes (e.g. Hegarty et al,. Reference Hegarty, Goopy, Herd and McCorkell2007). To explore this possibility, observations were ordered from the lowest to the highest CH4 emission and separated into three categories, that is, the 25% highest CH4 observations (HIGH), the 25% lowest (LOW) and the remaining 50% (MEDIUM). For the purpose of this study most of the discussion will focus on the differences between the HIGH and LOW. Clear differences appeared in the MFA proportions between both categories, which in many cases were fairly large, with, for example, cis-9 C17:1, iso-C18:0 and cis-13 C18:1 showing an increase of 1.9, 2.4 and 1.7 fold between HIGH and LOW, respectively. Similarly, several trans isomers of C18:1 showed twofold changes between the HIGH and LOW.
In the current study, cis-MUFA and C18:1 isomers were negatively, whereas SFA were positively related to CH4, in agreement with a multi-study survey of Castro-Montoya et al. (Reference Castro-Montoya, De Campeneere, De Baets and Fievez2016), although relationship between CH4 and long-chain PUFA were negatively related to CH4 in this study, in contrast to the findings of Castro-Montoya et al. (Reference Castro-Montoya, De Campeneere, De Baets and Fievez2016).
The proportion of cases classified in the correct CH4 category based on the MFA proportions (considering negative and positive correlations) was used to assess the potential of this approach. This was done for each individual MFA and for each unit of expression of CH4 (selected results are presented in Table 4).
Selected results of the proportion of observations of the categories HIGH methane (CH4) or LOW CH4 correctly or wrongly classified as HIGH or LOW according to milk fatty acid proportions (g/100 g fat) and Gini coefficients

DMI=dry matter intake; OBCFA=odd- and branched-chain fatty acids.
1 Proportion of observations belonging to the category HIGH CH4 that were correctly classified as HIGH.
2 Proportion of observations belonging to the category HIGH CH4 that were wrongly classified as LOW.
3 Proportion of observations belonging to the category LOW CH4 that were correctly classified as LOW.
4 Proportion of observations belonging to the category LOW CH4 that were wrongly classified as HIGH.
Cis-9 C17:1 correctly identified 61% of the HIGH-CH4 observations and misclassified 3% of them as LOW CH4 (therefore, 36% of the HIGH-CH4 observations were classified as MEDIUM). Similarly, cis-9 C17:1 correctly classified 58% of the LOW-CH4 observations with no misclassification into HIGH CH4. In comparison, trans-12 C18:1 and total trans-C18:1 correctly classified more of the HIGH-CH4 observations (67% both), but also misclassified more of them as LOW CH4 (Table 4). In addition, these MFA showed a lower potential to correctly classify observations in the LOW-CH4 category (19% and 25%, respectively). Slightly lower correct classification appeared for CH4 relative to DMI (Table 4). For CH4 relative to milk yield, results were clearly worst and no MFA correctly classified more than 44% of observations (data not shown).
When the same approach was applied using the Gini coefficients, these were generally greater for observation in category HIGH than those in category MEDIUM and LOW, indicating a more unequal distribution for MFA. In practical terms, this means that higher CH4 observations were associated with a greater abundance of FA with the largest contribution to milk fat within a group (e.g. PUFA). On the other hand, FA present at lower concentrations are less abundant than for low-CH4 observations. Fatty acids with the smallest concentrations included in this analysis were odd-chain FAs like C5:0, C7:0 and C9:0, isomers of C16:1 and long-chain FA (e.g. n-3 C22:6). Odd-chain FAs could be endogenously produced when propionyl-CoA, a derivative of propionic acid (negatively correlated with CH4), is used as primer instead of acetyl-CoA (Fulco, Reference Fulco1983). It follows that a higher rumen propionate concentration could result in higher production of odd-chain FA, which would then become more dominant within a certain MFA group, decreasing the Gini coefficient in case of less CH4, as in categories MEDIUM and LOW. This, however, could be valid only for those groups where short-chain odd-chain FA are included (i.e. All, SFA and MFA<0.2 g/100 g FA).
Isomers of C16:1, also present at low concentrations, could derive from partial oxidation of C18:1 isomers, which, generally are negatively related to CH4 (see e.g. Castro-Montoya et al., Reference Castro-Montoya, De Campeneere, De Baets and Fievez2016). When an ANOVA was done for every MFA with category (i.e. HIGH, MEDIUM, LOW) as fixed effect it was found that several MFA differed between the categories (data not shown), and in most cases the difference was between HIGH and the other two categories, resembling the behavior observed for the Gini coefficients. The proportions of several isomers of C16:1 and C18:1, and long-chain FA differed between cases of HIGH- v. LOW- and MEDIUM-CH4 emissions.
The clearest separation in the cumulative distribution of MFA was found based on OBCFA (Table 3). The former have been linked to CH4 emissions due to their microbial origin (see e.g. Castro-Montoya et al., Reference Castro-Montoya, Bhagwat, Peiren, De Campeneere, De Baets and Fievez2011). The HIGH category showed particularly lower proportions for iso-C17:0, iso-C18:0, cis-9 C17:1 and C17:0 than cases in categories MEDIUM or LOW, which could be an indication of different ruminal function or microbial setting.
When Gini coefficients were used to classify observations into HIGH or LOW CH4, the best results were observed with Gini OBCFA and Gini All (Table 4), but for both cases the proportion of correct classifications was less than for the best individual MFA, which indicates that the numerical representation of the cumulative distribution of MFA does not improve their capacity to classify observations into HIGH and LOW CH4. Some combinations of individual MFA were also tested without showing any improvement and were not reported here.
Finally, it has to be mentioned that the categories considered for this analysis are not categories in the strict sense, because they are based on the ranking of the observations within our experiments, and the threshold for these categories might not be a robust representation of high or low emissions. Further refinements of this approach might help to better discriminate animals producing more CH4 from those producing less, which deserves further attention. In this study the observations derived from two to four measurements for each cow, and in some cases observations of the same animal were found, for example, in the category HIGH and MEDIUM or in category MEDIUM and LOW (no animal had observations both in HIGH and LOW), which indicates that the current categorization was linked to classifications of observations rather than animals. A possible future research would be to focus on animals characterized as high or low emitters and use their MFA profiles to classify them following a similar approach to what is proposed in this study.
In conclusion, MFAs hold a modest potential to predict CH4 emissions. However, not all MFA retained in the current models can be determined on a routine basis, but so far MFA that can be determined spectrophotometrically are not promising predictors of CH4. Including DMI in the model greatly improved the predictions, but not so when dietary forage proportion or concentrate intake was included in the model. The proportion of several MFA clearly differed between the 25% highest and the 25% lowest CH4 observations. Milk FA generally showed a greater potential to exclude observations from an extreme category (i.e. LOW, HIGH) rather than correctly identifying high or low emission cases. Integration of MFA information through the calculation of Gini coefficients and classification based on the latter did not improve classification performance.
Acknowledgments
J. C. M. received a PhD grant jointly funded by the ILVO, Belgium and the LANUPRO, Ghent University. The authors thank Dr Bruno Vlaeminck and Dr Bart Ampe for their cooperation with important ideas during the development of this study.
Supplementary materials
To view supplementary material for this article, please visit https://doi.org/10.1017/S1751731116002627