There remains a puzzle around the world over why wage growth is so benign given the low levels of unemployment. In the US, the unemployment rate at the time of writing is 4.1 per cent and in the UK 4.3 per cent. The wage growth of production and non-supervisory workers in the US, which accounts for 82 per cent of private sector workers, has remained flat at around 2.5 per cent for twenty-four months in a row as the unemployment rate fell from 4.9 per cent to 3.8 per cent. In the UK wage growth in April 2018 was 2.5 per cent.
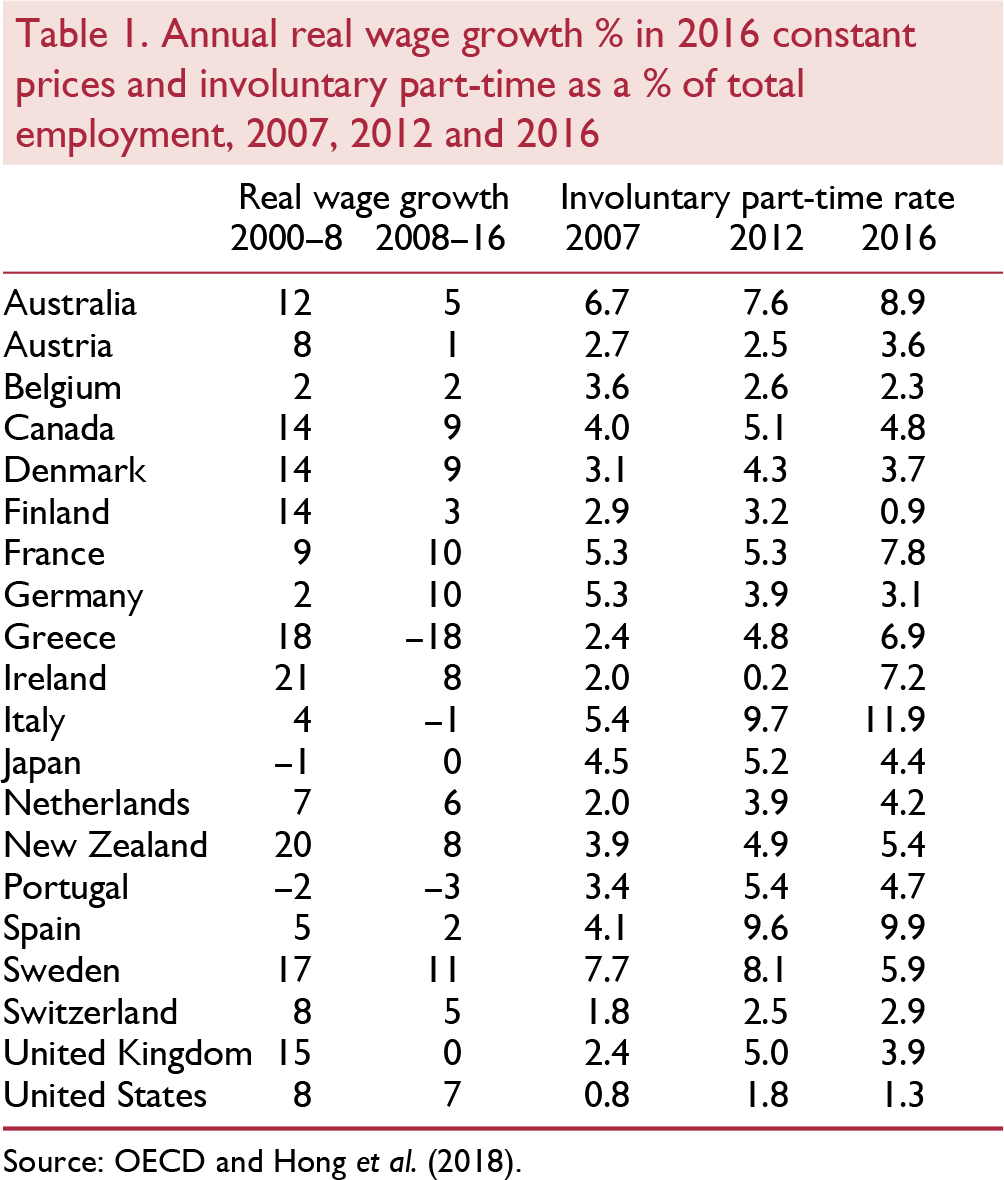
There has also been little wage growth across the OECD. Table 1 reports real wage growth in the period 2000–8 and then from 2008 through 2016 using data from the OECD on annual earnings in local currencies at 2016 prices. Real wage growth across the OECD has been benign in the years since 2008 and much less than in the period 2000–8. Over this eight-year period only France, Germany, Iceland, Norway and Sweden saw average growth rates of above 1 per cent. In the UK real wages grew not at all and they fell in Greece, Italy and Portugal. The highest growth rate was 11 per cent in Sweden, compared with the highest in the previous period of 27 per cent in Norway.
The weakness of wage growth has continued to be a surprise to policymakers. At the press conference following the rate increase decision at the FOMC meeting on 13 June 2018, chair Jerome Powell said “we had anticipated and many people have anticipated that wages – that in a world where we're hearing lots and lots about labor shortages – everywhere we go now, we hear about labor shortages, but where is the wage reaction? So, it's a bit of a puzzle. I wouldn't say it's a mystery, but it's a bit of a puzzle. And one of the things is, you will see pretty much people who want to get jobs – not everybody – but people who want to get jobs, many of them will be able to get jobs. You will see wages go up,”
Hope springs eternal. The projections from the June meeting showed that the FOMC members thought that the long-run value for unemployment, its natural rate, is in the range 4.1 per cent to 4.7 per cent.Footnote 1 With the unemployment rate at 3.8 per cent, there surely, according to the FOMC, should have been roaring wage pressure, and fear of a wage explosion is one of the main reasons the Fed is raising rates. The fact that there is little sign of wage growth picking up is neither a puzzle nor a mystery. To be clear, the FOMC are raising interest rates to increase the unemployment rate, which they estimate is currently below the NAIRU. Hence why, for them, the lack of wage growth is a puzzle and a mystery.
It is our contention in this paper that a considerable part of the explanation for the benign wage growth in the advanced world is the rise in underemployment. This is also reported in table 1, here measured as the proportion of those who say they are involuntarily part-time as a percentage of total employment. This measure of underemployment picked up for most countries after 2008 and then turned down. However, it is notable that in Australia, Italy, New Zealand and the Netherlands the rate rose steadily over the period. With the exception of Belgium, Finland, Germany, Israel and Sweden, the 2016 rate is still above the 2007 rate. It is about the same in Japan. This contrasts with the unemployment rate, which, as noted above, for example, for the US and UK has returned to pre-recession levels. In 2016, underemployment rates on this measure were especially high in Australia (8.9 per cent), France (7.8 per cent), Spain (9.9 per cent) and Italy (11.9 per cent).
This lack of wage pressure has continued to generate consternation among policymakers, who still expect nominal annual wage growth to revert to pre-recession averages of 4 per cent or higher and real wage growth nearer to 2 per cent. We begin by looking at wages and wage growth in the UK and how wage growth weakness is related to the rise in underemployment. We then move on to examine wage growth in 28 OECD countries and also find that underemployment plays a significant role. Underemployment now replaces unemployment as the main measure of labour market slack in the UK. The Phillips curve in the UK has now to be rewritten into wage underemployment space. We examine arguments that suggest the natural rate of unemployment, the NAIRU, has fallen sharply. We present evidence to show that the UK Phillips curve has flattened.
Lack of wage growth in the UK
Policymakers in the UK have been expecting wage growth to take off for years. For example, in the opening statement at the February 2018 press conference for the Inflation Report Bank of England Governor Carney argued,
“The firming of shorter-term measures of wage growth in recent quarters, and a range of survey indicators that suggests pay growth will rise further in response to the tightening labour market, give increasing confidence that growth in wages and unit labour costs will pick up to target-consistent rates.”
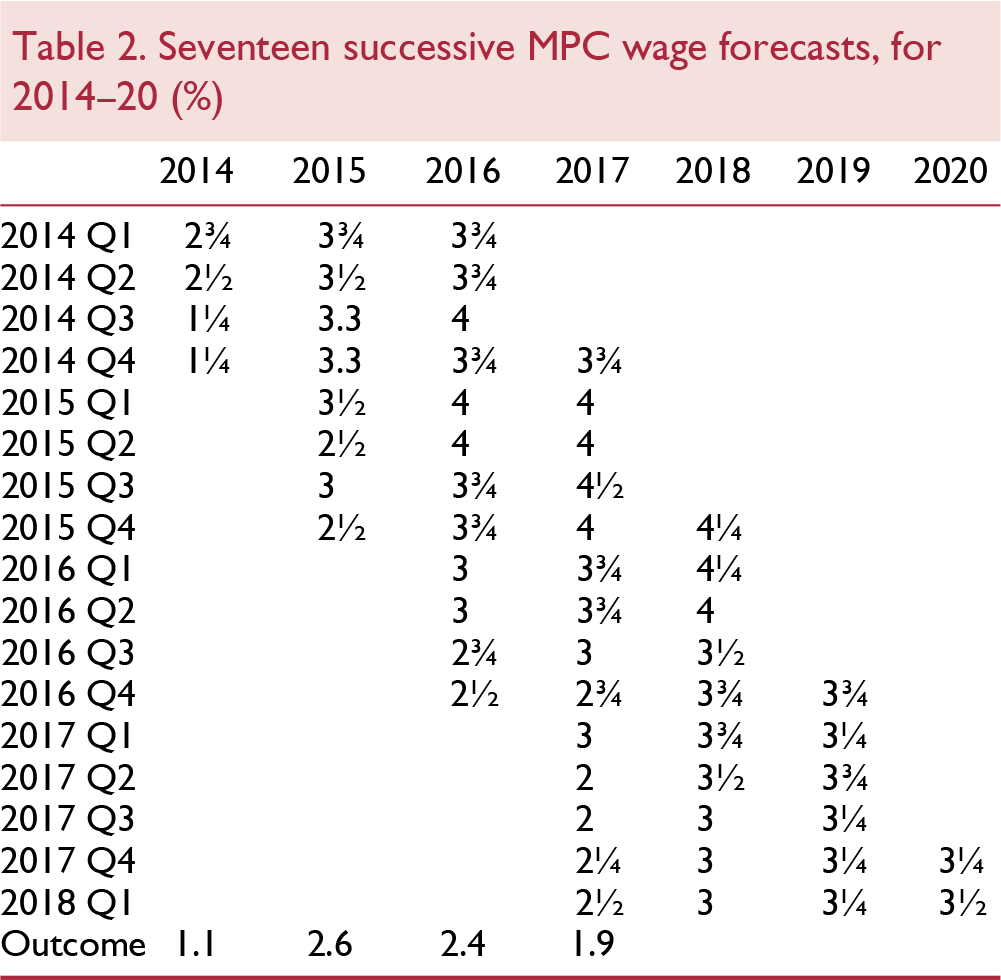
In large part the MPC has had to reduce its estimates of the natural rate of unemployment because it has continued to over-estimate wage growth. Table 2 shows the MPC's forecast for wage growth in the last seventeen inflation reports dating from February 2014 through February 2018. Each of these forecasts over-estimated wage growth and there has been little or no learning from previous errors. The forecasts have been poor to say the least. Three-year ahead wage forecasts in every case were around 4 per cent, but over time the forecasts were reduced as the data showed that a 2 per cent pay norm existed. Pay settlements have continued to suggest a pay norm over the past several years of around 2 per cent. Even in February 2018, the MPC is forecasting wage growth of 3 per cent in 2018, 3¼ per cent in 2019 and 3½ per cent in 2020 which seems most unlikely. The outcomes reported in the final row of the table are the averages for the year-on-year growth rates by month of AWE Total Pay. It makes little sense to focus on regular pay excluding bonuses as we are interested in how much workers are paid rather than what the payments are called; many bonuses are paid regularly.
Results from the Bank's Agents' annual pay survey are consistent with an increase in pay growth. The survey recorded an average pay settlement in the private sector of 2.6 per cent in 2017, higher than companies had expected in the survey a year ago. In 2018, the average private sector pay settlement was expected to be ½ per cent higher, at 3.1 per cent. With the exception of construction, average pay settlements were predicted to rise in all sectors in 2018. Respondents to the survey had reported that the main factors pushing up total labour cost growth per employee were the difficulty of recruiting and retaining staff, employer pension contributions, higher consumer price inflation and the National Living Wage.
Pay experts XPertHr also reported a rise in settlements at the start of 2018. Median pay deals in the three months to the end of January 2018 were 2.5 per cent, which marks an increase on the 2 per cent median award recorded in every rolling quarter during 2017, and is the highest figure seen since the three months to the end of March 2014 (when pay awards were also at a median rate of 2.5 per cent). Maybe it will all change in 2018 and after seventeen failed attempts they will have it right this time? We doubt it.
In a recent speech Sir John Cunliffe, Deputy Governor at the Bank of England, took a somewhat more dovelike tone, arguing that there was likely more labour market slack in the UK due to underemployment.Footnote 2
“A straightforward explanation of why pay growth is subdued at very low levels of unemployment is that we are under-measuring the amount of spare capacity – or ‘slack’ – in the labour market. Recent trends in the world of work have meant greater (voluntary and involuntary) self-employment and part-time employment. Measures incorporating under-employment as well as unemployment – i.e. how much more people who are in work would like to work – may give a better indication of the amount of spare capacity in the labour market. In such a world, low pay is simply telling the policymaker that there is more labour market slack than the unemployment indicators are registering, that the output gap is larger than thought and that the economy can grow at a faster rate without generating domestic inflation pressure.” That seems right.
It is our contention that the MPC's failure to forecast wage growth appropriately and hence accurately to predict the natural rate of unemployment is because its members have focused on unemployment and have largely ignored underemployment. We described in Reference Bell and BlanchflowerBell and Blanchflower (2014) how the MPC argued in May 2014 that it was appropriate to consider the rise in underemployment but would only take account of half of this increase because “only around half of the present gap between actual hours and the estimate of desired hours represents labour market slack”. This judgement was based on calculations presented in a speech by Martin Reference WealeWeale (2014) which seemed unusual given that underemployment historically had disappeared when labour markets tightened. In fact, rather than being above the unemployment rate, the underemployment rate was below the unemployment rate for the years 2001–8 because workers wanted, in aggregate, to reduce their hours, rather than increase them. Hence the Weale adjustment looks in error. The subsequent path of wage growth indicated that judgement laid to continuing overestimation of wage growth – the MPC forecast for wage growth in 2016 was 3½ per cent and for 2017 it was 3¾ per cent.
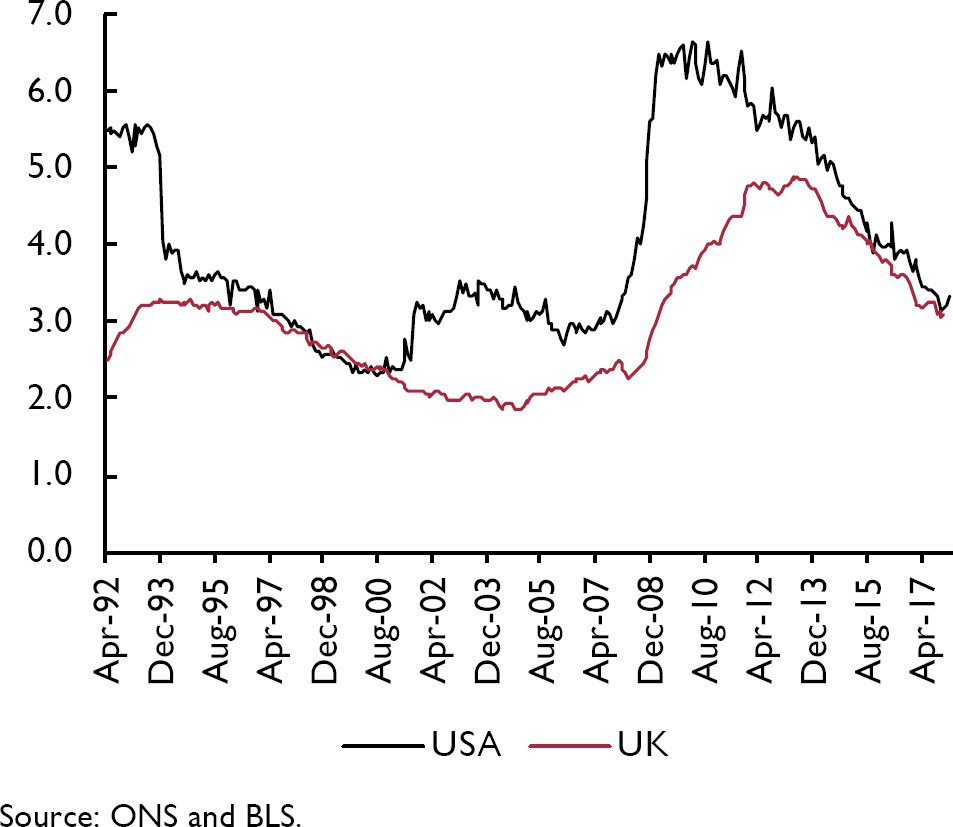
In the United States, underemployment is measured by estimating the number of part-time workers who say they are part-time for economic reasons (PTER). In Europe, the estimates of underemployment are based on the number of part-time workers who want a full-time job (PTWFT). Figure 1 reports these two measures for the UK and USA, expressed as a proportion of total employment. In both countries they rose sharply, peaking at 6.7 per cent in the US in March 2010 and at 4.8 per cent in the UK between June and August 2013. both series declined more slowly than the respective unemployment rates, which by the end of 2017 in both countries had returned to their pre-recession levels. But not so for both underemployment series, which remained well above their starting levels. There were similar rises across other European countries.Footnote 3
In previous papers, we have examined underemployment in the UK using micro-data (Reference Bell and BlanchflowerBell and Blanchflower, 2011, Reference Bell and Blanchflower2013, Reference Bell and Blanchflower2018; Reference BlanchflowerBlanchflower, 2015). The data used in this and the previous studies are the quarterly ONS Labour Force Surveys (LFS). In this paper, we use LFS data for the period April 2001 to December 2017. Individuals may be included for up to five waves.
The simplest underemployment variable to construct using the LFS is the ‘part time-wants full-time’ (PTWFT) category which is included as one possible response for the variable ftptw. This response is used to construct the UK time series in figure 1. We are also able to construct an overhrs (undhrs) variable for those who say they want less (more) hours at the going wage rate. Those who wish to increase (decrease) their hours have undhrs (overhrs) set to zero. If individuals express no preference to change their hours, all three variables are set to zero.
Part-time for economic reasons (USA) and part-time can't find full-time (UK) as % of employment
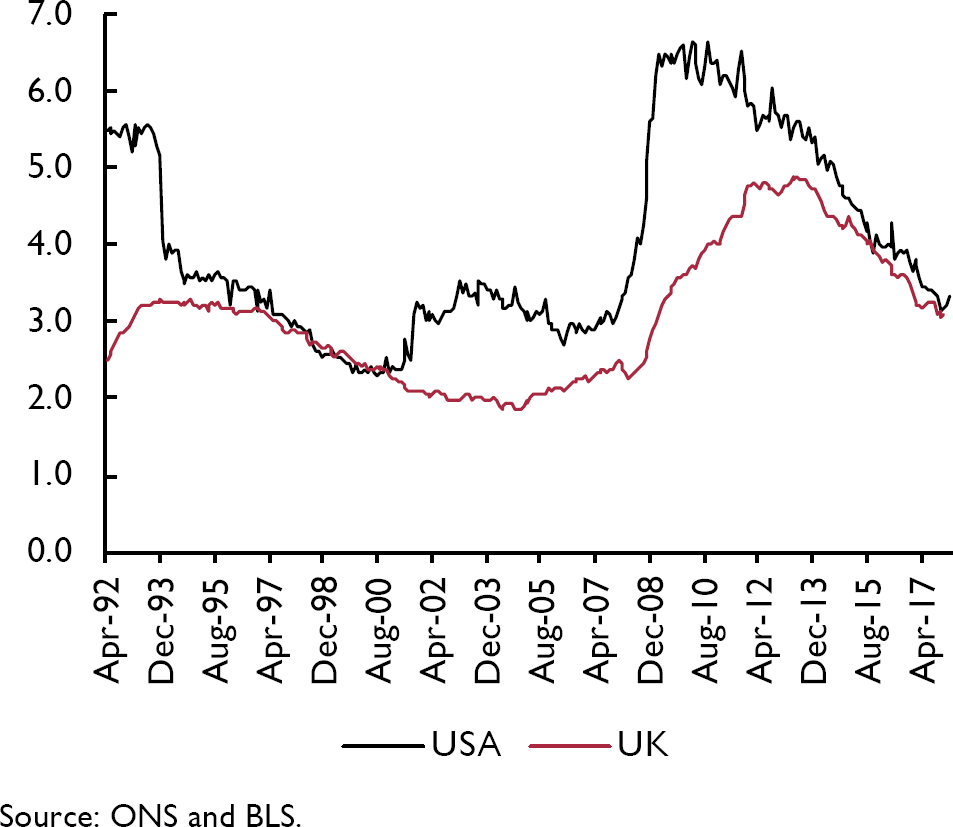
Questions over hours preferences are asked of all workers, not just of those who are PTWFT. This potentially matters because the data suggest that less than a third of aggregate desired increases in hours come from those who are PTWFT. In the US, only PTER is available from the Current Population Survey so it is not possible to measure desired increases or decreases in hours, and therefore impossible to assess the contribution of PETR to aggregate desired hours increases.
Table 3 reports the distribution of workers available in the LFS sample in the pre-recession period 2001–8 and post-recession 2009–17. It identifies five different types of part-time work, one of which is PTWFT, and full-time classified as under hours for those who wanted more hours and over hours for those who wanted less, along with their share of total employment. It reports the number of hours individuals would like, conditional on saying they wanted to change their hours, which includes all the PTWFT, who want, on average, to increase their working week by ten hours in the first period and by eleven hours in the second.

A number of points stand out.
1) There is a rise over time in the proportion of workers who are PTWFT.
2) There is a roughly equivalent fall in the proportion of full-timers.
3) The number of under hours reported is positive in all six categories and rises over time in all of them.
4) There is little or no change over time in the number of over hours.
5) Overall, only 23 per cent of under hours in the first period and 31 per cent in the second is accounted for by PTWFT.
6) On average the PTWFT want to increase their hours by 10 hours pre-recession and by 11 post-recession. There also are a lot more of them post-recession.
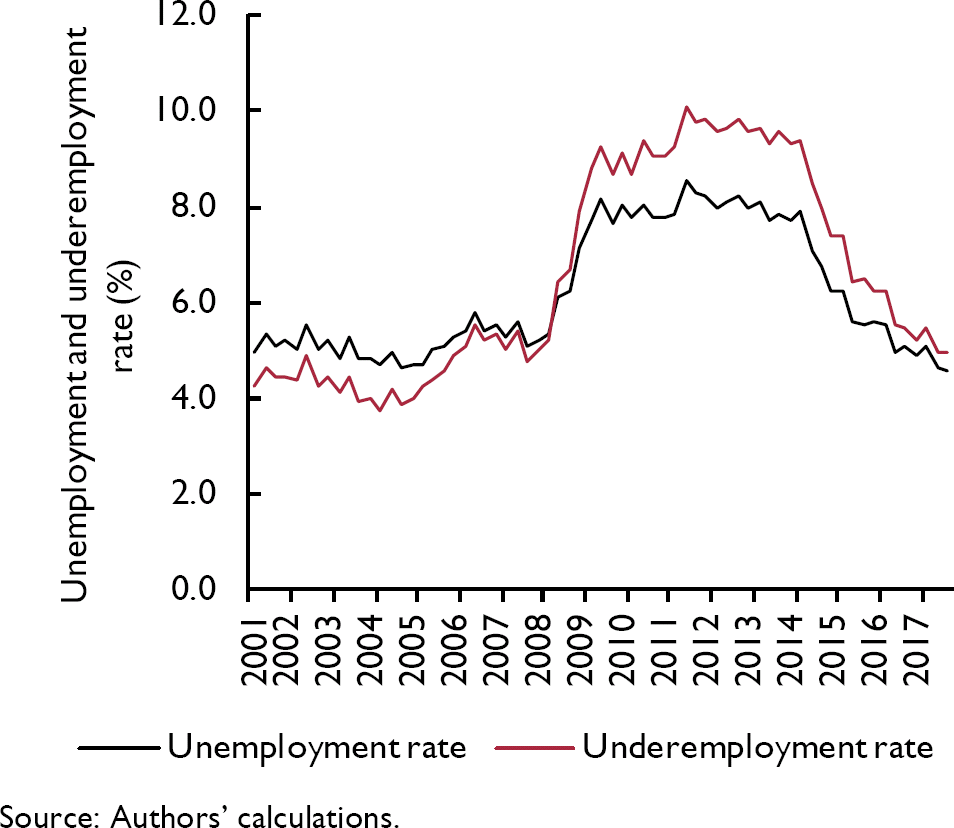
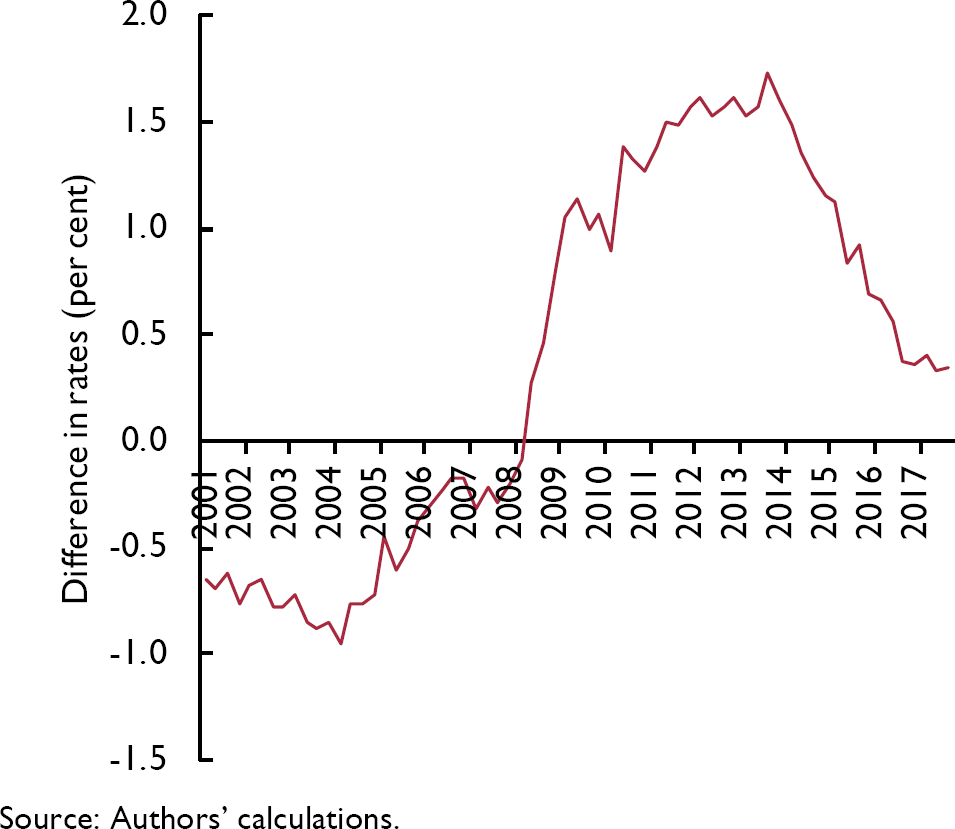
Figure 2 presents quarterly time series evidence on the Bell/Blanchflower underemployment index. It compares the unemployment rate with the underemployment rate we construct. In the pre-recession period the underemployment rate is below the unemployment rate and in the years after 2008 it is above it. Why?
Unemployment and underemployment rates

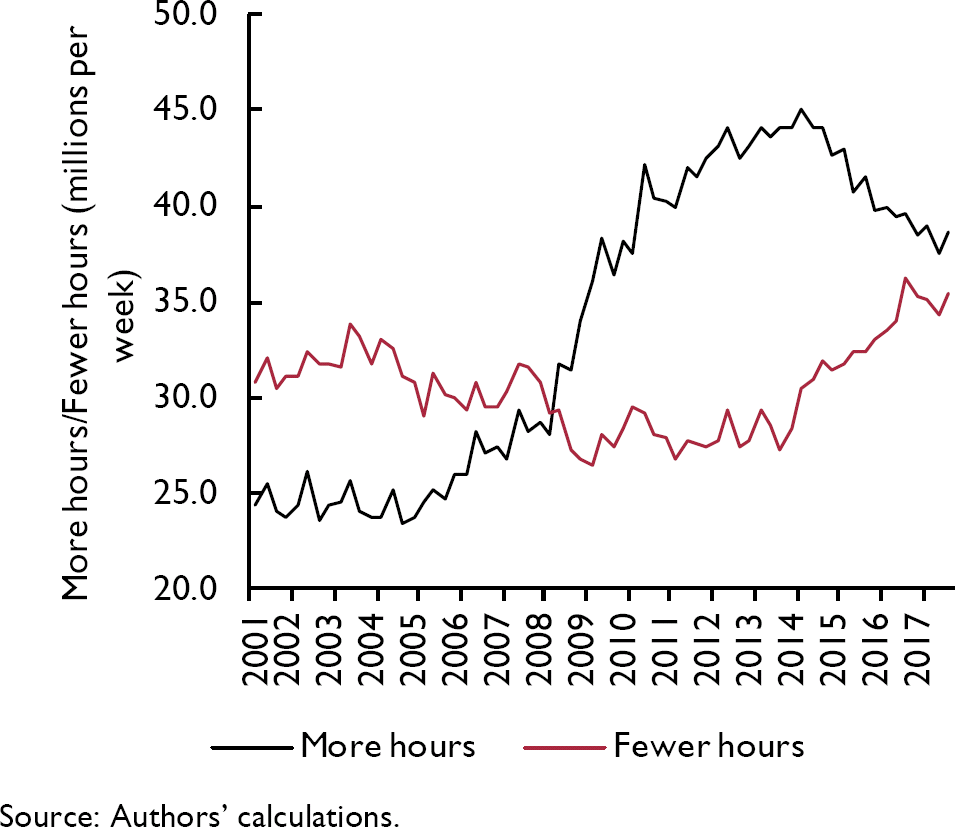
Figure 3 shows how that comes about. It plots aggregate under hours and aggregate over hours. The under hours series is below the over hours series before 2008, when the series cross. The over hours series starts to rise from around 2014, whereas the under hours series seems to have been rising from around 2004 and then declines in 2014. The two are quite close by 2017Q4, with the unemployment rate and the underemployment rate at 4.6 per cent and the underemployment rate at 4.9 per cent (seasonally adjusted).
Aggregate more and fewer desired hours

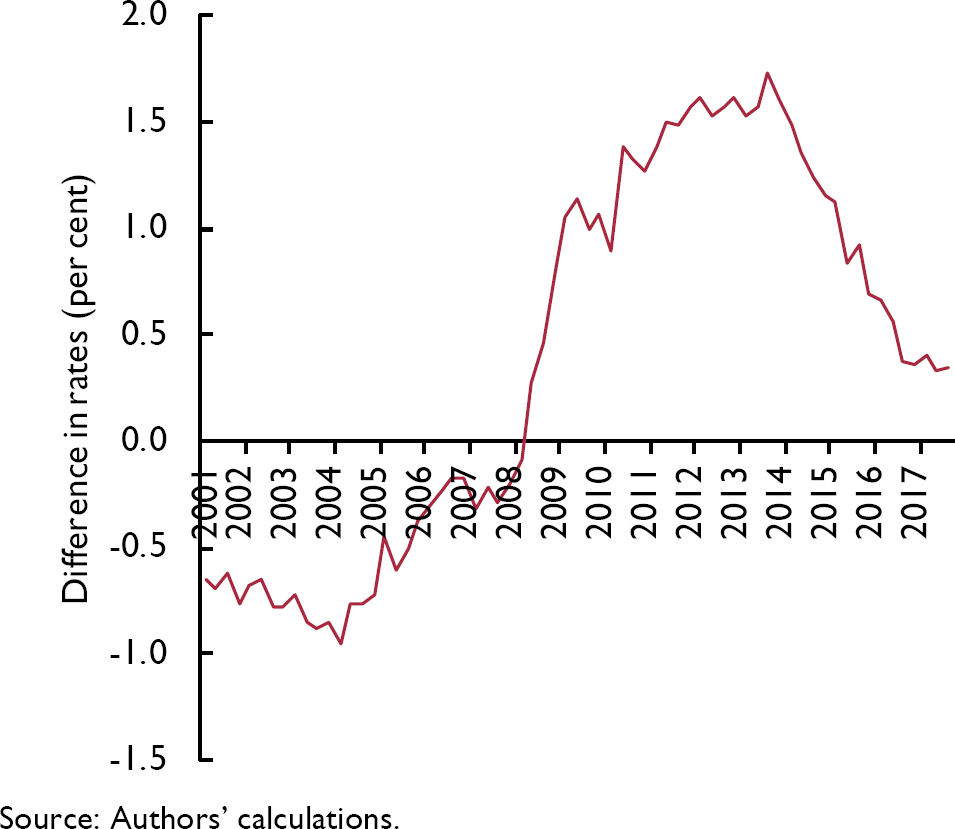
A number of commentators suggested that this chart shows that the underemployment slack has been used up, but figure 4 suggests that may not be correct. In equilibrium, it may be that workers in aggregate want to reduce their hours. For the entire period 2001Q2 to 2008Q2, the number of desired hours was negative, because the numbers who wanted more hours was less than the number wanting less. This suggests there may be more labour market slack to be used up to get back to the conditions prevailing between 2002 and 2004, when the monthly unemployment rate averaged 5.1 per cent.
Difference between the underemployment and unemployment rates
Wages
We now turn to examine wage determination using the LFS micro-level data for the period 2001–17. This builds on earlier work estimating wage equations for the UK in Blanchflower and Oswald (1994a, b) and Reference Blanchflower and BrysonBlanchflower and Bryson (2010). Overall, in our LFS sample we have hourly wage data on 856,366 employees across the pooled data file. We drop around 10,000 cases in the regressions due to missing values. Wages are only reported in waves 1 and 5. The self-employed do not report earnings so therefore they cannot be included in the wage analysis.
Table 4 estimates a log hourly wage equation for employees for the period 2001–17, and then for 2001–8, and finally for 2009–17. In our previous work on underemployment we have not estimated a wage equation with underemployment and over-employment terms. Table 4 includes both the under hours and over hours variables which are negative and positive, respectively, and (highly) significantly so. If the job offers fewer hours than the employee desires, wage increases will be lower.

In contrast, wages are higher in jobs where hours are longer than employees wish – a compensating wage differential. In addition, coefficients on all five categories of part-time working are significantly negative, where full-time is the excluded category. Part-timers who want extra hours are paid less than part-timers who are content with their hours. It seems that having workers in jobs where they want more hours keeps wages down as they accept lower pay, conditional on their characteristics.
In a recent paper, Reference Hong, Kóczán, Lian and NabarHong et al. (2018) estimated relationships seeking to explain wage changes in 29 advanced countries from 2000 to 2016. They augmented the unemployment rate in these relationships with measures of underemployment, arguing that headline unemployment rates are becoming less able to capture accurately labour market slack. They found that “involuntary part-time employment appears to have weakened wage growth even in economies where headline unemployment rates are now at, or below, their averages in the years leading up to the recession.” In a wage change equation, the involuntary part-time employment share enters negatively and significantly in most specifications. Across all countries, on average, a 1 percentage point increase in the involuntary part-time employment share is associated with a 0.3 percentage point decline in nominal wage growth. It should be said, though, that their equations look to be mis-specified as they do not contain a lagged wage term.
The authors have very kindly shared their data with us. It comprises an unbalanced panel of 688 observations on wages, involuntary employment as a share of total employment and the unemployment rate on 28 countries.Footnote 4Table 5 reports the results of estimating wage change equations that also include a highly significant lagged wage term. Both the unemployment rate and the involuntary share variables enter significantly negative. Looking at column 4 of table 5 a 1 percentage point increase in the involuntary part-time rate is associated with a 0.14 percentage point decline in nominal wage growth. This is over and above the impact of the unemployment rate.

It is clear that the unemployment rate fails to explain fully the level of slack prevailing in most OECD countries since the Great Recession. But it does seem that underemployment cannot, on its own, explain low levels of wage growth. A further possibility exists, namely that there has been a structural shift in the UK economy such that the natural rate of unemployment, or the NAIRU, has shifted downwards. The data seem also to support this contention. Price inflation and wage inflation both remain benign. And the UK seems to be a long way from full employment.
The natural rate of unemployment or the NAIRU in the UK has fallen
In his 1968 address to the American Economic Association, Milton Reference FriedmanFriedman (1968) famously argued that the natural rate of unemployment can be expected to depend upon the degree of labour mobility in the economy.Footnote 5 The functioning of the labour market will thus be shaped not just by long-studied factors such as the generosity of unemployment benefits and the strength of trade unions but also by the nature, and inherent flexibility and dynamism, of the housing market.
Friedman also made clear that the natural rate of unemployment is not unchanging: “I do not suggest that it is immutable or unchangeable. On the contrary, many of the market characteristics that determine its level are man-made and policy-made.” Friedman goes on to argue, for example, that the strength of union power and the size of the minimum wage all make the natural rate higher; their declines in recent years then make the natural rate lower. He further suggests that improvements in labour exchanges, in availability of information about job vacancies and labour supply, all of which have been enhanced by the internet, tend to lower the natural rate. That, we contend, is what has happened. The natural rate of unemployment in advanced countries has fallen sharply since the Great Recession.
Friedman continues: “The natural rate of unemployment is such that at a lower rate of unemployment indicates that there would be an excess demand for labor that will push up wage rates. A higher level of unemployment is an indication that there is an excess supply of labor that will produce downward pressure on real wage rates.” (p.8).
Then Chair of the US Federal Reserve, Janet Yellen, in a speech in September 2017 raised the possibility that indeed, the natural rate has fallen and perhaps by a lot:Footnote 6 “some key assumptions underlying the baseline outlook could be wrong in ways that imply that inflation will remain low for longer than currently projected. For example, labor market conditions may not be as tight as they appear to be, and thus they may exert less upward pressure on inflation than anticipated”
And later:
“The unemployment rate consistent with long-run price stability at any time is not known with certainty; we can only estimate it. The median of the longer-run unemployment rate projections submitted by FOMC participants last week is around 4½ per cent. But the long-run sustainable unemployment rate can drift over time because of demographic changes and other factors, some of which can be difficult to quantify – or even identify – in real time. For these and other reasons, the statistical precision of such estimates is limited, and the actual value of the sustainable rate could well be noticeably lower than currently projected.”
That makes sense. It is our contention that the natural rate of unemployment in most advanced countries is well below 4 per cent and perhaps even below 3 per cent. Employment rates and participation rates can rise, and unemployment rates can fall and by a lot.Footnote 7 Globalisation has weakened worker's bargaining power. Migrant flows may have put downward pressure on wages and greased the wheels of the labour market as their presence increased mobility. The decline in the home ownership rate, which slows job creation and increases unemployment, has helped mobility and lowered the natural rate (Reference Blanchflower and OswaldBlanchflower and Oswald, 2013).
The Great Recession exposed underlying economic weaknesses and displayed to the populace the possibility of catastrophic declines in house prices and pension pots. The balance between capital and labour shifted once again towards capital. Workers are frightened in a way that they weren't pre-recession. They are afraid that firms will move production facilities abroad or out-source: in addition, a public sector pay freeze has helped moderate private sector pay increases.Footnote 8 Workers are frightened and have less bargaining power than before. Hence the natural rate has fallen and that is why there has been no spurt in wage growth as the unemployment rate fell from 8 per cent to 6 per cent and from 6 per cent to 4 per cent.
As William Beveridge noted in 1944, “full employment means that unemployment is reduced to short intervals of standing by, with the certainty that very soon will be wanted in one's old job again or will be wanted in a new job that is within one's powers … it means that the jobs are at fair wages, of such a kind, and so located that the unemployed men can reasonably be expected to take them: it means, by consequence, that the normal lag between losing one job and finding another will be short” (p. 18). We are a long way from that. We are standing by.
Reference Staiger, Stock, Watson, Romer and RomerStaiger, Stock and Watson (1997a) examined the precision of estimates of the natural rate of unemployment. They note that the NAIRU “is commonly taken to be the rate of unemployment at which inflation remains constant. Unfortunately, the NAIRU is not directly observable…. The task of measuring the NAIRU is further complicated by the general recognition that, plausibly, the NAIRU has changed over the post-war period, perhaps as a consequence of changes in labor markets.” They further note that “a wide range of values of the NAIRU are consistent with the empirical evidence” and crucially, that the trigger point – when wages and prices start to rise – is poorly estimated. For example, they estimate a NAIRU for the US of 6.2 per cent in 1990 with a 95 per cent confidence interval of 5.1 per cent to 7.7 per cent. In Reference Staiger, Stock and WatsonStaiger, Stock and Watson (1997b) they argue that the tightest of the 95 per cent confidence intervals for 1994 in the US is 4.8 per cent to 6.6 per cent. They conclude that “it is difficult to estimate the level of unemployment at which the curve predicts is constant rate inflation”
It is our contention that the NAIRU has fallen sharply in the UK post the Great Recession and is likely closer to 3 per cent – and maybe well below it – than to 4 per cent or so as claimed by the MPC and others.
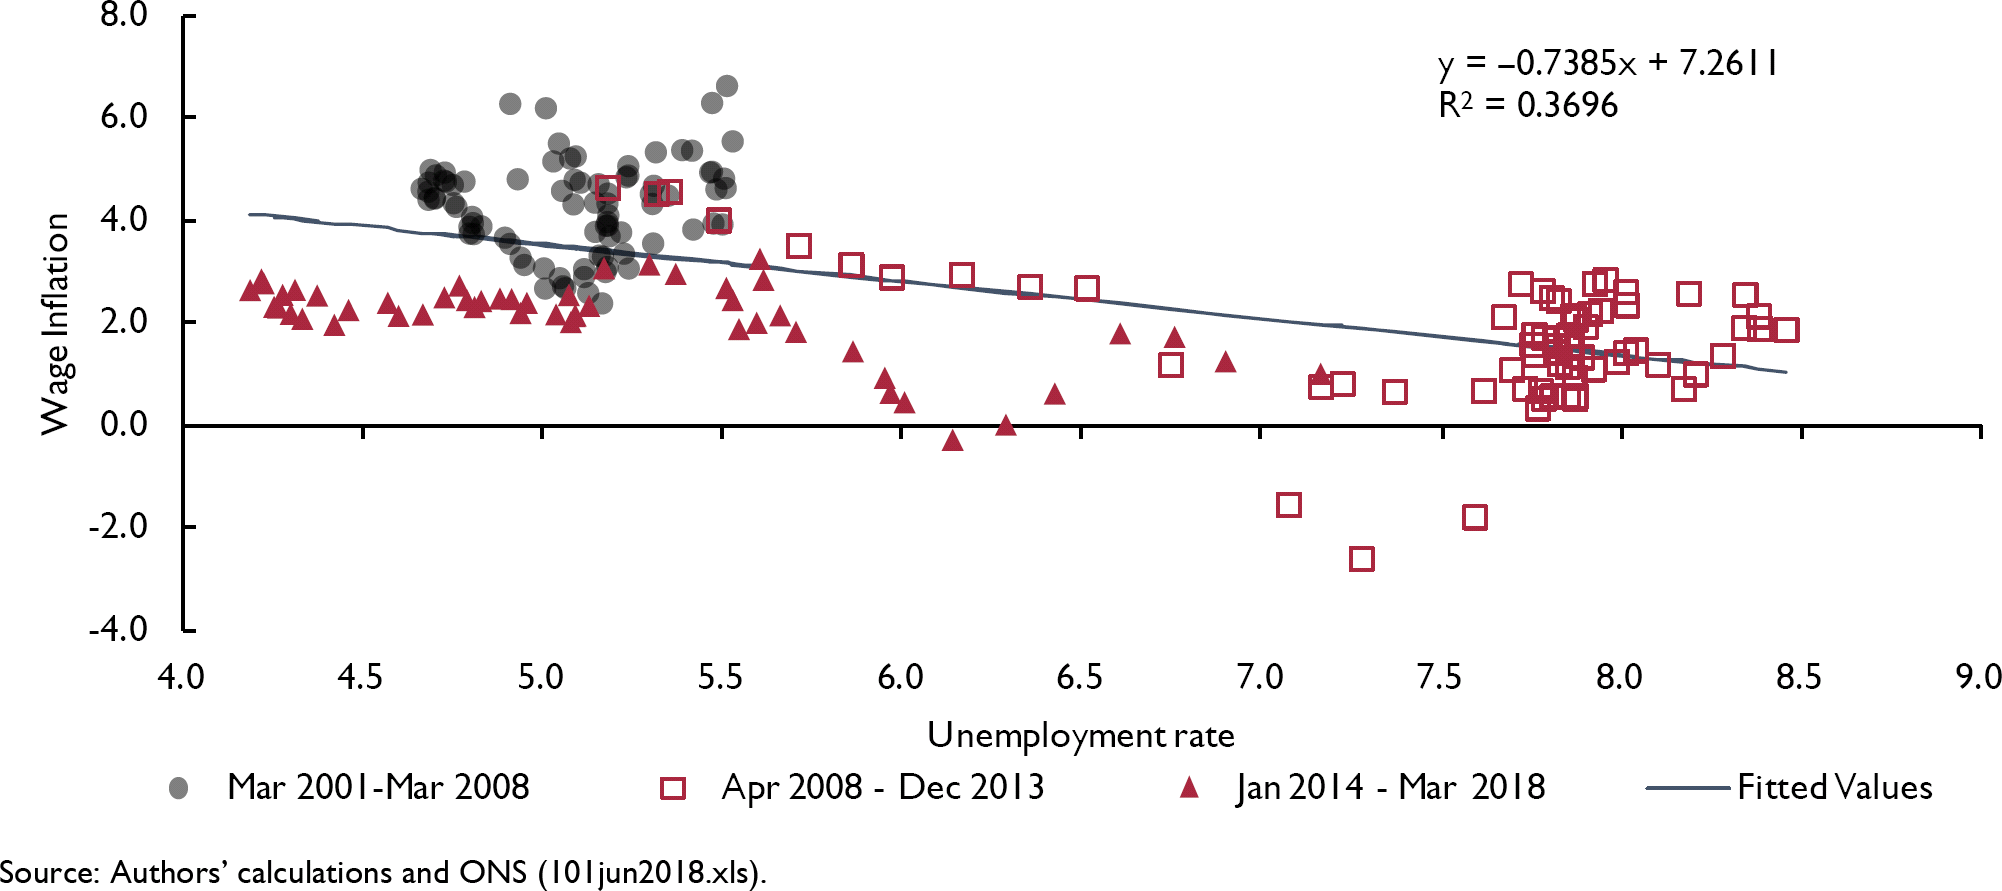
In a recent speech MPC member Gertjan Vlieghe argues that a credible Phillips curve still exists in the UK. We disagree. His main evidence was, firstly, a plot of wage changes against the unemployment rate using AWE data published by the Office of National Statistics monthly for the period 2001–17. He focused on regular pay, excluding bonuses, which makes little sense given that workers don't care what their pay is called. No other wage series in the world separates bonuses from total pay. Vlieghe showed that the data indicated a negative relationship between unemployment and wage growth in the UK since 2001.
Figure 5 plots the 3mth/3mth monthly AWE weekly wage growth total pay series and the monthly unemployment rates.
Monthly wage Phillips curve and unemployment, March 2001–March 2018


It is clear that there are three distinct areas in the data marked as circles, triangles, and squares. The first is top left plotted as circles, between March 2001 and March 2008 which everywhere has wage growth over 2 per cent to over 6 per cent. This is the pre-recession zone. Then there is the recession zone marked as triangles in the bottom right, from April 2009 to December 2014 along with a transition path from unemployment rates of around 5.5 per cent to nearly 8.5 per cent. The third area is plotted as squares, from January 2015 to March 2018 also with a transition path as the unemployment rate falls from over 7 per cent to 5 per cent and below.
We re-estimate Phillips curves on these three zones. For simplicity we omit the recession months of April 2008 – May 2009. In part that is because of the three outlier months of February–April 2009, with significant negative wage growth, which is driven by a single outlier month of data for February 2009 of −5.8 per cent. AWE weekly wages drop from £433 in January to £418 in February and back to £435 in March.
It is clear that the plot in equation (1) doesn't seem to apply to the first two periods as the Phillips curve slopes up. It slopes down in the recovery period but is much shallower than in equation (1) for the entire period.


If we plug in 4.2 per cent unemployment rate, prevailing in April 2018 into equation (1) it forecasts wage growth of 4.1 per cent against the actual rate of 2.6 per cent. Equation (4) with the same unemployment rate predicts wage growth of 2.7 per cent.
We also estimated a best fit line using AWE total pay averaged by quarter against our quarterly underemployment rate. The best fit line is

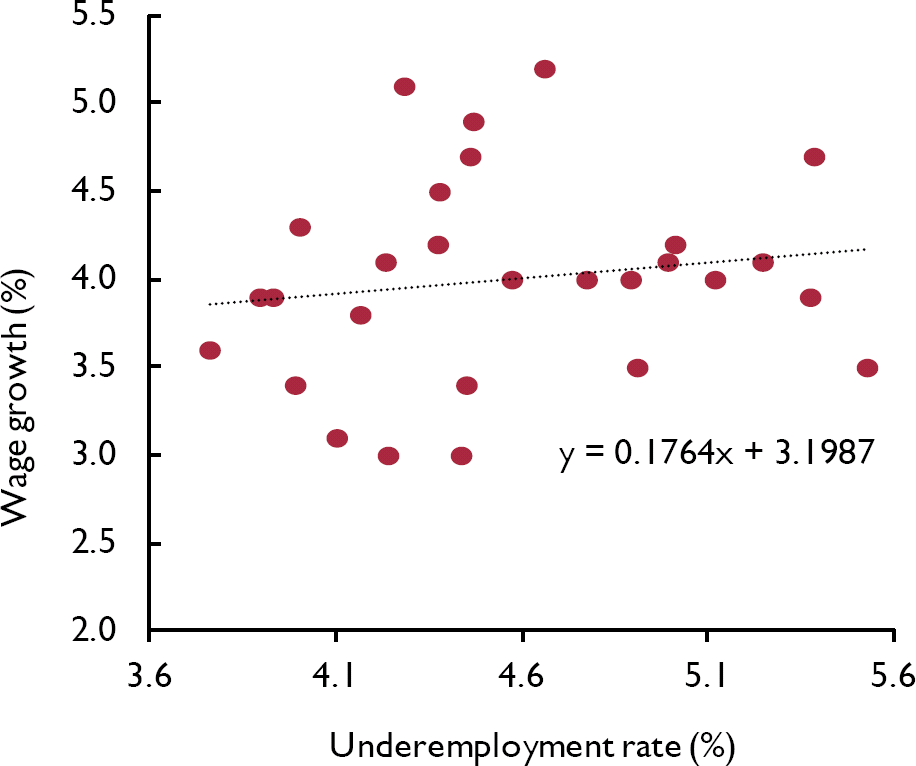
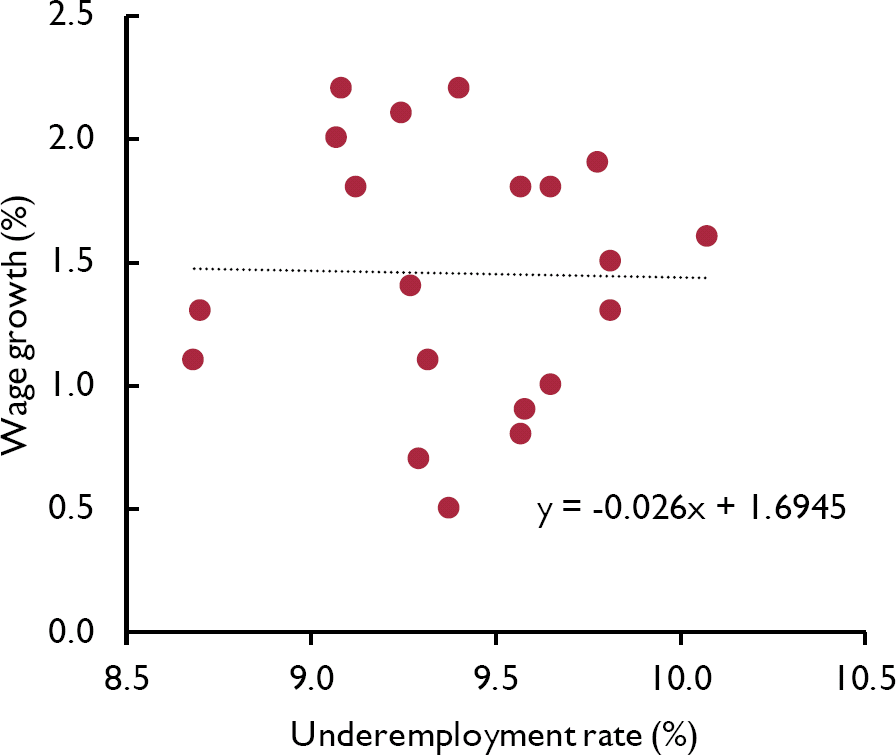
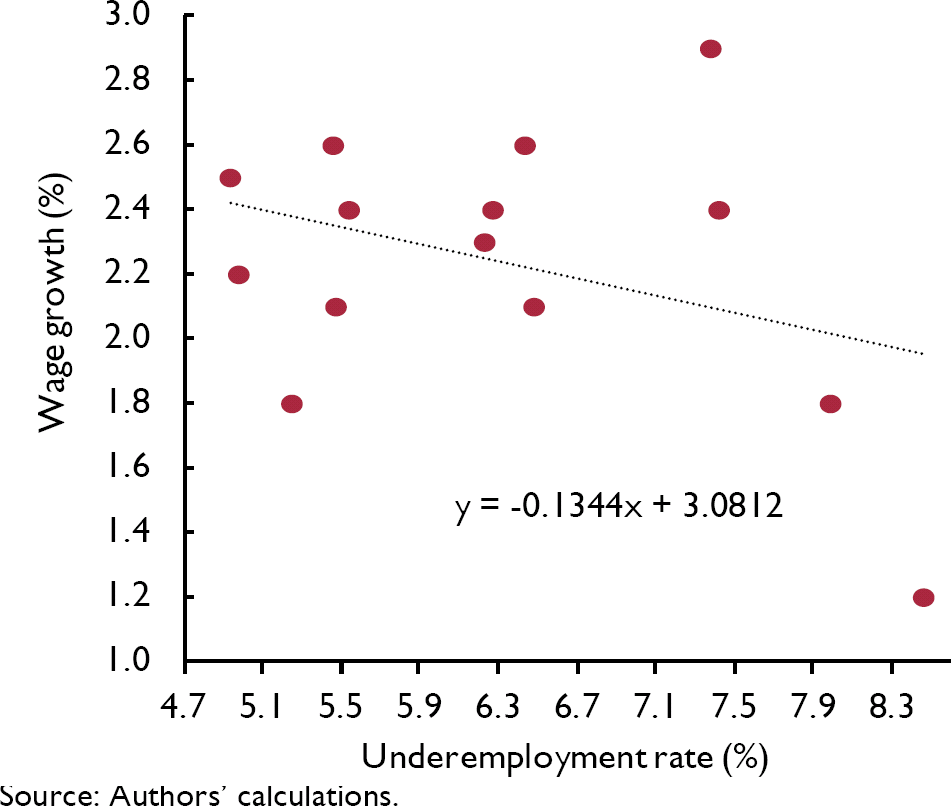
Figure 6 then presents three plots Phillips curves using our underemployment rates, against AWE total pay data averaged by quarter for the pre-recession (2001Q2 to 2008Q1), immediate post-recession (2009Q3 to 2013Q4) and later period (2014Q1 to 2017Q4). For simplicity, again we omit the five recession quarters of 2008Q2–2009Q2. As with the unemployment rate in the first period the best fit line slopes upwards. The second period is essentially flat. Finally, there is a downward sloping Phillips curve in underemployment space in the latter period. It has the following equation.
UK underemployment rate Phillips curve, 2001Q2–2008Q1

UK underemployment rate Phillips curve, 2009Q3–2014Q2

UK underemployment rate Phillips curve, 2014Q3–2017Q4


At the most recent underemployment rate for 2017Q4 of 4.9 per cent, wage growth is predicted by equation (6) to be 3.6 per cent, whereas in the latter period it is 2.4 per cent. At an underemployment rate of 3.8 per cent, its historical low since 2001, wage growth is predicted to be only 2.6 per cent. An obvious issue is whether wage growth would rise rapidly once full-employment has been reached but there is nothing in the data to suggest this is imminent. In April 2015 AWE 3mth/3mth total pay wage growth was 2.4 per cent with an unemployment rate of 5.5 per cent. Three years later, in April 2018 the unemployment rate was 4.2 per cent and wage growth was 2.6 per cent.
A hypothesis of no structural break in the relationship between underemployment or unemployment and wage inflation is rejected for each year from 2006 onward using standard Wald tests. In addition, the Reference Elliott and MüllerElliott-Muller (2006) test for the absence of persistent time variation in the underemployment coefficient is decisively rejected (test statistic = −45.232, 1 per cent critical value = −11.05) with a similar result being obtained for unemployment.
The second piece of evidence in Vlieghe's speech was an econometric analysis estimating a wage growth equation – a Phillips curve – using 256 observations from 1997 through 2017 disaggregated by sector. He includes a lagged unemployment rate, a lagged dependent variable and a set of sector dummies. His findings suggest a significant impact of unemployment on wages – “one percentage point increase in the unemployment rate in a sector lowers wage growth in that sector by half a per cent in the following year”. This suggests a considerable sensitivity of wages to unemployment: given that the unemployment rate has fallen from a peak value of 8.5 per cent in September–November 2011 to 4.2 per cent currently (March–May 2018), wage growth should have increased by around 2 per cent. However, the increase in wage growth over this period has only been around 0.7 per cent. Nevertheless, Vlieghe points out that Phillips himself did not expect the relationship to hold rigidly. He also acknowledges that the pattern of time dummies in his model, which capture factors affecting all industrial sectors simultaneously, has shown an increasingly negative pattern over time, implying that other unobserved factors have been depressing wage growth. These factors may include underemployment.
He also estimates a Phillips curve which includes lagged unemployment and wage growth interacted with a postcrisis dummy. Neither turn out to be significant, though how these variables interact with what is being captured by the year dummy effects would have been worth exploring. His interpretation is that the Phillips curve is in robust health, but that it moved downwards for a period of time during the crisis and its immediate aftermath. Given that the underemployment rate rose faster than the unemployment rate during the recession and has subsequently returned to close to the unemployment rate, his finding is also not necessarily inconsistent with a model where underemployment is the main driver of wage growth, rather than unemployment. Indeed in his discussion, Vlieghe acknowledges that underemployment may have played a role in depressing wage growth over and above the unemployment rate.
We explored this issue further using the same LFS micro-data for the years 2001–17. We constructed unemployment, underemployment and wages by twenty regions across 66 quarterly waves, using earnings weights, and then constructed an equivalent annual wage change measure from the LFS across four waves and then a four-wave lag. In total there are 1260 observations. Using a broadly equivalent specification to Vlieghe's, we were unable to find any significant unemployment effects on wage growth, but we do find underemployment effects on both weekly and hourly pay. The results are reported in table 6.

We first regress the log of hourly pay on a four-quarter lag and the unemployment rate, along with full sets of wave and region dummies. The wave dummies pick up the outlier months with negative growth referred to earlier. We initially include the log of the unemployment rate which is insignificant. We then add an underemployment measure, the log of the number of additional hours the underemployed would like. This enters significantly negative in the second column and remains significant in the third column when the unemployment rate is dropped. The results are the same in the final three columns that use weekly wages. The Phillips curve in the UK has now to be rewritten into wage underemployment space.Footnote 11
We conclude the relationship between wage growth and labour market slack is much flatter in the recent period than in previous periods. The Phillips curve in the UK has now to be rewritten in wage and underemployment space and is much flatter than in the past. The implication is that the NAIRU is lower than it was in the past. That is not to say that wage growth will not rise towards 4 per cent, but not until there is much less slack in the UK labour market.
Productivity and employment
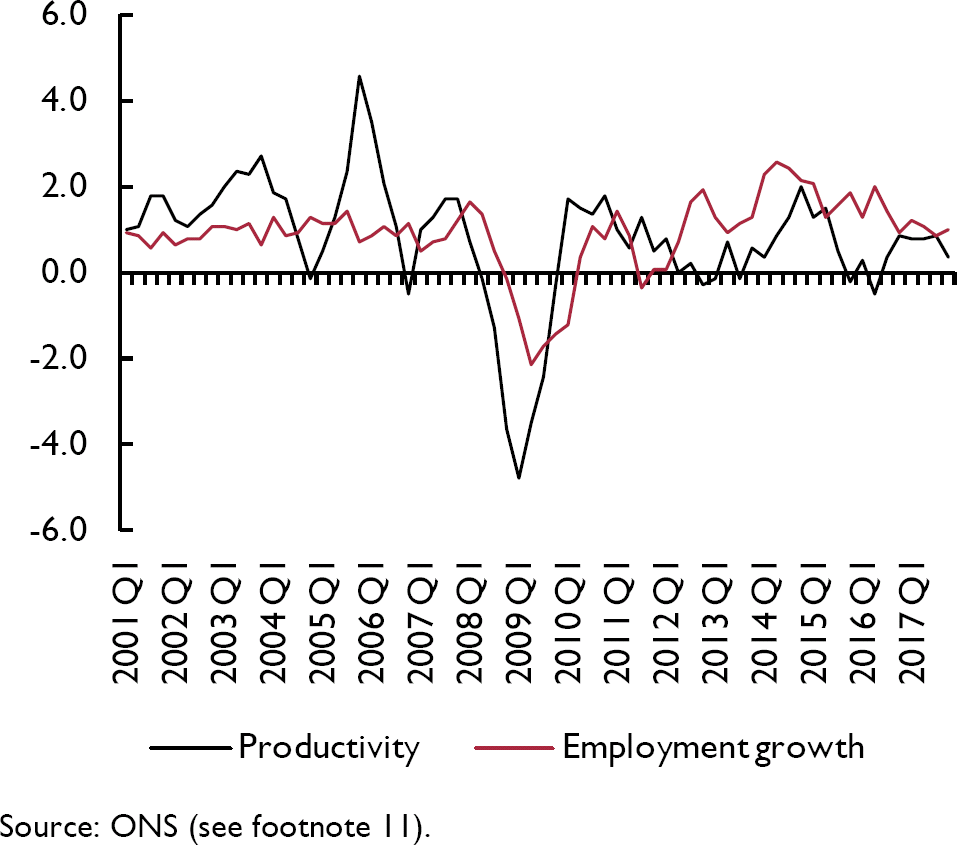
Figure 7 plots productivity growth rates per worker and employment growth rates for the UK from 2001.Footnote 12 Employment growth picked up as productivity slowed. Employment growth rates, according to the ONS, were as follows – where we calculate the average monthly annual growth rates of employment.
Productivity growth per worker and employment growth rates %, 2001Q1–2017Q4


The Great Recession saw a fall in employment from 2008 through 2010. Then after that employment rose at an average record annual pace of 1.3 per cent. Over the period January 2010 through January 2018, the employment rate rose from 58.0 per cent to 60.9 per cent, while real average weekly wages fell from a high of £522 in February 2008 to £488 in January 2018, or by over 6 per cent. In contrast, in the USA employment rates fell from 62.9 per cent to 60.4 per cent while real weekly wages in the private sector rose from $343.72 to $369.72 (in 1982–4 dollars).
As background we should also note that productivity growth has declined steadily over time in the UK. According to the ONS productivity rates were as follows.

To put this in context, UK productivity is 17 per cent below the average for the rest of the G7 in 2015.Footnote 13 By 2015, the UK produces in five days what it takes the US, Germany and France to produce in four. There is little or no sign of catch-up. It is hardly surprising that wages have not risen – something structural has happened. Productivity growth is a third of what it was from 1960–2000.
Higher productivity tends to lead to higher real wages and is associated with higher consumption levels and better health.Footnote 14 It seems that another contributory factor to slowing wage growth has been the falling rate of productivity increase. The very low wage growth rates in the last few periods have occurred when output per head was growing at less than 1 per cent and employment growth was slowing.Footnote 15 Low paid workers were hired. There was an industry-wide slowdown in business investment during the crisis and subdued growth since, which helps to explain the productivity slowdown.
Consistent with that is the recent work by Reference Haltiwanger, Hyatt, Kahn and McEntarferHaltiwanger et al. (2018) in the United States, who found strong evidence of a firm wage ladder that was highly pro-cyclical. During the Great Recession, this firm wage ladder collapsed, with net worker reallocation to higher wage firms falling to zero. They found that in the Great Recession, movement out of the bottom rung of the wage ladder declined by 85 per cent, with an associated 40 per cent decline in earnings growth. They find that upward progress from the bottom rung of the job ladder declines by 40 per cent in contractions, relative to expansions.
Productivity is low when wage growth is low. A pay freeze in the public sector that has existed in the UK since 2010 has not helped to motivate staff. Workers on low pay are not motivated to work harder. In addition, in contrast to the United States, the employment rate in the UK has recovered to post-recession levels.Footnote 16 In both countries private sector unionisation rates have collapsed so workers appear to have less bargaining power than in the past.Footnote 17
Reference Blundell, Crawford and JinBlundell et al. (2014) have noted that the supply of workers in this recession was higher than in previous recessions: the labour supply curve has shifted to the right. However, despite the increase in supply occurring among groups towards the lower end of the jobs market, they found there is strong evidence against the composition or quality of labour hypothesis as a potential explanation for the reduction in wages and hence productivity that we observe. They found that there are more individuals willing to work at any given wage and thus that there is likely to be greater competition for jobs. As a consequence, Blundell et al. argue, workers are likely to have lower reservation wages than in the past and seem to attach more weight to staying in work (because their expected time to find another job is longer than in the past) than on securing higher wages and are thus willing to accept lower wages in exchange for holding onto their job.
Reference Stansbury and SummersStansbury and Summers (2018), for the US, find evidence of linkage between productivity and compensation: over 1973–2016, 1 percentage point higher productivity growth has been associated with 0.7 to 1 percentage points higher median and average compensation growth and with 0.4 to 0.7 percentage points higher production/nonsupervisory compensation growth. They further find the relationship between average compensation and productivity in Canada, West Germany (pre-unification), the UK and the USA to be strong and positive with the effects somewhat weaker for France, Italy and Japan.
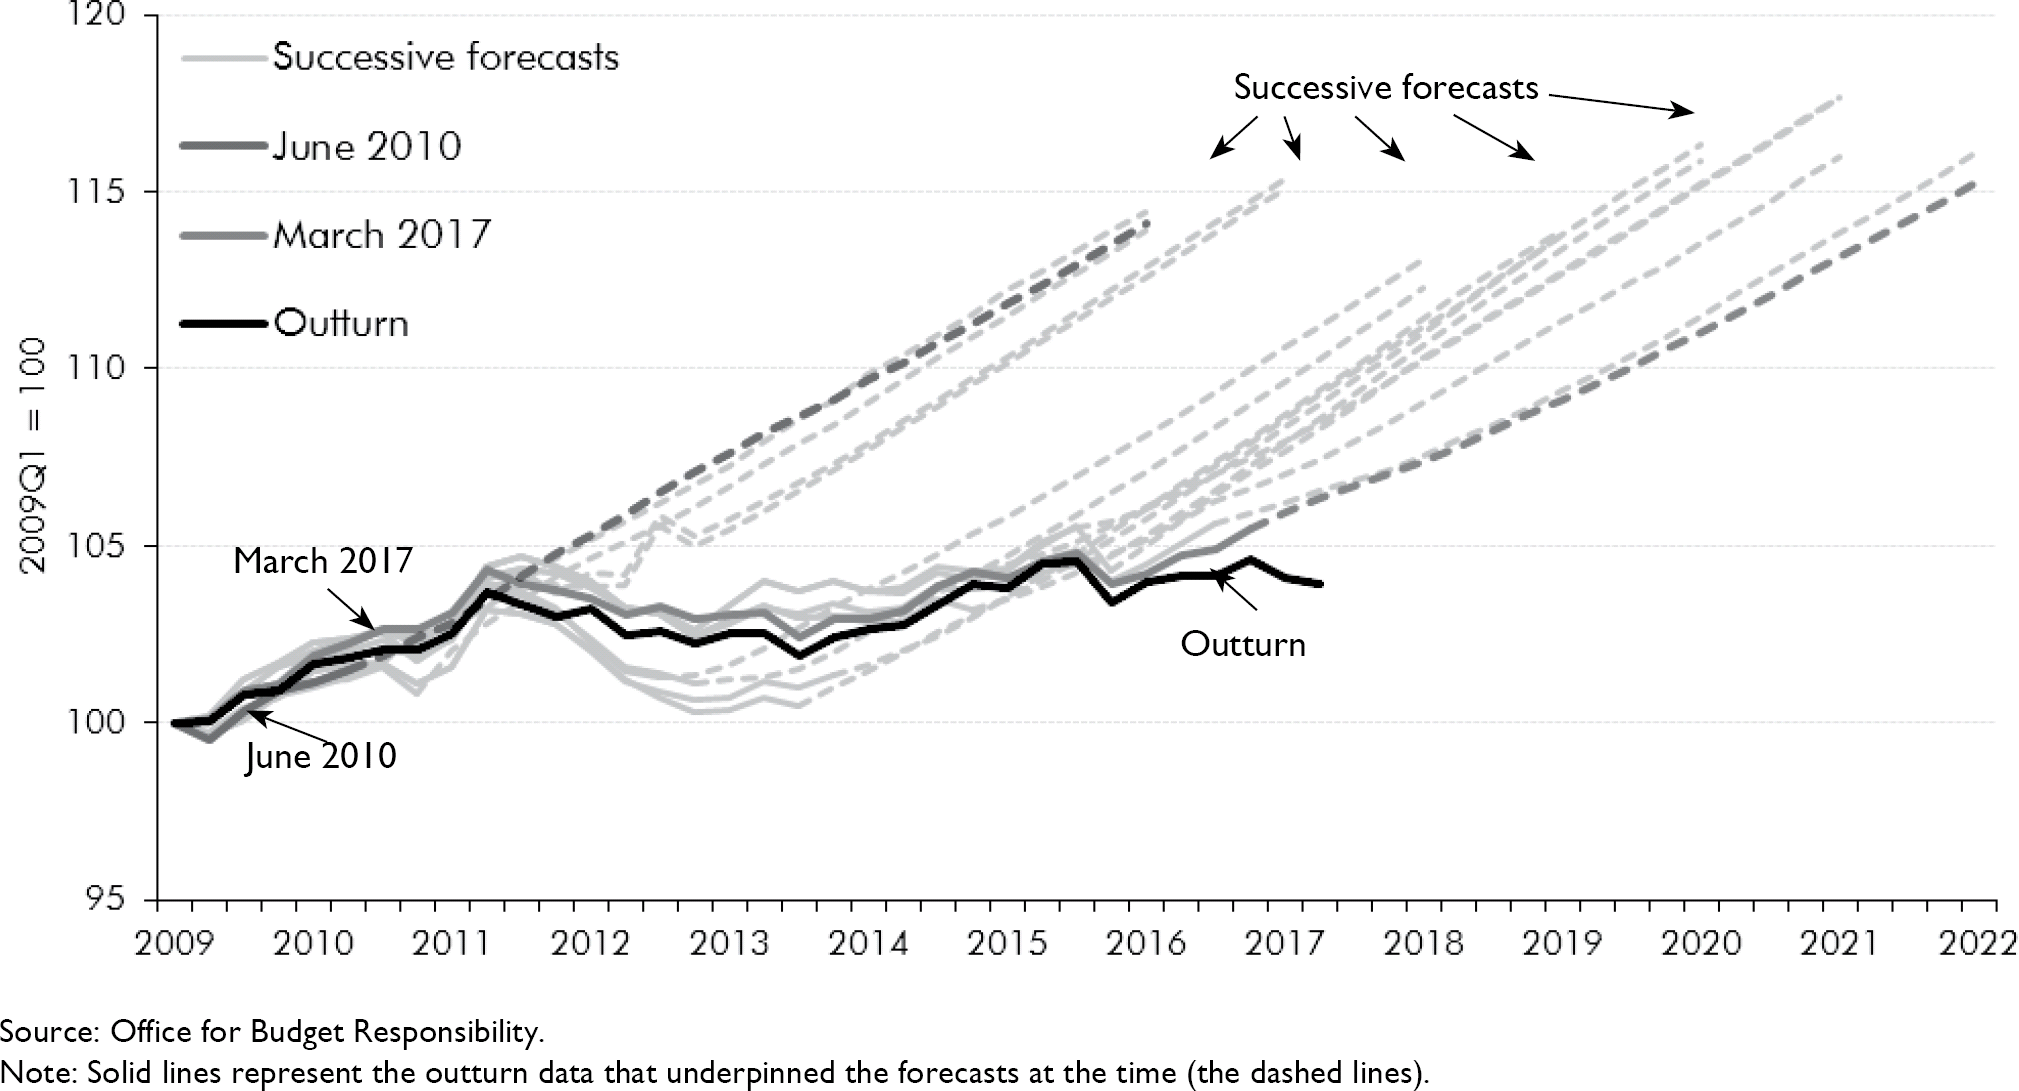
UK forecasters, including the Bank of England, have consistently predicted that productivity growth would recover to a rate close to its 1970s–2000s average. The Office for Budget Responsibility (OBR) continued to assume this recovery would occur, although reasons were never given. Figure 8 is taken from the OBR's March 2017 Forecast Evaluation Report and shows successive and essentially unchanging and terrible OBR productivity forecasts and the actual data. The black line on the chart shows the outcome over the period from 2009 through 2017 along with sixteen successive forecasts. Each forecast implausibly slopes up sharply and they are basically parallel to each other. Each of them forecasts an explosion of productivity growth which never happened but there was zero learning and no change. The latest March 2017 report showed a very slight shallowing. Each assumed the productivity puzzle was solved when it wasn't. There was no learning.
Successive OBR productivity forecasts (output per hour) for the UK, 2010–17

Of interest is the timing of the collapse of productivity growth. This follows almost exactly from the introduction of austerity in the UK's Budget of June 2010. The changes took a little time to have an impact so if we assume 2011Q2 as a reasonable starting point for the effects of austerity, output per hour was 103.7, with 2009 = 100. By 2017Q2 it was 103.9.
In October 2017, in its Forecast Evaluation Report (FER) the OBR produced a mea culpa admitting it had been wrong all along; the productivity puzzle had not been solved and the UK economy was not set to mean revert to pre-recession levels.
“One recurring theme in past FERs has been productivity falling short of our forecasts…. Our rationale for basing successive forecasts on an assumed pick-up in prospective productivity growth has been that the post-crisis period of weakness was likely to reflect a combination of temporary, albeit persistent, influences. And as those factors waned, so it seemed likely that productivity growth would return towards its long-run historical average.” (p.6)
And later:
“While we continue to believe that there will be some recovery from the very weak productivity performance of recent years, the continued disappointing outturns, together with the likelihood that heightened uncertainty will continue to weigh on investment, means that we anticipate significantly reducing our assumption for potential productivity growth over the next five years in our forthcoming November 2017 forecast,” (p.7).
Flat productivity led to flat wage growth.
Conclusion
Wage growth continues to be close to 2.5 per cent despite low unemployment rates in the UK and the US in particular. It seems that the unemployment rate understates labour market slack. But perhaps more importantly, something has changed in the years since the Great Recession. The very low level of the unemployment of 4.3 per cent prevailing in the UK at the time of writing may not indicate that the UK is close to full-employment.
Our findings suggest that some of the reason for that is because the unemployment rate understates labour market slack. Underemployment is more important than unemployment in explaining the weakness of wage growth in the UK. In the pre-recession years the underemployment rate hit a low of 3.8 per cent in 2004Q1 and was associated with steadily rising wage growth which hit 4.5 per cent in 2005Q3 (Appendix 1). There is every reason to believe that now it could go even lower – perhaps even below 3 per cent – before there is an equivalent up-tick in wage growth. The Phillips curve in the UK has now to be rewritten into wage underemployment space.
There is every reason to believe that the natural rate of unemployment has fallen sharply since the Great Recession. That is why there hasn't been a burst of wage growth as the unemployment rate has fallen, from 8 per cent to 6 per cent to close to 4 per cent. In our view the NAIRU in the UK may well be nearer to 3 per cent, and even below it, than around 5 per cent which other commentators including the MPC and the OBR believe.
In the years 2000–8 there was no relationship between high wage growth of around 4 per cent and the relatively low unemployment rate. Then the Great Recession came along and everything shifted down with lower wage growth and higher unemployment. Once recovery happened there was a transition to a new flatter equilibrium with low unemployment of less than 5 per cent and low wage growth of around 2 per cent.
A big question is how low can unemployment go. William Reference BeveridgeBeveridge (1960) tells the story in the prologue to his book, written sixteen years after the report was first published, that as a ‘conservative rather than unduly hopeful aim’ of the amount of temporary idleness that might be expected under full employment he had suggested in 1944 a figure of 3 per cent of the labour force at any time. When Keynes saw this number, he wrote to Beveridge to say that he saw no harm in aiming at 3 per cent but that he would be surprised if it could go so low in practice. During the twelve years from 1948 through 1959 Beveridge was surprised to find the unemployment rate averaged 1.5 per cent with no wage explosion. Here are the UK numbers: 1948–50=1.5 per cent; 1951 = 1.2 per cent; 1952=2.0 per cent; 1953=1.6 per cent; 1954=1.3 per cent; 1955=1.1 per cent; 1956=1.2 per cent; 1957=1.4 per cent; 1958=2.1 per cent and 1959=2.2 per cent. Unemployment may surprise on the downside again.
Underemployment continues to push down on wage pressure even though the unemployment rate is low. Over and above that we present evidence that the UK Phillips curve has flattened and as a result the UK NAIRU has shifted down. The combination of elevated underemployment and a flattened Phillips curve means that wage growth is not going to take off any time soon.
Appendix 1. UK unemployment and underemployment rates, and growth in average weekly earnings