Implications
Our aim was to investigate the impact of repeated acidosis challenges on rumen fermentation, microbial ecosystem and inflammatory response in sheep, and to study the effect of live yeast supplementation on these parameters. The results suggest that rumen pH has to be measured in conjunction with other parameters to accurately diagnose subacute rumen acidosis. Prospective work is needed to highlight a more adequate combination of rumen and peripheral parameters to better identify this disorder. Sheep response to an acidosis diet is greatly influenced by their feeding history. For experimental purposes, the dietary history of each animal should be taken into account when designing a study. From a practical point of view, high-producing animals may respond differently to high-energy diets, depending on their record of past acidosis events. In this context, yeast supplementation may help to stabilise such animal variability and to decrease associated production losses.
Introduction
Intensive ruminant rearing techniques use high-energy diets based on high-starch and low-fibre contents to stimulate production. This practice, however, can induce digestive disorders if it is not well managed. In particular, ruminants may develop rumen acidosis if the shift from high-fibre to high-energy diets is operated in a short transition period. The subclinical form, known as subacute rumen acidosis (SARA), is more pervasive than the acute clinical form and also more difficult to diagnose (Nagaraja and Titgemeyer, Reference Nagaraja and Titgemeyer2007). SARA is frequent in high-producing cattle, particularly in dairy herds (Kleen and Cannizzo, Reference Kleen and Cannizzo2012). SARA is associated with an erratic and/or reduced feed intake (Dohme et al., Reference Dohme, DeVries and Beauchemin2008) and suboptimal fibre digestion with subsequent knock-on effects on production. SARA can also lead to health disorders such as diarrhoea, laminitis or liver abscesses (Plaizier et al., Reference Plaizier, Krause, Gozho and McBride2008).
SARA has been defined as an increase in volatile fatty-acid (VFA) concentration in the rumen that leads to an intermittent and moderately depressed rumen pH (Krause et al., Reference Krause, Garrett and Oetzel2006). Integrative pH parameters such as time or area (time×pH) under pH between 5.5 and 6.0 have been increasingly used to describe the duration and intensity of acidosis (Keunen et al., Reference Keunen, Plaizier, Kyriazakis, Duffield, Widowski, Lindinger and McBride2002). Recently, an average daily period of 4.7 or 8.0 h below pH 5.6 or 5.8, respectively, has been suggested as thresholds for cows suffering from SARA (AlZahal et al., Reference AlZahal, Kebreab, France and McBride2007).
Hence, the aetiological process of SARA begins in the rumen where microbial changes are induced by the excess of rapidly fermentable carbohydrates (Mosoni et al., Reference Mosoni, Chaucheyras-Durand, Bera-Maillet and Forano2007; Khafipour et al., Reference Khafipour, Krause and Plaizier2009a). The rumen conditions during SARA induce growth, death and lysis of some gram-negative bacteria that release endotoxins such as bacterial lipopolysaccharides (LPS). This leads to a systemic inflammatory response characterised by an increase of acute phase proteins such as serum amyloid A (SAA) and haptoglobin (HP) (Gozho et al., Reference Gozho, Plaizier, Krause, Kennedy and Wittenberg2005).
Of the SARA-preventing strategies, live yeast or bacteria are increasingly used as ruminant direct-fed microbials. The positive effect of live yeast as rumen pH stabilisers has been consistently reported in recent meta-analyses or reviews (Chaucheyras-Durand et al., Reference Chaucheyras-Durand, Walker and Bach2008; Desnoyers et al., Reference Desnoyers, Giger-Reverdin, Bertin, Duvaux-Ponter and Sauvant2009). Live yeast interact with the rumen microbiota and thereby help to prevent excessive acid load in the rumen (Chaucheyras and Fonty, Reference Chaucheyras and Fonty2006). As a consequence, live yeast improve animal performance, particularly when the risk of SARA is high at critical periods of the animal life, such as calving and early lactation (Desnoyers et al., Reference Desnoyers, Giger-Reverdin, Bertin, Duvaux-Ponter and Sauvant2009). However, it is not well known whether live yeast supplementation could improve rumen microbial fermentation when ruminants encounter successive acidotic bouts. Indeed, the severity of SARA may increase with repeated challenges, partly because of modifications in feeding behaviour (Dohme et al., Reference Dohme, DeVries and Beauchemin2008) and because of possible shifts in rumen microbial communities. An accentuation of alterations of the rumen functioning (fermentation end-product concentrations and proportions, enzymatic activities and balance of rumen ecosystem) has been reported in cows with repeated dietary disturbances (Monteils et al., Reference Monteils, Rey, Silberberg, Cauquil and Combes2012). Consequently, the preventing effect of live yeast on SARA may also be modulated. Moreover, little information is available on the impact of live yeast supplementation on the immune response of the animal experiencing SARA. Therefore, our aim was to investigate in sheep the impact of repeated acidosis challenges (ACs) on rumen fermentations, microbial ecosystem and inflammatory response, and to study the effect of live yeast supplementation on these parameters. Information on feeding and general behaviour of sheep from the same experiment has been published in Commun et al. (Reference Commun, Silberberg, Mialon, Martin and Veissier2012).
Material and methods
The experiment was conducted at the animal experimental facilities of the Herbivores Research Unit of INRA (Saint-Genès Champanelle, France), in accordance with the guidelines for animal research of the French Ministry of Agriculture and applicable European guidelines and regulations (approval: CE10-07).
Animals, treatments and experimental design
Twelve adult Texel wethers were fitted with a rumen cannula (62 mm-bore internal diameter). They were housed in individual stalls of 1.0×1.5 m. At the start of the experiment, animals weighed 48.0±4.3 kg, were 1 to 7 years old and had never been exposed to a cereal-rich diet before. To investigate the effect of live yeast, two groups of six wethers, adjusted for age and weight, were constituted. The yeast-supplemented group (SC) received daily 4×10⁹ colony-forming units (CFU) of Saccharomyces cerevisiae CNCM I-1077 (Levucell®SC20, Lallemand Animal Nutrition, Blagnac, France), freshly resuspended in 9 ml of an anaerobic mineral solution (Brossard et al., Reference Brossard, Chaucheyras-Durand, Michalet-Doreau and Martin2006). The control group (Control) received the anaerobic mineral solution alone. Treatments were introduced in the rumen through the cannula every morning before feeding.
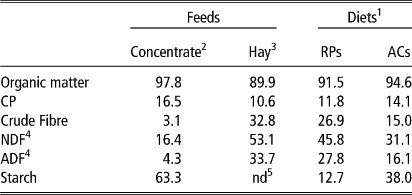
Both groups (SC and Control) were successively exposed to 3 ACs of 5 days each, preceded and followed by resting periods (RPs) of 23 days (Supplementary Figure S1). Wethers were fed a pelleted wheat-based concentrate: chopped Dactylis glomerata hay at 20 : 80 and 60 : 40 ratios (on a dry matter (DM) basis) during RPs and ACs, respectively. The concentrate contained 96% wheat, 2% molasses, and 2% mineral and vitamin mix (BO4505, Agro01, Bourg en Bresse, France). There was no transition between RPs and ACs (Table 1). To limit refusals, diets were offered at 90% of the ad libitum DM intake of hay measured before the experiment started. During RPs, feedstuff were offered twice daily: 65% of DM at 0800 and 35% at 1600 h. During each AC, hay was offered three times daily, 20% at 0800, 30% at 1000 and 50% at 1600 h, whereas the whole amount of concentrate was distributed at 1000 h. During the trial, wethers had free access to water and salt licks (Na, 39.3%; Cl, 60.7%).
Chemical composition of the feeds and diets (% dry matter)
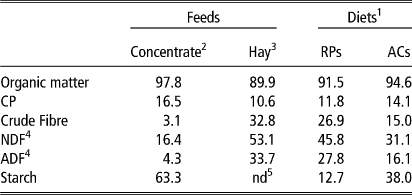
1 RP=resting-period diet, 80 : 20, hay : concentrate; AC=acidosis challenge diet, 40 : 60, hay : concentrate.
2 The values given are for wheat concentrate number cc040 adapted from INRA tables (2007a), with concentrate comprising 96% cc040 wheat+2% molasses+2% of a mineral–vitamin mix (ref. BO4505, AGRO 01, Bourg-en-Bresse, France).
3 Orchard grass (Dactylis glomerata).
4 Calculated from crude fibre according to INRA equations (2007a).
5 nd=not determined, but considered equal to 0.
Rumen pH kinetics
Rumen pH was continuously monitored using an indwelling pH meter as described previously (Brossard et al., Reference Brossard, Martin and Michalet-Doreau2003). The pH was recorded every 5 min during the whole experiment and the electrode was calibrated every 2 weeks. Collected pH values were averaged over 15 min intervals and used for pH kinetics analysis. Mean pH and time spent under pH 5.6 were calculated.
Sampling of rumen contents and blood
During RP1, rumen contents were sampled at days 7 and 21. During the other RPs, rumen contents were sampled at day 21. During each AC, sampling was done at day 5. For each sampling, 300 grams of whole rumen contents were obtained through the cannula at 1400 h (4 h after concentrate feeding). A portion (~50 g) of the whole rumen sample was homogenised on ice for three 1 min cycles with 1 min intervals using a Polytron grinding mill (Fischer Scientific, France). Approximately 0.5 g were transferred into 2 ml Eppendorf tubes and stored at −80°C until molecular biology analyses. The remaining portion of rumen contents was filtered through a 200 µm defined aperture nylon filter to collect rumen fluid. Two millilitres were kept at −20°C until lactate analysis and 800 µl was added to 500 µl of a 0.5 N HCl solution containing 2% (w/v) metaphosphoric acid and 0.4% (w/v) crotonic acid and stored at −20°C for VFA analysis. One millilitre was added to 1 ml MFS solution (3.5% formaldehyde, 0.14 M NaCl, 0.92 mM methylgreen) and stored at room temperature in the dark until protozoa enumeration. One additional millilitre of rumen-filtered fluid was immediately transferred to the laboratory for bacterial and yeast enumeration.
Blood was collected on the same days as rumen contents at 1400 h by jugular venipuncture in heparinised vacuum tubes. Plasma was recovered after centrifugation at 3000×g for 10 min at 4°C within 1 h after collection. Plasma was aliquoted in microtubes and stored at −20°C until analysis.
Biochemical analyses
Organic matter content of hay was determined by ashing samples at 550°C for 6 h. Crude fibre was determined using the Weende method (AOAC, 1990). The chemical composition of the wheat used in the concentrate was estimated from INRA tables (INRA, 2007b). Total lactic acid concentration was assessed in rumen fluid using an enzymatic commercial kit (ENZY+ DL Lactic acid, EZA891+, Biocontrol, Lyon, France) in a 96-well microtitre spectrophotometer. VFA analyses were performed as previously described (Morgavi et al., Reference Morgavi, Boudra, Jouany and Graviou2003) on a gas chromatograph CP9002 (Chrompack) and using crotonic acid as internal standard.
Rumen microbial parameters
Microbial enumeration
For protozoal enumeration, the rumen fluid/MFS solution was diluted in an equal volume of phosphate buffer saline and counted under a microscope (400×) in a Neubauer chamber (Dutscher, Brumath, France).
For bacterial enumeration, serial decimal dilutions of rumen fluid were performed in an anaerobic mineral solution (Bryant and Burkey, Reference Bryant and Burkey1953), under anaerobic conditions. Total Streptococci were enumerated on a bile–esculin–azide agar medium (BK158HA, Biokar diagnostic, Beauvais, France). Culturable Lactobacilli were enumerated on MRS agar medium (Fluka 69964, Sigma-Aldrich, Saint-Quentin Fallavier, France). For each bacterial group, three replicate plates were inoculated per dilution and incubated at 39°C. Bacterial colonies were counted after 48 h incubation. Cellulolytic bacteria were enumerated in a liquid medium containing filter paper cellulose strips as energy source (Mosoni et al., Reference Mosoni, Chaucheyras-Durand, Bera-Maillet and Forano2007). After 2 weeks of incubation at 39°C under O2 free CO2 of three replicate tubes per dilution, the most probable number of cellulolytic bacteria in the rumen sample was assessed using Mc Grady’s tables (Clarke and Owens, Reference Clarke and Owens1983).
Viable yeasts were enumerated on a Sabouraud agar medium (BK025HA, Biokar diagnostic) supplemented with 0.2% (w/v) chloramphenicol (Sigma, Strasbourg, France). Colonies were counted on three replicate Petri dishes per dilution after 48 h incubation at 30°C. Live yeasts were not detected in the rumen of Control sheep; yeast concentration in the rumen of SC-supplemented animals was checked during the covariate period (1 day of each week of the period, 2 to 4 h after feeding), to ensure that the mode of distribution of yeast product was correct. Mean concentration of live yeast was 2.3±1.7×10⁵CFU/ml of rumen fluid.
Quantitative real-time PCR (Q-PCR) and capillary electrophoresis – single stranded conformation polymorphism (CE-SSCP) analysis
DNA extraction was performed using MP Biomedicals extraction and purification kits (Fast DNA Spin Kit and Gene Clean Turbo, MP Biomedicals, Illkirch, France) following the manufacturer’s recommendations. Briefly, 250 mg of thawed rumen contents were homogenised using a Precellys 24 apparatus (Bertin Technology, Montigny-le-Bretonneux, France) in the presence of silica beads and lysis buffer. Extracted DNA was quantified using a Nanoquant Infinite M200 spectrophotometer (Tecan France S.A.S.U., Lyon, France) and DNA samples were kept at −20°C until quantitative real-time PCR and SSCP analysis.
Q-PCR analyses were performed using the Takara SYBR Premix Ex Taq kit (Lonza, France) on a Step One Plus apparatus (Applied Biosystems, Villebon sur Yvette, France). Q-PCR conditions and primer sets targeting the 16S rRNA gene were those described previously by Denman and McSweeney (Reference Denman and McSweeney2006) for Fibrobacter succinogenes and Ruminococcus flavefaciens and by Stevenson and Weimer (Reference Stevenson and Weimer2007) for Selenomonas ruminantium (Supplementary Table S1). For general bacteria quantification, primers 520f and 799r2 were used (Edwards et al., Reference Edwards, Huws, Kim and Kingston-Smith2007a and Reference Edwards, Huws, Kim and Kingston-Smith2007b). For each target, data were calculated from a standard curve prepared from 102 to 109 copies of the nearly complete rrs gene amplified from gDNA extracted from each species. For total bacteria, the standard curve was prepared as described previously (Mosoni et al., Reference Mosoni, Martin, Forano and Morgavi2011). For each target, the Q-PCR efficiency was between 97% and 102% with a slope between −3.0 and −3.4.
CE-SSCP was performed on an ABI Prism 3100 Genetic (Applied Biosystems, Branchburg, NJ, USA) and CE-SSCP profiles were aligned and normalised using Stat-Fingerprints program version 2.0 (Michelland et al., Reference Michelland, Combes, Monteils, Cauquil, Gidenne and Fortun-Lamothe2009) running on R version 2.8.3.
Inflammation-related parameters
Histamine concentration was determined using a commercially available ELISA kit (409010, Neogen Life Science, Ayr, Scotland) on a 96-well microtitre plate with histamine standard solutions (0 to 50 ng/ml). Rumen samples were diluted from 1 : 200 to 1 : 1000 and plasma samples were either undiluted or diluted (1 : 5). Samples were analysed in duplicate. LPS concentration was determined by a chromogenic Limulus amoebocyte lysate (LAL) end-point assay (QCL-1000, Cambrex Bio Science, Walkersville, MD, USA), in 96-well microtitre plates (Gozho et al., Reference Gozho, Plaizier, Krause, Kennedy and Wittenberg2005) using pyrogen-free materials (glassware heated at 180°C for 4 h) and reagents. Rumen samples were first filtered through a 0.22 µm sterile filter (Millipore corporation, Bedford, MA, USA) and heated at 100°C for 30 min. Plasma samples were treated according to Khafipour et al. (Reference Khafipour, Krause and Plaizier2009b). Frozen samples were thawed at 37°C, homogenised and diluted 1 : 10 with pyrogen-free water. The samples were then incubated at 37°C for 30 min, then at 75°C for 15 min and finally cooled down at 20°C for 45 min. Before LAL assay, a dispersing agent (Pyrosperse N188, Lonza, Walkerville, MD, USA) was added to the samples at a ratio of 1/200 (v/v). Rumen and plasma samples were then diluted until their LPS concentrations were in the range of 0.1 to 1 endotoxin unit (EU)/ml relative to the reference endotoxin (Escherichia coli O111:B4). Samples were analysed in duplicate.
Blood acute-phase proteins HP and SAA were determined in plasma samples using colourimetric (TP-801) and ELISA (TP-802) kits (Tridelta Development Ltd, Maynooth, Ireland). Samples were undiluted or diluted (1 : 1000) for HP and SAA, respectively, and were analysed in duplicate.
For histamine, LPS, HP and SAA, detection limits were 2.5 ng/ml, 0.01 EU/ml, 0.05 mg/ml and 0.3 µg/ml, respectively, with intra- and inter-assay CV⩽10%.
Statistical data analyses
Statistical analyses were performed using the PROC MIXED procedure of SAS for repeated measures. The following fixed effects were included in the model: diet (RPs v. ACs), period (P1, P2 and P3), treatment (SC v. Control), and all two-way interactions and the three-way interactions. The animal was considered as a random effect. A first-order auto-regressive covariance structure was chosen because it yielded the lowest Akaike’s information criteria. Differences were analysed using the method of least squares means with a Tukey adjustment. Values issued from days 7 and 21 during the adaptation period were averaged and used as a covariate. Effects were considered significant for P-value⩽0.05 and trends were discussed at P⩽0.1.
Statistical analysis of SSCP data was performed on R 2.6.1 using the StatFingerprints Package (Michelland et al., Reference Michelland, Combes, Monteils, Cauquil, Gidenne and Fortun-Lamothe2009). The structure of the bacterial communities was compared by calculating pair-wise Euclidean distances between SSCP profiles. To explore this distance matrix, non-metric MultiDimensional Scaling (nMDS) was performed. The nMDS produced a two-dimensional display where each SSCP profile was represented by a single plot. Analysis of similarity (ANOSIM) was also performed on the distance matrix. The ANOSIM-R value indicated the extent to which the groups or the periods differed (R>0.75: well separated; 0.50<R<0.75: separated with some overlapping; 0.25<R<0.50: separated but highly overlapping; 0.25<R: not separated). An iterative Mann–Whitney test was carried out on the 1200 scans of the SSCP profiles to identify the OTU (Operational Taxonomy Unit) assemblies that differed (P⩽0.05) between the groups or the periods. The diversity index used in this study was a Simpson’s modified index (−log Simpson), which is best adapted to complex ecosystems. Differences between groups and periods were assessed as above using SAS PROC MIXED procedure and considered different when P⩽0.05 and tended to be different when P⩽0.1.
Results
This study was designed to investigate the influence of repeated ACs on rumen fermentation, rumen microbiota and on systemic inflammatory status in sheep. The study also investigated whether live yeast supplementation modulates these parameters. Data on feeding and general behaviour of sheep from the same experiment are available in Commun et al., Reference Commun, Silberberg, Mialon, Martin and Veissier2012. During the whole experiment, none of the sheep demonstrated any visually apparent sign of illness and none was excluded from the statistical analysis (Control group, n=6; SC group, n=6).
Rumen pH kinetics
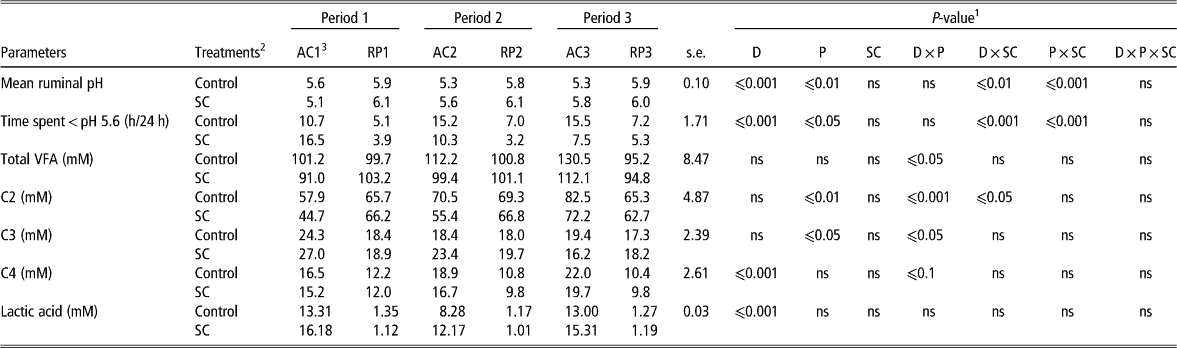
As expected, the increase of grain concentrate in the diet affected rumen pH kinetics (Supplementary Figure S2). The mean pH decreased from ∼6.0 in RPs down to 5.5 in ACs, whereas time under pH 5.6 more than doubled in ACs (Table 2). During the whole experiment, the mean pH and time spent under pH5.6 were, respectively, higher and lower in the SC-supplemented animals compared with control (D×SC effect, P⩽0.01 and P⩽0.001, respectively, for mean ruminal pH and for the time spent under pH 5.6).
Effect of repeated acidotic challenges with or without yeast supplementation on rumen fermentative parameters in sheep

VFA=volatile fatty acids; C2=acetate; C3=propionate; C4=butyrate.
1 D=diet effect; P=period effect; SC=treatment effect; ns=P>0.05.
2 Control: control group (n=6), SC: yeast supplemented group (n=6).
3 RP=resting-period diet, 80 : 20, hay : concentrate; AC=acidosis challenge diet, 40 : 60, hay : concentrate.
Control and SC wethers reacted in contrasting ways throughout the repeating periods (P×SC effect, P⩽0.001, Table 2). In the control group, mean pH decreased and the time spent under pH 5.6 increased within periods, whereas in SC-treated animals mean pH increased and the time spent under pH 5.6 decreased from period 1 to period 3.
VFA and lactic-acid concentrations
No significant overall effect of diet, period or treatment was noticed on total VFA concentrations in the rumen (Table 2). Nevertheless, although this concentration remained stable in RPs, it increased with AC repetitions (D×P effect, P⩽0.05) from 96.1 (AC1) to 105.8 (AC2) and 121.3 mM (AC3). For individual VFA, only butyrate fluctuated with concentrations increasing by 68% in ACs compared with RPs (18.2 v. 10.8 mM, D effect, P⩽0.001). During the first acidosis bout, the VFA profile was characterised by a lower content of acetate, and a high content of propionate in both groups of sheep (D×P effect, P⩽0.05). In subsequent ACs, the profile changed as acetate (P⩽0.001) and butyrate (P⩽0.1) increased at the expense of propionate (P⩽0.05). In the SC-supplemented animals, acetate concentration was lower in ACs compared with control animals (57.5 v. 70.4 mM, respectively, D×SC effect, P⩽0.05).
A marked diet effect was observed on rumen lactate concentration with average concentrations of 13 mM in ACs, more than 10-fold higher than in RPs (D effect, P⩽0.001). On the contrary, there was no effect of period or treatment on this parameter.
Microbial parameters
Ciliate protozoa
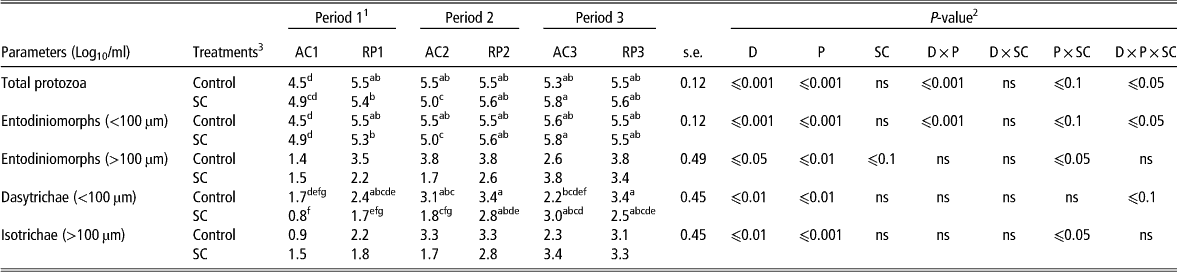
Although ACs had an adverse overall effect on total ciliate protozoal numbers, the negative influence gradually lessened over repeated ACs (D×P effect, P⩽0.001) (Table 3). On average, protozoa concentrations were 4.7 in AC1 and increased to 5.3 and 5.6 log10/ml in AC2 and AC3, respectively. Protozoal numbers in ACs did not differ anymore from those in RPs from AC2 onwards in the control group and from AC3 in the SC-supplemented animals (D×P×SC effect, P⩽0.05). The composition of the protozoal mixture was largely dominated by small entodiniomorphs, which represented more than 95% of the total. In the SC-supplemented sheep, the negative influence on large entodiniomorphs and Isotrichidae populations observed in AC1 was less marked in AC2 and disappeared in AC3. Moreover, these populations were higher in the SC group compared with the control group in AC3 (P×SC effect, P⩽0.05).
Effect of repeated acidotic challenges with or without yeast supplementation on rumen ciliate protozoa populations in sheep
1 RP=resting-period diet, 80 : 20, hay : concentrate; AC=acidosis challenge diet, 40 : 60, hay : concentrate.
2 D=diet effect; P=period effect; SC=treatment effect; ns=P>0.05.
3 Control: control group (n=6), SC: yeast supplemented group (n=6).
a–gWithin a parameter, values with different superscript letters differ when D×P×SC interaction was significant, P⩽0.05.
Bacterial groups or species
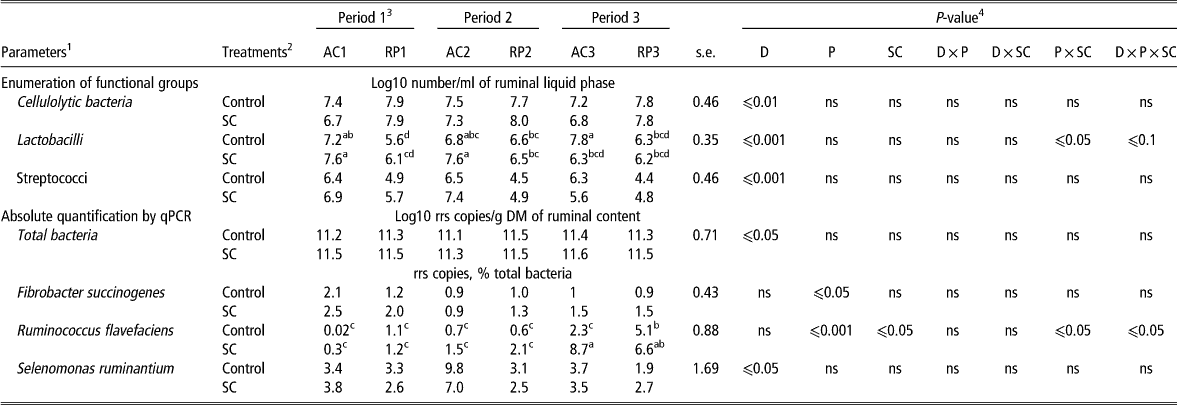
Compared with RPs, ACs had a negative effect (−0.5 to −1 log10 cell/ml) on the number of cultured cellulolytic bacteria (D effect, P⩽0.01) and stimulated Lactobacilli and Streptococci numbers (D effect, P⩽0.001) (Table 4). In the presence of SC and different from Control, Lactobacilli concentrations were not stimulated in the last challenge (AC3) compared with the previous ACs (D×P×SC effect, P⩽0.1).
Effect of repeated acidotic challenges with or without yeast supplementation on rumen bacterial populations
1 The enumeration of functional groups of bacteria was carried out on four animals from each group (n=4). The absolute quantification by qPCR was carried out on six animals from each group (n=6).
2 Control: control group (n=6), SC: yeast supplemented group (n=6).
3 RP=resting-period diet, 80 : 20, hay : concentrate; AC=acidosis challenge diet, 40 : 60, hay : concentrate.
4 D=diet effect; P=period effect; SC=treatment effect; ns=P>0.05.
a–d Within a parameter, values with different superscript letters differ when D×P×SC interaction was significant, P⩽0.05.
Total bacteria rrs gene copy numbers/g of dry matter of rumen content were close to 1011 during the whole experiment. Their concentrations were slightly but significantly lower during acidosis (D effect, P⩽0.05) (Table 4). Selenomonas ruminantium, which accounted for 1.9% to 9.8% of the total bacteria, had a higher concentration in ACs than in RPs (on average 5.2% v. 2.7% for ACs v. RPs, respectively (D effect, P⩽0.05)). Fibrobacter succinogenes proportions were rather stable throughout the experiment and accounted for 0.9% to 2.5% of total bacteria. No effect of acidosis (D effect, P>0.05) was observed, but a slight decline in F. succinogenes prevalence was noticed during periods 2 (1.0%) and 3 (1.2%) as compared with period 1 (1.9%) (P effect, P⩽0.05). In the presence of SC, R. flavefaciens proportions were higher compared with the Control group, particularly in AC3 (D×P×SC effect, P⩽0.05) (Table 4).
Bacterial community diversity assessed by CE-SSCP
The Simpson diversity index was higher in RPs than in ACs (7.0 v. 6.4, D effect, P⩽ 0.01), and was also higher in the presence of SC than in controls (7.1 v. 6.6, SC effect, P⩽0.01). This bacterial diversity was not affected by the repetition of acidosis bouts (Supplementary Figure S3). The similarity analysis showed that the bacterial community structure tended to differ between ACs and RPs for both groups (D effect, P⩽0.10). This difference was slightly higher in the SC group than in the Control group (ANOSIM-R=0.36 and 0.48 for the Control and SC groups, respectively).
Inflammation-related parameters
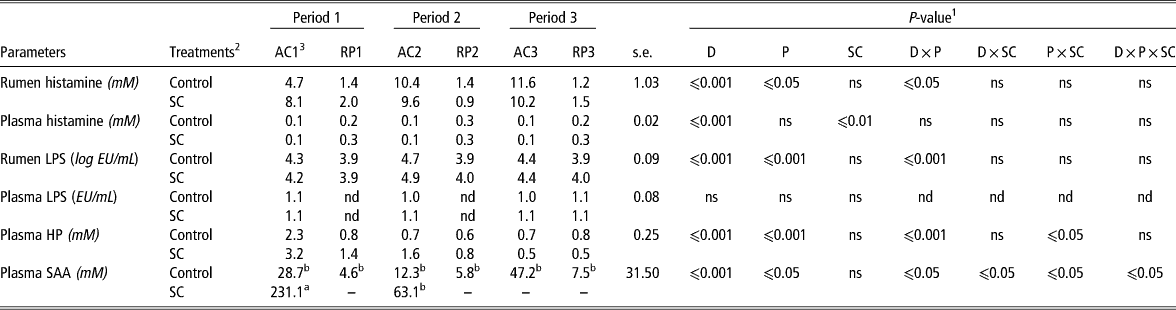
Table 5 shows the concentration of indicators of inflammation in the rumen and plasma of sheep. Rumen histamine increased in both groups with AC repetitions, whereas it remained low in RPs (D×P effect, P⩽0.05). LPS rumen concentrations were higher in ACs compared with RPs, and more particularly during AC2 (D×P effect, P⩽0.001). In plasma, histamine concentrations were lower in ACs than in RPs (D effect, P⩽0.001), regardless of the treatment. Concentrations of LPS were much lower in the plasma than in the rumen, between 1.0 and 1.2 EU/ml during ACs, without any difference between periods. HP concentrations were higher in ACs than in RPs, but this difference was particularly marked in AC1 (D×P effect, P⩽0.001). Regarding SAA concentration, this acute-phase protein was highest in AC1, decreased in AC2 for both groups, and continued to decline in AC3 but only in SC animals where SAA was even undetectable (D×P×SC effect, P⩽0.05).
Effect of repeated acidotic challenges with or without yeast supplementation on inflammatory parameters in sheep
LPS=lipopolysaccharides; HP=haptoglobin; SAA=serum amyloid A; nd=not determined; –=not detected.
1 D=diet effect; P=period effect; SC=treatment effect; ns=P>0.05.
2 Control: control group (n=6), SC: yeast-supplemented group (n=6).
3 RPs=resting-periods diets, 80 : 20, hay : concentrate; ACs=acidosis challenge diets, 40 : 60, hay : concentrate.
abValues with different letters differ significantly (only if D×P×SC interaction with P⩽0.05).
Discussion
Repeated acidosis can occur in practice through inadequate managing practices. In the present study, we monitored changes in the rumen microbiota throughout three repeated acidosis bouts to evaluate its evolution and possible adaptation. We also investigated the host inflammatory response to test whether the animals became more sensitive or more resistant to an acidosis stress. In addition, we investigated whether a live yeast additive could exert any beneficial effect during repeated acidosis. Modifications of behaviour (time budget, reactivity, feed intake) of the same sheep in response to repeated ACs have been described elsewhere (Commun et al., Reference Commun, Silberberg, Mialon, Martin and Veissier2012).
Effect of repeated acidosis
Our experimental design induced three repeated ACs in sheep interspersed by three RPs. SARA threshold definition based on pH varies largely in the literature. To define ruminal chronic acidosis in our study, we chose the cut-off point of the time spent under pH 5.6 according to several authors (Keunen et al., Reference Keunen, Plaizier, Kyriazakis, Duffield, Widowski, Lindinger and McBride2002; Commun et al., Reference Commun, Silberberg, Mialon, Martin and Veissier2012). During ACs, rumen pH decreased and the rumen microbiota and fermentation end-products (VFA, lactate) were altered, indicating that acidosis was induced as expected. During AC1, the pH dropped and the time spent below pH 5.6 was representative of a severe acidosis bout. This was associated with the decreased numbers of protozoa and cellulolytic bacteria, and the increased numbers of lactic acid bacteria. The bacterial community was affected as observed by a decline in the diversity measured by SSCP. This restructuration in the microbial ecosystem could explain the VFA profile modification in AC1, with a decrease in acetate and butyrate concentration and an increase in propionate. The drop in pH exerts a detrimental effect against ciliate protozoa, cellulolytic bacteria and promotes lactic acid–producing bacteria (Nagaraja and Titgemeyer, Reference Nagaraja and Titgemeyer2007). The accumulation of lactate led to an increase in lactic-acid utilisers as shown by the increase in S. ruminantium and a shift towards propionic acidosis. Although the changes in the microbial ecosystem during acidosis are not well known, propionic acidosis has been characterised by an increase in both lactate producing and utilising bacteria that convert lactate into propionate (Lettat et al., Reference Lettat, Noziere, Silberberg, Morgavi, Berger and Martin2010).
In AC1, we also observed a high level of rumen LPS and histamine. Owing to lysis of Gram-negative bacteria under low pH, free LPS concentration can increase in the rumen and its translocation may occur across the rumen epithelium (Emmanuel et al., Reference Emmanuel, Madsen, Churchill, Dunn and Ametaj2007). Histamine can be produced by Lactobacilli and/or Allisonella histaminiformans that have already been described to survive at low pH in the rumen of cattle (Garner et al., Reference Garner, Flint and Russell2002). In contrast, LPS and histamine did not increase in the plasma. It is possible that LPS was metabolised in the liver, or simply that plasma was not sampled at the appropriate time for detecting LPS and histamine transferred from the rumen. The high concentration of SAA and HP in plasma supports these hypotheses, as these markers of inflammation are produced in response to the presence of pro-inflammatory molecules such as LPS and/or histamine. Indeed, in a recent meta-analysis, Zebeli et al. (Reference Zebeli, Metzler-Zebeli and Ametaj2012) showed that SAA is a very appropriate biomarker for diet-induced inflammation.
Taken together, the changes observed in AC1 are in agreement with the description of SARA (Nagaraja and Titgemeyer, Reference Nagaraja and Titgemeyer2007; Plaizier et al., Reference Plaizier, Krause, Gozho and McBride2008). For the Control group, in AC2 and AC3, the rumen pH dropped as much as for AC1 and total VFA concentration increased. VFA profiles in AC2 and AC3 were oriented towards acetate and butyrate at the expense of propionate. This could be related to the recovery of protozoal numbers in these repeated ACs, as previously mentioned. The mechanism involved in this protozoa recovery is unknown though.
Given the observed changes in the physico-chemical rumen parameters (pH drop and VFA increase), a severe microbial dysbiosis was expected as already shown in animals experiencing SARA (Nagaraja and Titgemeyer, Reference Nagaraja and Titgemeyer2007; Khafipour et al., Reference Khafipour, Li, Plaizier and Krause2009c). However, following repeated ACs, there were only moderate changes in the microbial populations targeted in this study. This suggests that a gradual adaptation of the microbiota happened from one challenge to another and that low pH-resistant microorganisms could have been selected during the repeated challenges with better digestive comfort as a consequence. This is in agreement with the feeding behaviour of these sheep that had an improved feed intake and no sign of digestive discomfort as evaluated by their behaviour (less aggressiveness, agitation, and pain sensitivity) during the last two challenges (Commun et al., Reference Commun, Silberberg, Mialon, Martin and Veissier2012). In contrast, in lactating dairy cows (Dohme et al., Reference Dohme, DeVries and Beauchemin2008) and in non-productive cows (Monteils et al., Reference Monteils, Rey, Silberberg, Cauquil and Combes2012), repeated ACs increased the duration and severity of SARA. The disagreement between our results and these studies might be explained by the differences in experimental conditions. Notably, the animal species, physiological status and the nutritional conditions are important factors that must be taken into account. In Dohme et al. (Reference Dohme, DeVries and Beauchemin2008), starch levels were 8 units less (30% starch of DM) than in our study (38% starch of DM), but the cows were lactating, whereas our sheep were fed at maintenance. In Monteils et al. (Reference Monteils, Rey, Silberberg, Cauquil and Combes2012), cows were not lactating and the level of starch was the same as in our study, but the NDF (21% of DM) was 10 units less than in our experiment (31% NDF of DM). Thus, in those two studies, the risk of acidosis was greater as animals were either in production or fed with low amounts of fibre (Zebeli et al., Reference Zebeli, Metzler-Zebeli and Ametaj2012).
Throughout the repeated challenges, microbial and intake parameters indicated an improvement in animal health. However, rumen pH conditions worsened and systemic inflammation was maintained, suggesting that even if the host seemed less sensitive to dietary stress across the three challenges, chronic inflammation settled. It is worth noticing that inflammation has an energetic cost that may increase susceptibility to opportunistic infections and affect production (Zebeli and Metzler-Zebeli, Reference Zebeli and Metzler-Zebeli2012). Research on cattle have already demonstrated that, during the acute-phase response, pro-inflammatory proteins promote skeletal muscle catabolism to supply energy substrates for the immune tissues (Gifford et al., Reference Gifford, Holland, Mills, Maxwell, Farney, Terrill, Step, Richards, Robles and Krehbiel2012) that is definitely detrimental for production.
Effect of live yeast supplementation
In our study, the effect of continuous supplementation of a live yeast strain (S. cerevisiae CNCM I-1077, SC) was investigated during repeated ACs. In AC1, mean pH and time under pH 5.6 were not different in the SC-supplemented sheep as compared with the controls. We hypothesise that, during this first challenge, the yeast viability has been altered by a drastic change in the rumen conditions. In this study, enumeration of viable yeasts was not performed during challenges but during the covariate period (before challenges), to check that the expected counts were found in the rumen of supplemented sheep. Therefore, more research would be needed to confirm this hypothesis.
As discussed above for the control group, a progressive adaptation of the selected microbes monitored in this study seems to take place in repeated challenges AC2 and AC3. Further studies using more comprehensive microbial methods will be necessary to check whether this observation is also valid for the whole microbiome. Within this modified microbial community, live yeast was more effective at modulating mean pH and time under pH 5.6. We hypothesise that yeast viability was also better. SSCP analysis suggests that SC increased bacterial diversity, whereas in Control sheep diversity deteriorated with acidosis repetitions. A significant decrease in Lactobacilli and a concomitant increase in the fibrolytic bacterium R. flavefaciens were observed in AC3. These microbial changes reflect an improved rumen environment and confirm the positive role of SC on R. flavefaciens under SARA conditions (Mosoni et al., Reference Mosoni, Chaucheyras-Durand, Bera-Maillet and Forano2007). In the SC-supplemented sheep, an increase in ciliate protozoa counts (total and specific groups) was observed along with AC repetitions. This result confirmed previous data obtained in the rumen-fistulated sheep fed a wheat-rich diet and the same yeast (Brossard et al., Reference Brossard, Chaucheyras-Durand, Michalet-Doreau and Martin2006). As protozoa are able to engulf and slowly digest starch in their vacuoles, they are considered to play a positive role, limiting acidosis severity (Brossard et al., Reference Brossard, Martin, Chaucheyras-Durand and Michalet-Doreau2004).
The concentrations of plasma HP and SAA had a different evolution in the two groups of sheep. In the SC-supplemented sheep, there was a consistent decrease in the concentrations of these proteins in successive ACs, SAA was not even detectable after RP2. These data suggest that inflammation was attenuated in repeated ACs and it was not different from RPs, suggesting a better recovery and a greater resistance of live yeast-supplemented sheep.
Regardless of the treatment, during the whole experiment and after each challenge, RPs were characterised by a good resilience capacity of the rumen as most physico-chemical and microbial parameters returned to baseline values and were stable. As rumen contents were collected at day 21 of RPs, we could not evaluate the time required to return to these ‘normal’ parameters after the challenge. However, pH kinetics suggests that it might take 3 to 7 days following ACs. Li et al. (Reference Li, Wu, Baldwin, Li and Li2012) showed that after a 72 h-butyrate infusion, animals recovered a pre-disturbed microbial pattern in 7 days. However, specially designed studies would be necessary to better know the resilience capacity of the rumen after acidosis.
Acknowledgements
The authors are grateful to Aurélie Ameilbonne, Lucette Genestoux and to the animal experimental unit (UERT) for skilled technical assistance and animal care.