


1. Introduction
This paper examines the factors controlling ablation on Canada Glacier, as representative of both valley glaciers in the McMurdo Dry Valleys, Antarctica, and blue-ice areas of Antarctica in general. This is of particular interest because, though Antarctic blue-ice areas make up only a small part of the Antarctic continent, they are one of the few areas on the continent where ablation exceeds accumulation (Reference BintanjaBintanja, 1995). If we wish to understand what conditions lead to negative mass balance in Antarctica, we need a better understanding of the processes governing the existence of blue-ice areas such as the ablation zones of Dry Valley glaciers. This study is undertaken as part of the McMurdo Dry Valleys long-term ecological research (ITER) project.
The only significant source of water to the ecosystems of the ephemeral streams and ice-covered lakes is Glaciol meltwater. As we measure glacier mass balance in the ablation zone for the purpose of assessing the magnitude of melt-water production, ablation must be apportioned into evaporation and melt. The McMurdo Dry Valleys are a good site for this work for a number of reasons: as for most of Antarctica, the Dry Valleys region is a polar desert in which sublimation is relatively large (Reference KeysKeys, 1980), so energy-balance results from this region will be applicable to many regions in Antarctica; the valleys are closed hydrologie systems, which simplifies water-balance calculations; and the water balance in the valleys is sensitive to small changes in climate (Reference Wharton, McKay, Clow, Andersen, Simmons and LoveWharton and others, 1992), making the valleys a good place to look for early indications of climate change. in addition, this paper compares and contrasts melt on the sub-horizontal glacier surface with that on the terminus cliff faces. Cliff melt is an order of magnitude greater than surface melt (Fountain and others, in press), highlighting the necessity of incorporating terminus-cliff mass balance into glacier mass balance as a whole in these regions.
2. Study Site and Measurements
The McMurdo Dry Valleys ITER is located in Taylor Valley, McMurdo Dry Valleys, the largest ice-free region on the Antarctic continent, which lies along the western edge of the Ross Sea. Taylor Valley (77°00'S, 162°52' E) is approximately 400 km2 in area, running roughly east west, bounded on the north by the Asgard Range and on the south by the Kukri Hills (Fig. 1). The valley is a mosaic of perennially ice-covered lakes, ephemeral streams, bare, rocky ground, permafrost and glaciers. Approximately 35% of Taylor Valley is covered by glaciers. These are mostly small alpine glaciers that flow out of the bordering mountain ranges, but Taylor Glacier is an outlet glacier from the East Antarctic ice sheet. All the alpine glaciers in the valley are frozen to their beds. Consequently, all meltwater runoff is restricted to the glacier surfaces, and englaciol/subglaciol hydraulic systems are absent.
Mean annual precipitation in the Dry Valleys is about 0.5 em w.e. on the valley floors, and mean annual temperature is near -17°C (Keys, 1980). These combine to form a very dry environment where sublimation and evaporation play a large role in ablation from the glaciers (Reference Bull and C. R.Bull and Carncin, 1970). Melt is observed in mid-summer on the glacier, with small meltwater streams running over the glacier surface and cascading off the terminus cliffs. Melt on the vertical cliffs is evident weeks before melt is observed on the sub-horizontal surfaces of the glacier. Melting on the cliff has been noted when air temperatures are well below freezing (Reference ChimiChimi, 1987; Fountain and others, in press).
Base map and location of glaciers in Taylor Valley, Antarctica.
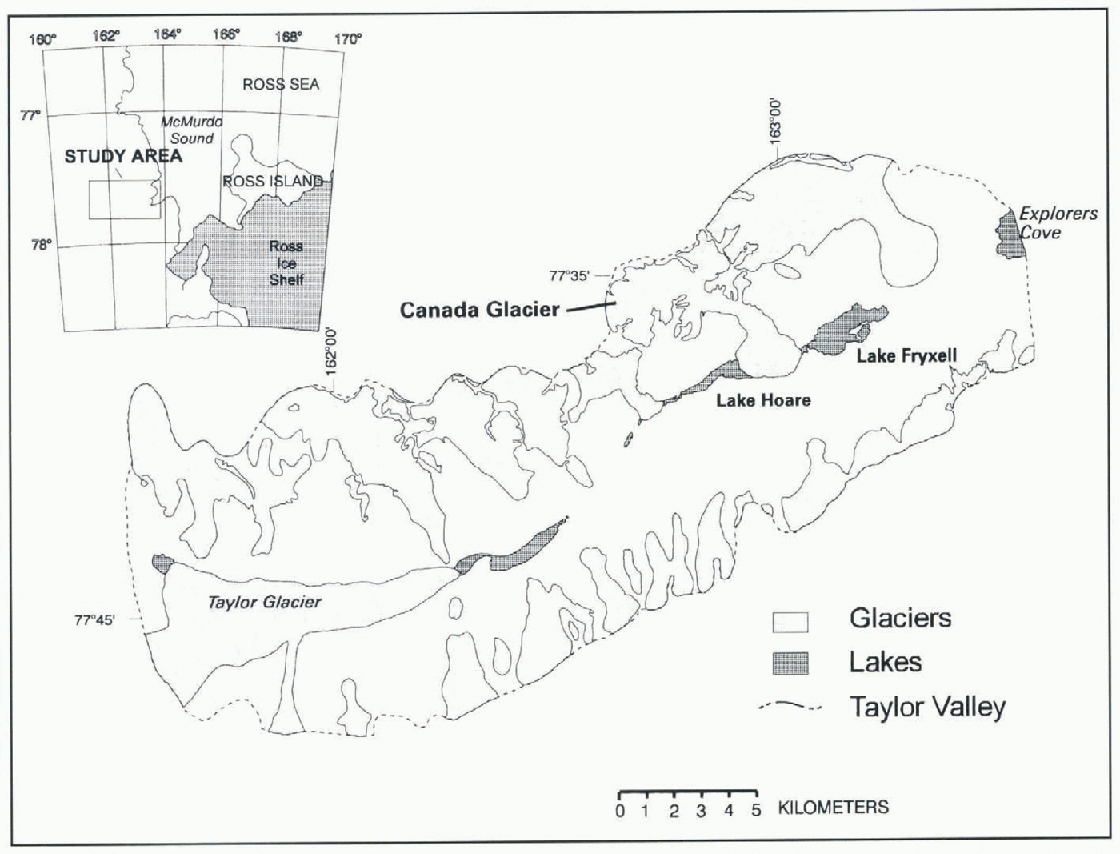
Our study site is on Canada Glacier which Hows from the Asgard Range about midway down Taylor Valley, approximately 15 km from the coast of McMurdo Sound. Canada Glacier is a 34 km2, classical piedmont glacier with a south-facing lobe of roughly 8.5 km2 sloping at an angle of 3°. The ablation zone ranges in altitude from 100 to 350 m. Drainage to the west is by Andersen Creek which (lows into Lake Hoare, and to the east by Canada Stream which flows into Lake Fryxell (Fig. 2).
Canada Glacier was chosen for this study for a number of reasons: it is one of the larger glaciers in the valley; its meltwater drains to streams gauged near the glacier margin, so evaporative losses from the stream are minimized; and the glacier is easily accessible from a nearby camp, making frequent trips feasible. Ablation stake measurements on Canada Glacier provide the basis for calculating meltwater and runoff from the glacier. The ablation stake network consists of 18 stakes in the ablation zone on the glacier surface, and an additional 11 locations along the terminus cliff. Both surface and cliff stakes are placed to provide a representative sampling of the ice surface in the ablation zone (Fig. 2). The ablation stake network is measured twice a year, spring and fall, to quantify summer and winter ablation; if time permits, the stakes are also measured in mid-summer. Ablation stake measurements are converted to water-equivalent loss based on an estimated ice density of 900 kg m−3 (snow, when present, is converted to water equivalent using measured density and layer thickness).
Lower Canada Glacier, showing meteorologie stations, ablation stake locations and stream gauges. The surface meteorologie station is located about 20 m from the neighbouring stake. The approximate location of the glacier equilibrium line and the Andersen Creek and Canada Stream drainage area boundaries are also indicated.
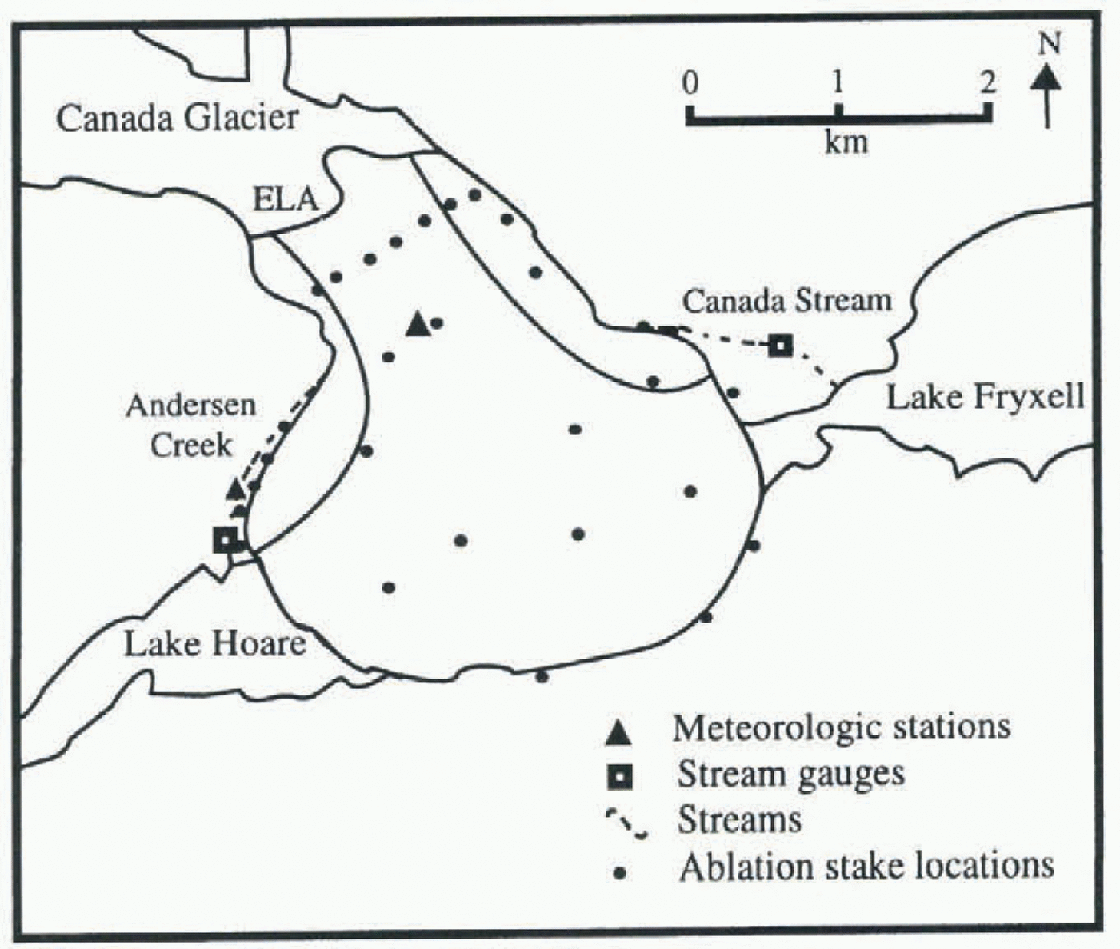
Surface energy-balance calculations, based on meleoro-logic measurements, provide information on the local sublimation rates and allow us to estimate melt from ablation stake data. These meteorologie measurements are made from a permanent meteorologie station located on the center line of the glacier (Fig. 2), approximately 100 m below the equilibrium line. The station records air temperature and humidity (Campbell 207 probe), wind speed and direction RM Young wind set), incoming and outgoing shortwave radiation (LICOR silicon pyranometers), net radiation (REBS net radiometer) and turbulent heat fluxes (Campbell two-dimensional eddy correlation instruments), all at about 2 m height above the ice surface, and ice temperature at the surface (Everest IRT) and 0.5 m depth (Campbell 107 probe). Most of the instruments are sampled every 2 seconds and all data are stored as 20 min (1994-95) or 15 min (1995-96) averages. Data were collected during the summer of 1994-95 from 21 December to 21 January, and the summer of 1995-96 from 22 November to 10 January, and encompass the bulk of the melt season for each year. in addition, during the summer of 1995-96 a “roving” meteorologie station, using the same instrumentation as the fixed station, was run at selected locations on Canada Glacier over 1-5 day intervals. These data are used to extrapolate from point-source measurements to the entire ablation zone.
To assess the contribution of the vertical terminus cliffs to melt,a meteorological station was set up from 10 December to 22 January 1995-96, facing the terminus of Canada Glacier (Fig. 2). This station was located on a 2 m high ice apron, about 1.3 m from the cliff. The cliff at this point was vertical, roughly 20 m high and facing west-northwest. The station recorded air tempcraturc,rclativc humidity and incoming and outgoing shortwave radiation, using the same instrumentation as the surface station. The pyranometers were mounted facing horizontally into and away from the cliff, instead of vertically, to assess the shortwave radiation incident on the cliff face. All instruments were sampled every 10 seconds and the data stored as 15 min averages.
Melt from areas oflhe surface and terminus which drain to Andersen Creek and Canada Stream was compared with measured stream-flow in the streams. Both streams were gauged using 9 in (23 cm) Parshall flumes installed in the stream-bed to record low-flow measurements, with weirs built into the cut-off wall for high-flow measurements. Stream stage was measured at 15 min intervals throughout the summer season by a pressure sensor system connected to a data logger, and converted to stream discharge using annually derived rating curves (Von Guerard and others, 1995).
3. Surface Energy Balance
The surface energy-balance equation is expressed as:

where R,net is net radiation, G is heat flux through the ice/air interface, H is sensible-heat flux to the air, LE is latent-heat flux to the air, and M is energy used to melt the ice surface. All of these terms are measured in wm−2 and are positive for fluxes toward the surface, negative for fluxes away from the surface. Rnet is measured directly, G,H and LE are calculated from measured data as described below and M is calculated as a residual. For this study, any heat transferred in precipitation is assumed to be zero, since precipitation in this region is minimal and falls as snow.
Assuming horizontal homogeneity, the ice-heat flux, G, can be calculated from the heat conduction equation:
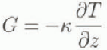
where k is the thermal conductivity of ice (2.0 wm −1Κ−1) and  is the temperature gradient calculated from ice thermistor measurements. For this calculation, temperatures measured at the ice surface and at 0.5 m depth were used. Direct shortwave heating of the ice is indirectly measured by the temperature change, and is consequently not treated separately.
In the atmospheric surface sub-layer, heat and moisture are transported primarily through turbulent motion. This transport gives rise to two forms of energy flux between the air and the glacier surface: sensible-heat flux, H, the direct transport of heat energy; and latent-heat flux, LE, the transport of heat through the phase change of water. These fluxes are calculated using the Monin Obukhov similarity theory (Reference BrutsaertBrutsaert, 1984), and the accuracy of the calculation ascertained through comparison with the eddy correlation meas-urements. Eddy correlation measurements were not used directly, because they were available only for select 3-8 day intervals throughout the 1994 95 and 1995 96 summers.
The Monin Obukhov similarity theory is based on the following equations:
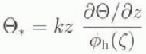
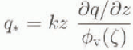

where θ*, q* and it, are characteristic scales of temperature, humidity and wind speed, respectively, k is the von Karman constant (k = 0.4), and U is horizontal wind speed. The φ functions are defined below, z is a non-dimensional length scale, equal to z/L, which is characteristic of the turbulence with in the surface sub-layer, z is the height above the surface at which the wind, temperature and humidity are measured. L, the Obukhov stability length, incorporates both buoyancy effects and the shear stress at the surface:
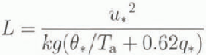
where g is the acceleration due to gravity and Τa is the air temperature (Brutsaert, 1984). L is positive for stable, negative for unstable, and infinitely large for neutral atmo-spheres.
The φ functions in Equations (3)-(5) are stability correction functions which account for changes in turbulence due to different atmospheric stabilities. in unstable conditions we have used the expressions of Reference Miyake and McBeanMiyake and McBean (1970) and Reference Paulson, Leaviti and FleaglePaulson and others (1972); for stable conditions we have used those given by Brutsaert (1984).
In the surface sub-layer, it is generally assumed that the temperature, humidity and momentum fluxes are constant with height, which implies that the characteristic scales  , q*
and u
* will be independent of z. Therefore, Equations (3)-(5) are solved by integrating over two heights; in this case the surface and instrument heights at 1.95 m (air temperature and relative humidity) and 2.65 m (wind speed). The effective heights associated with the surface values of wind speed, temperature and relative humidity are zom, zoh
and zov, the surface roughness parameters. These parameters are the y intercepts where the logarithmic wind speed, temperature and humidity profiles reach their ctlcctive surface values. For this work we assume that zom = zoh= zov, a good assumption over smooth ice (Brutsaert, 1984; Reference MorrisMorris, 1989; Bintanja and Van den Broeke, 1995). Surface values of ice temperature are measured directly, surface relative humidity is assumed to be 100% with respect to ice, and surface wind speed is zero. Based on these assumptions, an iterative approach is used to solve for u
*,
 and q*, which are then used to solve the equations for sensible (H) and latent (LE) heat:


The results calculated at the meteorologie station at the fixed location on the glacier surface are assumed to be representative of the glacier ablation zone surface as a whole, based on a comparison between the fixed station and the roving station which was run at a number of different locations on the glacier surface. Comparison of wind speed and direction, relative humidity, incoming shortwave radiation, sensible- and latent-heat fluxes, and albedo across the sub-horizontal part of the ablation zone shows no systematic offset, and consequently is assumed to be constant for this study. Temperature varies as the dry adiabatic lapse rate, and pressure varies hydrostatically (Lewis, 1996).
3.1. Surface energy-balance results
Average summer values for each of the surface energy-balance components are given in Table 1. It is immediately apparent that net radiation is the dominant energy source, and latent heat and melt are the dominant energy sinks. It is also clear that latent heat is the only component of the energy balance that is relatively constant between the two years.
The mean daily cycle of Canada Glacier energy-balance components for the period 1 December 1995-10 January 1996. Fluxes toward the surface are positive.

Energy-balance components measured at the glacier surface and terminus cliff meteorologie stations. Shown are: average summer valuesfor each of the energy-balance components (Wm−2); the equivalent ice ablation (cm w.e.) due to latent heat, A1e, and water-equivalent melt, Am, over the duration of the summer 1995-96 ablation stake measurements; the water-equivalent ablation measured at slake next to the surface meteorologie station (for the surface measurements); and the average water-equivalent ablation measured at the terminus stakes along Andersen Creek (for the terminus measurements)
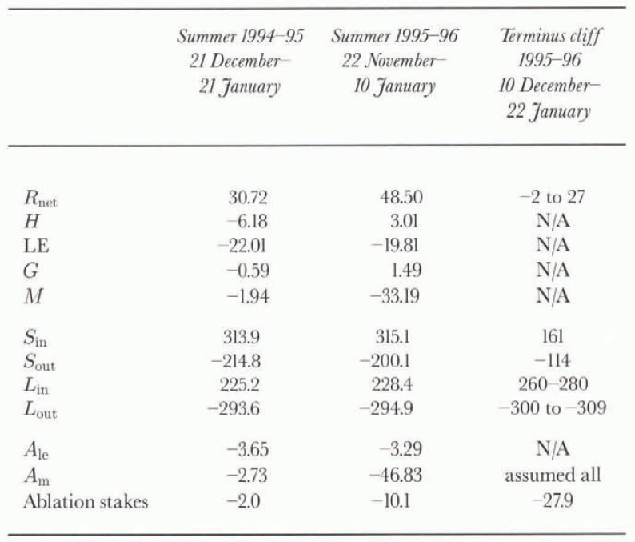
Net radiation varies significantly between the two years, apparently primarily due to albedo variations. Mean albedo was 0.68 during the 1994-95 summer, and 0.64 during the 1995-96 summer. A few light snowfalls occurred during both summers. It is likely that this snow cover lasted longer during 1994 95 as a result of lower air temperatures, resulting in a higher albedo for the 1994—95 summer. Sensible-heat flux and ice-heal flux are both small, and change sign between years.This has two dominant causes: the time-spans studied and intcrannual climate variation. The time-span studied in 1994-95 encompasses the latter part of the summer during which the ice is predominantly cooling; in 1995-96 the time-span studied encompasses early and mid-season, during which the ice is warming. However, 1994-95 was also cooler overall than 1995-96 (mean air temperature at Lake Hoare was -4.1 °C for the 1994-95 summer and -1.8°C for the 1995 96 summer), which accounts for much of the difference in sensible-heat fluxes between the two summers.
The mean daily variation in each of these energy-balance components is large (Fig. 3). Net radiation peaks at near 150 wm −2 at 1430 h (local solar noon is approximately 1400 h) and drops to a minimum of approximately -20 wm−2 at 2000 h. This is the driving force for the latent-, sensible- and ice-heat fluxes, which show similar diurnal cycles. Latent heat varies from -10 to -35 wm−2, with the greatest flux at solar noon when the air temperature is greatest and therefore can drive the greatest vapor exchange. Sensible heat is positive at this time, and ice-heat flux negative, implying the ice is warming. During the night, both sensible- and ice-heat flux change sign as a result of cooling air temperatures over a relatively constant ice temperature, and latent heat is at its minimum.
Error terms for meteorologie measurements based on manufacturers quoted instrument accuracy and the corresponding water-equivalent melt as a result of the given energy flux
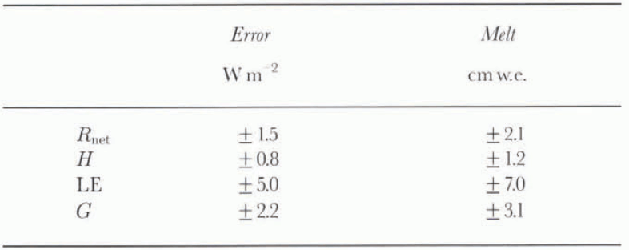
The energy available for melt is calculated as a residual of the other four energy-balance terms and varies by more than an order of magnitude between seasons (table 1). This highlights the difficulties inherent in working with seasonal averages in an area where average fluxes are small. Although the diurnal variation in linxes is large, the daily mean flux is small, and as a result the measurement error is a significant percentage of the mean daily flux (table 2). If the potential error in any given component of the energy balance is considered in terms of melt, it quickly becomes clear that calculating melt as a residual is inaccurate; the potential error in the energy-balance terms ranges from 1 to 7 cm w.e. melt, while the mean measured summer surface ablation on Canada Glacier during 1995-96 was 7.75 cm w.e.
Since the melt calculations have the potential for such large error, calculations of melt for use in the water balance are made by subtracting the calculated sublimation from the ablation stake measurements. However, it is worth noting that the melt calculations predici the general trend of melt over the two seasons, though they are not accurate enough to quantitatively assess melt. The 1994-95 summer was quite cold, with little or no visible melt, and sublimation was the dominant source of ablation, whereas during the 1995-96 summer, ablation due to melt exceeded ablation due to sublimation. On warm days during the 1995-96 summer, the ice surface was noticeably wet, with small si reams flowing near the glacier margins and waterfalls cascading ox er the terminus cliffs.
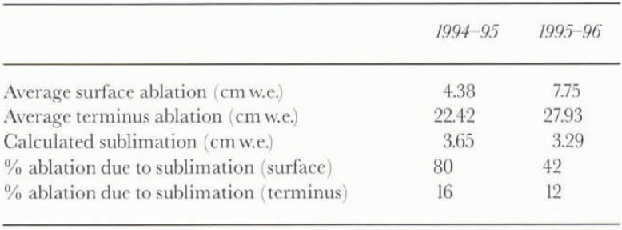
The average measured surface and terminus ablation, the total calculated sublimation for the glacier surface, and the percentage of ablation due to sublimation for the glacier surface are shown in Table 3. in addition, percentage ablation due to sublimation for the terminus cliff is shown, based on the value of sublimation calculated for the glacier surface. Since the cliffs are sheltered from the dominant val-lev winds along much of their length, this latter calculation should give an upper bound for loss due to sublimation for the terminus cliffs. On the glacier surface, sublimation accounted for 80% of the measured ablation during the 1994-95 summer, and 42% during the 1995 96 summer. This difference is primarily due to the lower albedo and greater radiation energy available during the 1995-96 summer. The terminus cliff calculations show significantly lower rates of loss due to sublimation, 16% for 1994 95 and 12% for 1995-96, and these values are upper bounds.
Average measured surface and terminus ablation, calculated sublimation for the glacier surface, and percentage ablation based on calculated sublimation rates
4. Terminus Energy Balance
Unlike on the glacier surface, the meteorologie measurements made at the terminus meteorologie station are insufficient to solve the full energy-balance equation for the cliff ice. We lack the longwave radiation data required to calculate net radiation; icc-tcmpcraturc data to solve for ice-heat flux; and wind and temperature measurements to solve for latent (LE) and sensible heat H. We attempt to partition the ablation stake measurements into sublimation and melt by making a number of assumptions: first, that the cliff is at the melting point, which implies that the ice-heat flux is approximately zero and the outgoing longwave radiation can be calculated using the Stefan-Boltzmann equation and a temperature of 273.15 K; second, that the latent heat is negative; third, that the incoming longwave radiation can be estimated from soil temperatures measured at the Lake Fryxcll shore, and incoming longwave radiation measured on Commonwealth Glacier (Fig. 1).
The first assumption can be justified by noting that cliff melt occurs daily when the cliffs are in direct sunlight, making it unlikely that ice temperature drops significantly below freezing during the period of study. Small variations in the cliffsurface temperature will have only a small effect on the overall energy-balance results. Error bars for outgoing longwave radiation are estimated as the difference between the longwave radiation calculated using a temperature of 0°C for the entire period and the radiation calculated using the air temperature for periods when the air is below freezing and O C when the air is above freezing. The second assumption, that latent heat is negative, is valid since the dry air in the valley will provide little moisture for condensation, making it unlikely that latent heat could be a significant energy source. The magnitude of the latent-energy sink on the terminus cliffs is unlikely to be greater than on the glacier surface, as discussed above. The third assumption, that longwave radiation incident on the cliff face can be estimated from measured soil temperatures and incoming atmospheric longwave radiation, is an approximation. We have estimated the error resulting from these assumptions based on a variation in soil temperature of ±2°C (the average difference in soil temperatures between meteorologie stations) and a variation in incoming atmospheric longwave radiation of ±15 wm (the average dilference between the incoming longwave radiation measured on Commonwealth Glacier and incoming longwave radiation calculated for Canada Glacier).
Incoming longwave radiation is calculated by considering the “view” seen by the terminus cliff. The cliff is assumed to be infinitely long, facing infinitely long horizontal bands of snow, rock and sky. Longwave absorption by the atmosphere is negligible over the distances concerned, a fair assumption for this region. Longwave radiation incident on the terminus cliff (Lm ) is calculated as a function of the angular coverage (Θ) of rock, snow and sky seen by the cliff, using the following equation:

where  , the cmissivity of snow in the longwave, is 0.90 for old snow (Steffen, 1985), Troek is measured soil temperature on the Lake Fryxell shore, and L-in,meas
is incoming atmospheric longwave radiation measured on Commonwealth Glacier. The angular coverage of snow, rock and sky are taken from maps and photographs. A 90° view angle is used because this equation assumes that all surfaces facing the cliff are radiating diffusely. Consequently, surfaces perpendicular to the cliff will contribute virtually no radiation. We have assumed that soil temperature is constant with altitude, and the soil cmissivity,
 0.92, an estimate based on the range of emissiv-ilies for dry, sandy soils of 0.90-0.95 (Steffen, 1985).
4.1. Terminus energy-balance results
On the surface, net radiation is an energy source of 30-50 wm −2, but on the cliff it is smaller, ranging from 0 to 30 wm−2. This is primarily due to smaller net shortwave energy receipt: both components of the shortwave radiation are roughly a factor of two smaller on the terminus than on the glacier surface, resulting in an average net positive energy flux of 50W m on the terminus compared with 100 wm−2 on the surface. Some of this difference is compensated for by longwave radiation. Incoming and outgoing longwave radiation fluxes for the terminus cliff are larger than those cither measured or calculated for the surface. in particular, incoming longwave radiation is significantly higher, probably as a result of large longwave energy emission from the bare rock bordering the cliffs. As a result, I lie average net longwave radiation on the terminus is an energy sink of 20-50 wm−2, while on the surface it is an energy sink of60-70Wm −2 (table 1).
Assuming the average terminus ablation measured at the stakes (22.4 and 27.9 cm w.e., respectively, for the two summers studied) is caused by melt alone, the average energy fluxes needed over the course of the summers to account for the loss are 12.1 and 15.1 wm−2, respectively. These values are well within our estimates of net radiation available for melt on the cliff face. However, this leaves little extra energy for sublimation. If part of the measured ablation on the cliffs is due to sublimat ion, the energy required to account for the loss will go up substantially. This could potentially be provided via sensible heat.
Given the data currently available for the terminus cliff it appears that the dominant energy source is shortwave radiation, and virtually all the energy thus gained goes to melt. For meltwater calculations made in the next section, we have assumed all terminus cliff ablation is due to melt.
5. Melt and Discharge
Meltwater calculations are based on those parts of the glacier draining into Canada Stream and Andersen Creek. Since these streams are gauged, we can verify our calculations for these regions. Meltwater runoff for the rest of the glacier (approximately 85% of the total ablation zone and 85-90% of the melt) cannot currently be verified as it drains into ungauged streams or directly into one of the two lakes. Meltwater calculations are made by identifying the surface and terminus cliff-face drainage areas for Andersen Creek and Canada Stream (Fig. 2), calculating melt tor each of these areas based on ablation stake and sublimation data, and multiplying the estimated melt by the total runoff area. The effects of both the melting of snowdrifts from the ground adjacent to the ice cliff, which would result in higher gauged flow than calculated flow, and meltwater capture and refreeze on the glacier, which would result in lower gauged flow than calculated flow, are not considered. The latter, in particular, may be quite significant.
Surface meltwater results for the Andersen Creek and Canada Stream drainages are shown in Table 4. Error bars for the surface and terminus melt are a function of the accuracy of the stake measurements (±0.37 em w.e., based on the standard deviation of repeat measurements) and the accuracy of the sublimation calculations (±5W m−2, which is 0.83 cm w.e. sublimation). Calculated discharge compares quite well with measured stream discharge. For Andersen Creek, the 1994-95 combined terminus and surface melt overestimates creek discharge by 17%. The 1995-96 results underestimate discharge by 22%. For Canada Stream, the sum ofsurface and terminus melt underestimates discharge for both years, by 51 % in 1994-95 and 44% in 1995-96.
The error due to ablation stake measurement and sublimation calculation alone cannot account for the difference between calculated and measured discharge. Estimates that are consistently too low l>y a factor of two for Canada LSlream probably indicate that the run of Tarca for the stream has been underestimated. The drainage areas are based on contour lines and ilowlines taken from a 1:50 000 scale map. Clearly, significant improvement could be made on this through either the use of aerial photographs or more accurate surveying arid mapping, which would no doubt affect the final results. in addition, the sections of the glacier surface that contribute to Canada Stream tend to accumulate more drifted snow than other areas of the glacier. This snow may act as a sponge for meltwater, reducing the flow off the glacier.
For Andersen Creek, since estimated flows do not systematically differ from the measured flows, our drainage area calculations are probably good; the 20% offset is most likely a function of measurement errors, particularly the accuracy of the measured discharge, estimate of loss via sublimation for the terminus cliff, meltwater capture on the glacier, and snowdrift melt along the stream channel.
Given the current measurement program, the seasonal Andersen Creek discharge can be estimated to within 20%. It is likely that, with a more accurate division of the surface into runoff zones, both Canada Stream discharge and glacier discharge as a whole could be estimated more accurately. Having these estimates and knowing that they are accurate to within 20% will allow us to begin to look at total glacier melt and flow that melt affects Dry Valley lake levels.
6. Conclusion
The work presented here highlights the difficulty in using surface energy-balance measurements to calculate melt for polar glaciers. in this environment, individual energy-balance terms exhibit large diurnal variations, but daily mean values are small, frequently less than an order ofrnag-nitude larger than the errors associated with the measurements themselves. When calculated as a residual, the accuracy of the melt term is ± 5.7 wm 2. This is the equivalent of ± 7.9 cm w.e. melt if that energy were applied over the entire summer season. in an environment where annual ablation averages 10 cm w.e. or less, errors of this magnitude clearly bring into question melt measurements from energy-balance residuals. However, melt can be calculated as the residual of the ablation stake measurements less sublimation.
One of our primary findings is identifying the role of sublimation on both the glacier surface and terminus cliffs. Sublimation, which was quite constant for the two summers studied, accounted for 80% of the surface ablation during the 1994 95 summer, and 42% of the surface ablation during the 1995—96 summer. in contrast, we estimate that sublimation is very small on the terminus cliffs, accounting for less than 15% of the measured ablation, with the remaining incoming energy on the cliffs used for melt.
In spite of the different partitioning of energy on the glacier surface and terminus cliffs, the dominant energy source for both the suface and terminus is shortwave radiation. On the surface, and possibly on the terminus cliffs as well, sensible heat is a small contributor in some years. Measurement of the energy fluxes at the terminus with a more complete suite of instrumentation should verify these results.
Based on these results, we were able to calculate summer discharge for Andersen Creek to within 20%. We also identified that the terminus cliffs accounted for 40% of the measured discharge in 1994-95, and 15% of the measured discharge in 1995-96. This clearly shows that the terminus cliff must be considered in glacier meltwater calculations.
Acknowledgements
This research was supported by the U.S. National Science Foundation Office of Polar Programs grant OPP-9211773. The authors would like to thank H. House and P. Langevin for help with data collection, P. Doran for meteorologie support and advice, and S. Tyler for loan of instrumentation.



