INTRODUCTION
In most wheat-producing countries including Argentina, increasing grain yields is, and will continue to be, one of the main goals of wheat breeding programmes. Genetic progress in wheat grain yield over the last 30–40 years has been attributed largely to an increase in grain number/m2 (Fischer Reference Fischer2007). According to Fischer (Reference Fischer, Smith and Banta1984), under non-limiting environmental conditions, wheat grain number/m2 can be considered as the product of the duration of the spike growth phase (SGP), crop growth rate during SGP, dry matter partitioning to spikes during SGP and the number of grains per unit of spike dry weight, i.e. an indicator of spike fertility (SF). Yield increases accomplished in the 1970s were mainly due to greater dry matter partitioning to spikes, as a consequence of the introgression of dwarfing genes (Austin et al. Reference Austin, Bingham, Blackwell, Evans, Ford, Morgan and Taylor1980; Fischer & Stockman Reference Fischer and Stockman1986; Brooking & Kirby Reference Brooking and Kirby1981; Slafer et al. Reference Slafer, Andrade and Satorre1990; Youssefian et al. Reference Youssefian, Kirby and Gale1992; Reynolds et al. Reference Reynolds, Rajaram and Sayre1999). Manipulation of the length of SGP and crop growth rate during SGP has been attempted from a breeding standpoint, with variable results (see Slafer Reference Slafer, Buck, Nisi and Salomón2007; Fischer Reference Fischer2007). In contrast, SF has only been investigated with an ecophysiological approach (Abbate et al. Reference Abbate, Andrade and Culot1995, Reference Abbate, Andrade, Culot and Bindraban1997b, Reference Abbate, Andrade, Lázaro, Bariffi, Berardocco, Inza and Marturano1998; Abbate & Lázaro Reference Abbate and Lázaro2001; González et al. Reference González, Slafer and Miralles2005; Lázaro et al. Reference Lázaro, Abbate, Cogliati and Andrade2010, Reference Lázaro and Abbate2011; among others) but not used, at least intentionally, as a selectable trait in a yield breeding programme.
The information available strongly suggests that SF would be an attractive trait to screen and select for in a yield breeding programme. For instance, data from Stapper & Fischer (Reference Stapper and Fischer1990) revealed differences in number of grains/g spike dry weight at maturity among Australian wheat cultivars, which were associated with grain number/m2. Abbate et al. (Reference Abbate, Andrade, Lázaro, Bariffi, Berardocco, Inza and Marturano1998) reported that differences in SF explained most of the differences in grain yield among Argentine wheat cultivars across a wide range of yield variation. Shearman et al. (Reference Shearman, Sylvester-Bradley, Scott and Foulkes2005) also detected large differences in SF among British cultivars, whereas Acreche et al. (Reference Acreche, Briceño-Félix, Sánchez and Slafer2008) concluded that genetic gain in wheat grain yield in Spain could be largely ascribed to an increase in SF (which they termed ‘fruit efficiency’). Moreover, Abbate et al. (Reference Abbate, López, Brach, Gutheim, Gonzalez, Kruk and Serrago2007) observed that the ranking order in the SF of a group of Argentine cultivars was maintained across several environments, even under sub-potential environmental conditions, and Lázaro & Abbate (Reference Lázaro and Abbate2011) found that variations of grain number among cultivars in response to the photothermal quotient were greatly associated with their SF. Recently, Fischer (Reference Fischer2011), Foulkes et al. (Reference Foulkes, Slafer, Davies, Berry, Sylvester-Bradley, Martre, Calderini, Griffiths and Reynolds2011) and González et al. (Reference González, Terrile and Falcón2011) discussed the idea of focusing on SF as one of the avenues for increasing yield potential.
The methodology typically used for field determining SF (Abbate et al. Reference Abbate, Lázaro, Andrade, Kohli and Martino1997a, Reference Abbate, Andrade, Culot and Bindrabanb) involves three steps. First, a crop sample of 0·5–1 m2 is drawn near the beginning of grain filling (c. 7 days after anthesis) for determining the spike dry weight per unit area, after discounting the weight of the developing grains (detached from the spikes with forceps). Then, a crop sample of similar size is drawn at maturity for determining the grain number per unit area. Finally, SF is calculated as the quotient between the grain number and the non-grain spike weight (hereafter called spike chaff dry weight). According to the present authors’ experience, a person can hardly collect and process more than 15 crop samples per day, or detach grain from spikes in more than 15 samples per day. This means the procedure is slow, tedious and expensive, and hence not useful for screening a large number of treatments. Therefore, the feasibility of using wheat SF as a selection criterion in a breeding programme or as a variable of interest in crop physiology studies depends largely upon the availability of a simpler and faster method for collecting and processing samples. This would allow screening of a large number of individuals, families and/or other treatments (e.g. nutrient levels) simultaneously. The objective of the present study was to determine: (1) the correlation between SF calculated with the spike chaff dry weight at anthesis (as proposed by Abbate et al. Reference Abbate, Andrade, Culot and Bindraban1997b) and at crop maturity, (2) the correlation between SF evaluated at the plot level (i.e. both spike chaff dry weight and grain number determined as per area unit) and at the individual spike level (i.e. in a small sample of spikes) and (3) the minimum number of individual spikes that should be sampled for the development of a screening method that can be applied in wheat breeding programmes or in crop physiology studies.
MATERIALS AND METHODS
Plant material, crop husbandry and experimental design
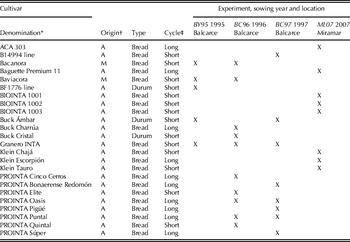
Four field experiments were carried out, termed BY95, BC96, BC97 and ML07. A randomized complete block design with four replications in BY95 and BC96, and three replications in BC97 and ML07, was used. Experiments BY95, BC96 and BC97 were conducted at Balcarce, Argentina (37°45′S, 58°18′W, 130 m asl); experiment ML07 was carried out at Miramar, Argentina (38°10′S, 58°00′W, 64 m asl). Wheat cultivars evaluated in these experiments are listed in Table 1. The experimental unit consisted of a plot of seven rows wide (inter-row distance 0·2 m) by c. 5·5 m long; no crop samples were drawn from the first or seventh row, which were discarded. Diseases, weeds and pests were chemically controlled in all experiments. Seeds were treated with a benomyl–thiram mixture before seeding and weeds were controlled with a commercial mixture (Misil II) of metsulfuron methyl (5 g a.i./ha) and dicamba (60 g a.i./ha). Fungal diseases were prevented with tebuconazole (Folicur, 187 g a.i./ha). With the exception of experiment ML07, which was not irrigated, none of the experiments experienced water or nutrient limitations. Cultivars were sown in batches according to the duration of their life cycle (Table 1), so that all would have a fairly similar anthesis date. At the individual spike level, anthesis date was defined as the day on which the spike showed at least one spikelet with an extruded anther. At the plot level, anthesis date was defined as the day on which half of the spikes showed at least one spikelet with an extruded anther. For this purpose, the number of spikes at anthesis was computed in 40–50 spikes per plot every 2–3 days, and the date on which half of the spikes were at anthesis was calculated by linear interpolation of anthesis proportion on calendar time.
Wheat cultivars evaluated in experiments BY95, BC96, BC97 and ML07; sowing year and location of each experiment. Cultivars included in each experiment are marked with X

* In alphabetical order.
† A: Argentina; M: Mexico (CIMMYT).
‡ As determined in Balcarce.
Evaluation of SF at anthesis v. maturity
In experiments BY95, BC96 and BC97, biomass samples were collected 7 days after anthesis (A+7), i.e. end of the non-grain spike growth period (Abbate et al. Reference Abbate, Andrade, Culot and Bindraban1997b), by cutting plants from the five central rows of each plot (0·8 m2) at ground level. A sub-sample of 40 tillers per sample was dissected to determine the dry weight proportion of stems, leaves and spikes. In a sub-sample of three to five spikes, immature grains were detached from the spike and weighed to determine their contribution to spike dry weight. These data were used to calculate spike chaff dry weight per area unit at A+7.
At maturity, another crop sample of 0·8 m2 was taken from each plot. A sub-sample of 40 tillers per sample were cut at the lowest spikelet level, dried, weighed and threshed to determine grain proportion of spike dry weight. Then, the remaining spikes were threshed for assessing grain yield. Dry weight per grain was determined by counting and weighing two groups of 500 grains each from a manually cleaned subsample. This variable and grain yield were used to calculate grain number/m2. Spike chaff dry weight/m2 at maturity was calculated with the weight proportion of grain to spike and with grain yield. SF at A+7 (SFA+7) was calculated as the quotient between grain number/m2 at maturity and spike chaff dry weight/m2 at A+7. This formula, proposed by Abbate et al. (Reference Abbate, Lázaro, Andrade, Kohli and Martino1997a, Reference Abbate, Andrade, Culot and Bindrabanb), was considered here as the reference method. SF at maturity (SFM), on the other hand, was calculated as the quotient between grain number/m2 and spike chaff dry weight/m2, both determined at maturity.
Evaluation of SF at the plot v. individual spike level
In experiments BC96 and BC97, SFA+7 was determined at the plot level as described previously. This variable was then compared with SF evaluated on an individual spike basis. SF of individual spikes was assessed 15 days after anthesis (A+15) instead of A+7, because: (1) both the number of grains and spike weight had to be determined for each individual spike, which posed the need to determine grain number and spike weight in the same spike, (2) the immature grains were more easily distinguished at A+15 than at A+7; therefore, removing the grains from the spike at A+15 was much easier than it was at A+7 and (3) spike weight (devoid of grain) did not change significantly from A+7 to A+15 (Abbate et al. Reference Abbate, Andrade, Culot and Bindraban1997b). Forty spikes per plot were harvested; length and spikelet number were determined in each spike, and five spikes of length and spikelet number similar to the plot average were drawn from the harvested sample. Grains were removed and counted, and spikes devoid of grain were dried and weighed. SF at the individual spike level (SFind) was calculated for each of these spikes as the quotient between grain number and spike chaff dry weight and averaged by plot.
Evaluation of SF at different sample sizes
In experiment ML07, 40 individual spikes were sampled per plot at maturity. Sampling was done by drawing five consecutive spikes in each of eight different spots within a plot. Each group of spikes was dried and weighed and the grains were then detached from the spikes, counted and weighed. SF was calculated for each group of spikes as the quotient between grain number and spike chaff dry weight.
Statistical analysis
An ANOVA was performed for each of experiments BY95, BC96 and BC97. An additional ANOVA was done according to Annicchiarico (Reference Annicchiarico2002) with combined data from experiments BC96 and BC97, comprising only those cultivars evaluated in both experiments. To ascertain the association between SFA+7 and SFM, regression and correlation analysis were carried out with data from experiments BY95, BC96 and BC97, both individually and jointly. Data from cultivars included in both experiments BC96 and BC97 were used to calculate the regression and correlation between SFA+7 and SFind. All regressions were carried out with the treatment means.
In the context of a breeding programme, the feasibility of separating genetic materials into SF categories (e.g. low, medium and high) would be very useful. Thus, the McNemar test of agreement for categorical rating (Sun & Yang Reference Sun and Yang2008) was performed for comparing all different methods of SF estimation, using the MH Program software (Uebersax Reference Uebersax2006). Data were ordered and separated into three categories of equal number of observations (i.e. 1/3 each).
Data generated in experiment ML07 were used to determine the evolution of the standard error of the mean of each treatment upon changes in sample size (n). The method for defining the sample size was based on the ‘confidence interval method’ described by Montgomery (Reference Montgomery and Montgomery1997). The relative standard error of the mean (RSEM) was calculated as a function of n, as follows:
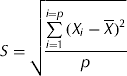 $$S = \sqrt {\displaystyle{{\sum\limits_{i = 1}^{i = p} {(X_i - \overline X)^2}} \over p}} $$
 $${\rm RSEM} = \displaystyle{{{S / {\sqrt n}}} \over {\overline X}}$$
where S is the standard deviation of X, p is the total number of observations, X i is the value of the ith observation and  $\overline X$ is the mean of X.
RESULTS
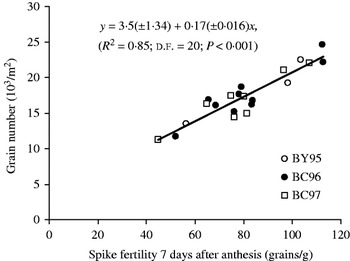
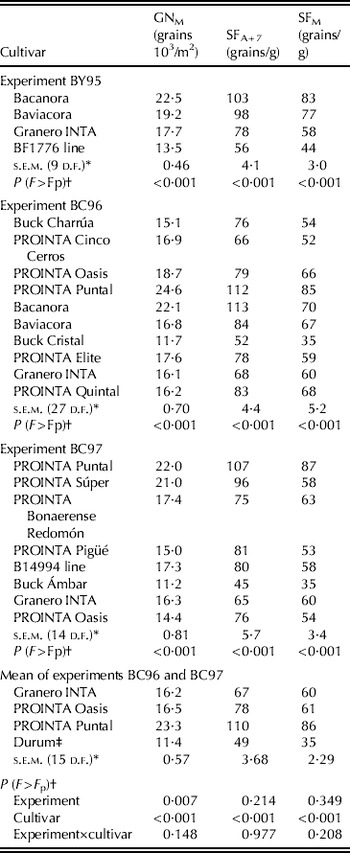
Differences between cultivars were observed for grain number/m2, SFA+7 and SFM in experiments BY95, BC96 and BC97 (Table 2), and an association between grain number/m2 and SFA+7 was found (Fig. 1). Analysis of combined data from those cultivars in common between experiments BC96 and BC97 (Granero INTA, PROINTA Oasis, PROINTA Puntal and a durum wheat cultivar, Buck Cristal or Buck Ámbar) showed significant differences between cultivars with no cultivar×experiment interaction (Table 2).
Relationship between grain number/m2 and SF 7 days after anthesis, in three experiments (BY95, BC96 and BC97) at Balcarce. One line per individual experiment did not produce a better fit. The s.e.m. are shown in Table 2.

Cultivar effects on grain number/m2 at maturity (GNM), spike fertility measured 7 days after anthesis (SFA+7) and maturity (SFM), in three experiments at Balcarce

* s.e.m., standard error of mean of cultivars; d.f., degrees of freedom.
† Probability of F-test (Fp) from ANOVA.
‡ Mean of durum wheats Buck Cristal and Buck Ámbar.
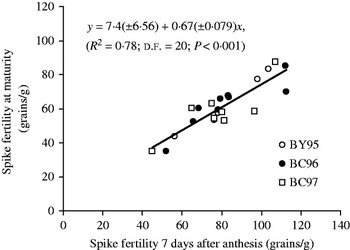
Correlation analysis between SFM and SFA+7 (as method of reference) was carried out for each experiment individually. Both variables were linearly associated in each of the experiments BY95, BC96 and BC97, with R 2=0·99, 0·78 and 0·68, respectively (P<0·001). As the fitted regression did not differ significantly among experiments, a line combining data from all three experiments is shown in Fig. 2. The linear fit was highly significant (P<0·001) with R 2=0·78. The McNemar test showed complete agreement between SFM and SFA+7 as methods of classification.
Relationship between SF measured at maturity and 7 days after anthesis, both at plot level, in three experiments (BY95, BC96 and BC97) at Balcarce. One line per individual experiment did not produce a better fit. The s.e.m. are shown in Table 2.

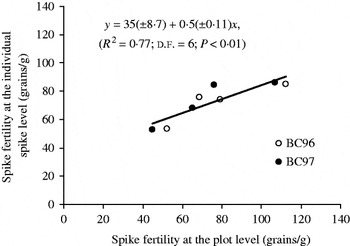
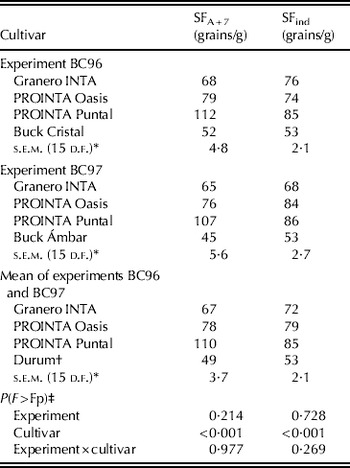
The relationship between SFind (individual spikes) and SFA+7 (i.e. plot samples) is shown in Fig. 3. For the four cultivars evaluated in both experiments BC96 and BC97, a linear, highly significant adjustment was detected (P<0·001; R 2=0·77). Differences between cultivars were observed for SFA+7 as well as for SFind (Table 3). The McNemar test showed agreement between SFind and SFA+7 as methods for classification, with only a proportion of 0·20 of discrepancies. None of these discrepancies involved the most extreme categories (i.e. low and high SF).
Relationship between SF determined in large samples 7 days after anthesis (i.e. plot level) and in small samples 15 days after anthesis (i.e. individual spike level), for four cultivars in two experiments (BC96 and BC97) at Balcarce. One line per individual experiment did not produce a better fit. The s.e.m. are shown in Table 3.

Cultivar effects on SF determined in large samples 7 days after anthesis (i.e. plot level; SFA+7) and in small samples 15 days after anthesis (i.e. individual spike level; SFind), for four cultivars in two experiments at Balcarce

* s.e.m., standard error of mean of cultivars; d.f., degrees of freedom.
† Mean of durum wheats Buck Cristal and Buck Ámbar.
‡ Probability of F-test (Fp) from ANOVA.
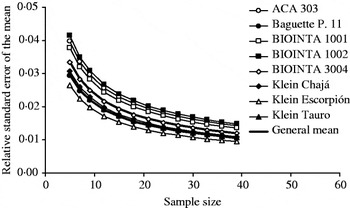
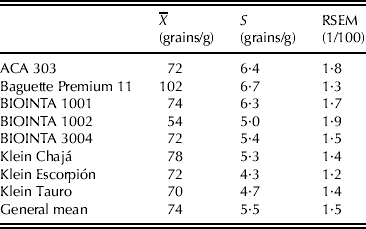
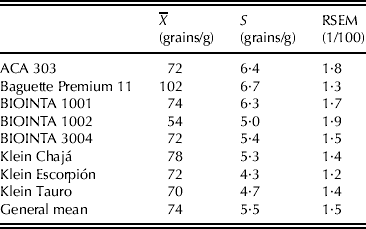
The evolution of the RSEM, estimated by Eqn (2) and statistics (Table 4), as a function of increasing quantities of spikes sampled, is shown in Fig. 4. For the eight cultivars evaluated in experiment ML07, reducing the sample size from 15 to 10 or five spikes increased the RSEM, but its estimated value continued to be, on average, rather low: 0·019 for n=15, 0·024 for n=10 and 0·034 for n=5 (maximum RSEM among cultivars was 0·024, 0·029 and 0·041, respectively). In addition, further increasing sample size from 15 to 40 spikes only slightly reduced the estimated RSEM, to an average of 0·012 for n=40 (maximum RSEM between cultivars 0·015).

Parameters for estimating the RSEM of SF at maturity as a function of sample size (n in Eqn (2); Fig. 4), for eight cultivars in experiment ML07. $\overline X$ is the mean and S is the standard deviation of X, obtained with 24 observations (each one of 5-spike samples, i.e. parameter p of Eqn (1)). RSEM is expressed as relative to the mean, calculated for n=p
DISCUSSION
According to the approach originally proposed by Fischer (Reference Fischer, Smith and Banta1984), SF is a component of potential grain number/m2 in wheat. Subsequently, Abbate et al. (Reference Abbate, Andrade, Lázaro, Bariffi, Berardocco, Inza and Marturano1998) found evidence of the importance of SFA+7 in grain number/m2 determination in a group of Argentine cultivars. More recently, Acreche et al. (Reference Acreche, Briceño-Félix, Sánchez and Slafer2008) confirmed this in Spanish cultivars. In the present study, a strong correlation between grain number/m2 and SFA+7 was detected, providing additional support to the cited literature. However, the method used by the cited authors for SF determination is laborious, time-consuming, expensive and destructive. This makes it impracticable in the context of a breeding programme, in which a large number of entries have to be screened within a short time frame and the seed has to be conserved for further generations. The present results indicate that SF determination at maturity can satisfactorily substitute for SF determination around anthesis, thereby allowing the evaluation of SF after all the breeding material has been harvested.
Some studies (Abbate et al. Reference Abbate, Andrade, Culot and Bindraban1997b; Fischer & Stockman Reference Fischer and Stockman1980; Fischer Reference Fischer1985) have shown that spike chaff dry weight at maturity may not be a good estimator of spike chaff dry weight at the beginning of grain filling, which could constitute a potential caveat of the methodology proposed here. Abbate et al. (Reference Abbate, Andrade, Culot and Bindraban1997b) observed that the greater the availability of assimilates during grain filling, the greater the increase in spike dry weight: the increase was 38% under good growing conditions, but as low as −8% under shading or the occurrence of lodging. In the experiments shown in Fig. 2, spike chaff dry weight increased, on average, 33% from anthesis to maturity. As a result, mean SFA+7 (80 grains/g) was greater than mean SFM (61 grains/g), and thus the relationship between these variables exhibited a slope less than one (Fig. 2). However, the present study did not aim to evaluate the evolution of spike chaff dry weight under environmental changes, but focused on SF of different genotypes growing under the same environment. Thus, the SF variation during grain filling should not be relevant in this context, unless there was a significant genotype×environment interaction; however, the results presented here (Table 2) show that this interaction is very low and never statistically significant.
The data discussed above were obtained with samples collected per area unit; that is, at the plot scale. From a breeding standpoint, this would only be applicable to advanced generations, which have enough seed for carrying out plot-size evaluations. Screening and selection in the initial stages of a breeding programme, on the other hand, have the obvious advantage of fixing a trait early during the breeding process, so long as it has mild to high heritability. SF appears to be genetically controlled, with a low genotype×environment interaction (calculated from Abbate et al. Reference Abbate, Andrade, Lázaro, Bariffi, Berardocco, Inza and Marturano1998, Reference Abbate, López, Brach, Gutheim, Gonzalez, Kruk and Serrago2007; Lázaro & Abbate Reference Lázaro and Abbate2011 and Table 2), which merits attempting its evaluation in early generations. The present results indicate that SF determination at the individual spike level appears to yield substantially similar results to SF determination at the plot level. Thus, the application of the latter method would be acceptable in the context of a breeding programme aiming to select for high SF.
In the experiment ML07 discussed above, a sample size of five individual spikes per plot was used for SF determination (i.e.15–20 spikes per treatment). But would increasing the sample size significantly reduce the RSEM? As shown in Fig. 4, increasing the sampling size to 10–15 spikes decreased the RSEM, but only a negligible decline in RSEM was achieved when further increasing the sample size. Therefore, drawing c. 10–15 spikes per treatment seems to yield satisfactory results, and it constitutes a fairly manageable amount of sampling and processing material in practical terms. Moreover, such a sample size would allow the process to be automated, i.e. a machine could be designed to process samples more quickly than manually.
In conclusion, wheat SF can be determined in a fairly accurate way by sampling a small group of individual spikes at crop maturity, thereby allowing the evaluation of a large number of treatments in a timely fashion and the screening of breeding material from early generations.
We thank María Castaño for her technical assistance in experiment ML07.