


%20--%3e%3c!DOCTYPE%20svg%20PUBLIC%20'-//W3C//DTD%20SVG%201.0//EN'%20'http://www.w3.org/TR/2001/REC-SVG-20010904/DTD/svg10.dtd'%3e%3csvg%20version='1.0'%20id='Layer_1'%20xmlns='http://www.w3.org/2000/svg'%20xmlns:xlink='http://www.w3.org/1999/xlink'%20x='0px'%20y='0px'%20width='64px'%20height='64px'%20viewBox='5.5%20-3.5%2064%2064'%20enable-background='new%205.5%20-3.5%2064%2064'%20xml:space='preserve'%3e%3cg%3e%3ccircle%20fill='%23FFFFFF'%20fill-opacity='0'%20cx='37.785'%20cy='28.501'%20r='28.836'/%3e%3cpath%20fill='%23595959'%20d='M37.441-3.5c8.951,0,16.572,3.125,22.857,9.372c3.008,3.009,5.295,6.448,6.857,10.314%20c1.561,3.867,2.344,7.971,2.344,12.314c0,4.381-0.773,8.486-2.314,12.313c-1.543,3.828-3.82,7.21-6.828,10.143%20c-3.123,3.085-6.666,5.448-10.629,7.086c-3.961,1.638-8.057,2.457-12.285,2.457s-8.276-0.808-12.143-2.429%20c-3.866-1.618-7.333-3.961-10.4-7.027c-3.067-3.066-5.4-6.524-7-10.372S5.5,32.767,5.5,28.5c0-4.229,0.809-8.295,2.428-12.2%20c1.619-3.905,3.972-7.4,7.057-10.486C21.08-0.394,28.565-3.5,37.441-3.5z%20M37.557,2.272c-7.314,0-13.467,2.553-18.458,7.657%20c-2.515,2.553-4.448,5.419-5.8,8.6c-1.354,3.181-2.029,6.505-2.029,9.972c0,3.429,0.675,6.734,2.029,9.913%20c1.353,3.183,3.285,6.021,5.8,8.516c2.514,2.496,5.351,4.399,8.515,5.715c3.161,1.314,6.476,1.971,9.943,1.971%20c3.428,0,6.75-0.665,9.973-1.999c3.219-1.335,6.121-3.257,8.713-5.771c4.99-4.876,7.484-10.99,7.484-18.344%20c0-3.543-0.648-6.895-1.943-10.057c-1.293-3.162-3.18-5.98-5.654-8.458C50.984,4.844,44.795,2.272,37.557,2.272z%20M37.156,23.187%20l-4.287,2.229c-0.458-0.951-1.019-1.619-1.685-2c-0.667-0.38-1.286-0.571-1.858-0.571c-2.856,0-4.286,1.885-4.286,5.657%20c0,1.714,0.362,3.084,1.085,4.113c0.724,1.029,1.791,1.544,3.201,1.544c1.867,0,3.181-0.915,3.944-2.743l3.942,2%20c-0.838,1.563-2,2.791-3.486,3.686c-1.484,0.896-3.123,1.343-4.914,1.343c-2.857,0-5.163-0.875-6.915-2.629%20c-1.752-1.752-2.628-4.19-2.628-7.313c0-3.048,0.886-5.466,2.657-7.257c1.771-1.79,4.009-2.686,6.715-2.686%20C32.604,18.558,35.441,20.101,37.156,23.187z%20M55.613,23.187l-4.229,2.229c-0.457-0.951-1.02-1.619-1.686-2%20c-0.668-0.38-1.307-0.571-1.914-0.571c-2.857,0-4.287,1.885-4.287,5.657c0,1.714,0.363,3.084,1.086,4.113%20c0.723,1.029,1.789,1.544,3.201,1.544c1.865,0,3.18-0.915,3.941-2.743l4,2c-0.875,1.563-2.057,2.791-3.541,3.686%20c-1.486,0.896-3.105,1.343-4.857,1.343c-2.896,0-5.209-0.875-6.941-2.629c-1.736-1.752-2.602-4.19-2.602-7.313%20c0-3.048,0.885-5.466,2.658-7.257c1.77-1.79,4.008-2.686,6.713-2.686C51.117,18.558,53.938,20.101,55.613,23.187z'/%3e%3c/g%3e%3c/svg%3e)
%20--%3e%3c!DOCTYPE%20svg%20PUBLIC%20'-//W3C//DTD%20SVG%201.0//EN'%20'http://www.w3.org/TR/2001/REC-SVG-20010904/DTD/svg10.dtd'%3e%3csvg%20version='1.0'%20id='Layer_1'%20xmlns='http://www.w3.org/2000/svg'%20xmlns:xlink='http://www.w3.org/1999/xlink'%20x='0px'%20y='0px'%20width='64px'%20height='64px'%20viewBox='5.5%20-3.5%2064%2064'%20enable-background='new%205.5%20-3.5%2064%2064'%20xml:space='preserve'%3e%3cg%3e%3ccircle%20fill='%23FFFFFF'%20fill-opacity='0'%20cx='37.637'%20cy='28.806'%20r='28.276'/%3e%3cg%3e%3cpath%20fill='%23595959'%20d='M37.443-3.5c8.988,0,16.57,3.085,22.742,9.257C66.393,11.967,69.5,19.548,69.5,28.5c0,8.991-3.049,16.476-9.145,22.456%20C53.879,57.319,46.242,60.5,37.443,60.5c-8.649,0-16.153-3.144-22.514-9.43C8.644,44.784,5.5,37.262,5.5,28.5%20c0-8.761,3.144-16.342,9.429-22.742C21.101-0.415,28.604-3.5,37.443-3.5z%20M37.557,2.272c-7.276,0-13.428,2.553-18.457,7.657%20c-5.22,5.334-7.829,11.525-7.829,18.572c0,7.086,2.59,13.22,7.77,18.398c5.181,5.182,11.352,7.771,18.514,7.771%20c7.123,0,13.334-2.607,18.629-7.828c5.029-4.838,7.543-10.952,7.543-18.343c0-7.276-2.553-13.465-7.656-18.571%20C50.967,4.824,44.795,2.272,37.557,2.272z%20M46.129,20.557v13.085h-3.656v15.542h-9.944V33.643h-3.656V20.557%20c0-0.572,0.2-1.057,0.599-1.457c0.401-0.399,0.887-0.6,1.457-0.6h13.144c0.533,0,1.01,0.2,1.428,0.6%20C45.918,19.5,46.129,19.986,46.129,20.557z%20M33.042,12.329c0-3.008,1.485-4.514,4.458-4.514s4.457,1.504,4.457,4.514%20c0,2.971-1.486,4.457-4.457,4.457S33.042,15.3,33.042,12.329z'/%3e%3c/g%3e%3c/g%3e%3c/svg%3e)
Introduction
Antimicrobial stewardship (AMS) is crucial for infection control, addressing the rise of multidrug‑resistant organisms (MDROs) driving healthcare‑associated infections. 1 AMS complements standard infection control and isolation precautions Reference Siegel, Rhinehart, Jackson and Chiarello2 by ensuring optimal choice, dosing, route, and duration to maximize therapeutic benefit and minimize side effects. Reference Dellit, Owens and McGowan3 Effective antimicrobial stewardship programs (ASPs) reduce inappropriate prescribing, lower antimicrobial resistance (AMR) and Clostridioides difficile rates, improve outcomes, and reduce healthcare costs, thus alleviating healthcare‑associated infection burden. Reference Baur, Gladstone and Burkert4,Reference Alawi, Tashkandi and Basheikh5
Authorities, including the CDC and WHO, advocate ASPs as an essential tool against AMR. 6,7 However, effective stewardship requires considerable resources, multidisciplinary teams and strong informatics infrastructure. Rule-based decision support systems can enhance stewardship by improving detection of inappropriate prescriptions, enabling near‑real‑time risk stratification, and optimizing antimicrobial therapy. Reference Rawson, Ahmad, Toumazou, Georgiou and Holmes8,Reference Pennisi, Pinto, Ricciardi, Signorelli and Gianfredi9
In Hong Kong, the government’s One Health approach and development of “Hong Kong Strategy and Action Plan on Antimicrobial Resistance” for 2017–2022 and 2023–2027 emphasize hospital ASP implementation. 10,Reference Ma11 Queen Mary Hospital has pioneered ASP through infection control nurse (ICN)-coordinated case reviews with concurrent physician feedback to prescribers. Reference Cheng, To and Li12,Reference Kumana, Ching and Kong13 We report the implementation of a rule-based decision support system “Smart ASP” in our hospital to scale stewardship activities. The Smart ASP primarily aimed to improve and sustain broad-spectrum antimicrobial prescribing appropriateness, with overall consumption reduction and MDRO trend evaluation as secondary ecological outcomes.
Methods
Setting
This retrospective study was conducted at Queen Mary Hospital, a 1,700‑bed university‑affiliated hospital governed by the Hospital Authority in Hong Kong, providing specialized services, including solid organ and bone marrow transplantation. An ASP targeting broad-spectrum intravenous antimicrobials began in January 2005, Reference Cheng, To and Li12 building on a vancomycin usage audit initiated in 1997. Reference Kumana, Ching and Kong13 The Smart ASP initially focused on piperacillin–tazobactam and meropenem, later expanding to include cefoperazone–sulbactam, cefepime, imipenem–cilastatin, and vancomycin, in accordance with the Interhospital Multidisciplinary Programme on Antimicrobial ChemoTherapy (IMPACT) guideline first published in Hong Kong in 1999. Reference Ma, Tsui, Wu and Ho14
ASP before implementation of the rule-based decision support system
Since 1997, a multidisciplinary team manually conducted the ASP. Reference Cheng, To and Li12,Reference Kumana, Ching and Kong13 Pharmacists generated daily lists of inpatients receiving targeted antimicrobials for ICN review. Each morning, ICNs reviewed patients’ medical records at the bedside to evaluate antimicrobial indications. Every working day at midday, ICNs and clinical microbiologists met to determine the appropriateness of antimicrobial prescriptions. Prescription appropriateness was determined based on predefined clinical justifications, requiring specific criteria for either targeted or empirical therapy. For targeted therapy, appropriateness required matching the antimicrobial to available microbiological culture and susceptibility results. For empirical therapy, appropriateness required adherence to guideline-approved indications for specific disease states or clinical scenarios, including: documented allergy history precluding narrower-spectrum first-line agents, neutropenic fever, documented clinical failure of first-line antibiotics, immunocompromised status, nosocomial infection, unreliable or impossible oral intake/absorption, severe clinical infection, or other specified valid clinical indications. For noncompliant prescriptions, ICNs provided immediate feedback to prescribing physicians through memos in the afternoon. In complex cases without consensus, clinical microbiologists conducted bedside evaluations and offered recommendations. Beginning in January 2010, the ASP was incorporated into the inpatient consultation service provided by clinical microbiologists Reference Yuen, Seto and Chau15 to assess compliance with the IMPACT guideline and appropriateness as defined above.
ASP after implementation of the rule-based decision support system
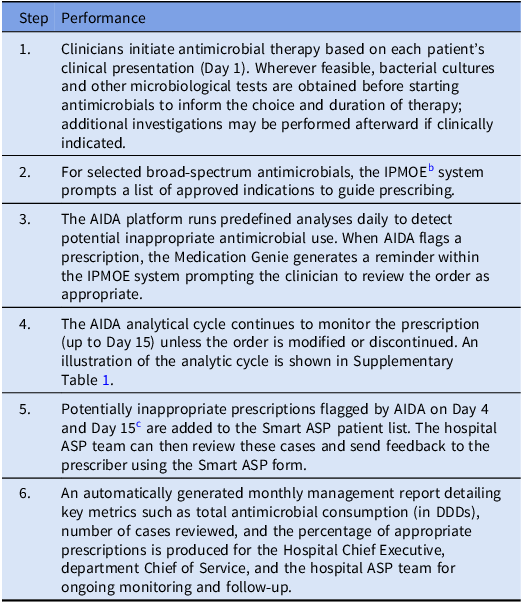
In early 2024, with support from the Hospital Authority’s information technology (IT) unit, a protocol‑driven IT tool called “Smart ASP” was developed to detect potentially inappropriate antimicrobial prescriptions through advanced data analytics. Smart ASP consists of four main elements. First, the Artificial Intelligence and Data Analytics (AIDA) platform functions as a rule-based expert system applying predefined rules to clinical and laboratory data (eg, inflammatory markers, cultures) to flag potentially inappropriate prescriptions. Second, Medication Genie is a decision‑support module that is directly triggered by AIDA’s output, issuing automated reminders to clinicians when a prescription requires review. Third, Smart ASP patient list and form provide workflow and documentation support such as standardized electronic templates for audit notes and predefined menus for selecting specific appropriateness or inappropriateness reasons during prescription audits. Lastly, the performance reporting function produces summary reports for monitoring program activity and trends over time. These components streamline case identification, deliver timely clinician feedback, facilitate auditing, and enable continuous stewardship monitoring. Automated case identification expanded monitoring from historically assessed units (Medicine, Surgery, and Orthopedics) to previously unassessed units, including Oncology and the Intensive care unit (ICU). The Smart ASP service model and analytic cycle are illustrated in Table 1 and Supplementary Table 1, respectively.
Service model of Smart ASP for selected broad-spectrum antimicrobials in the hospital a

Table 1. Long description
A table outlining the steps and performance of the Smart ASP service model for antimicrobial prescriptions. The table has two columns: Step and Performance. It contains six rows detailing the process. Row 1: Step 1, Clinicians initiate antimicrobial therapy based on each patient’s clinical presentation (Day 1). Wherever feasible, bacterial cultures and other microbiological tests are obtained before starting antimicrobials to inform the choice and duration of therapy; additional investigations may be performed afterward if clinically indicated. Row 2: Step 2, For selected broad-spectrum antimicrobials, the IPMOE system prompts a list of approved indications to guide prescribing. Row 3: Step 3, The AIDA platform runs predefined analyses daily to detect potential inappropriate antimicrobial use. When AIDA flags a prescription, the Medication Genie generates a reminder within the IPMOE system prompting the clinician to review the order as appropriate. Row 4: Step 4, The AIDA analytical cycle continues to monitor the prescription (up to Day 15) unless the order is modified or discontinued. An illustration of the analytic cycle is shown in Supplementary Table 1. Row 5: Step 5, Potentially inappropriate prescriptions flagged by AIDA on Day 4 and Day 15 are added to the Smart ASP patient list. The hospital ASP team can then review these cases and send feedback to the prescriber using the Smart ASP form. Row 6: Step 6, An automatically generated monthly management report detailing key metrics such as total antimicrobial consumption (in D D D s), number of cases reviewed, and the percentage of appropriate prescriptions is produced for the Hospital Chief Executive, department Chief of Service, and the hospital ASP team for ongoing monitoring and follow-up.
Note: AIDA, Artificial Intelligence and Data Analytics; IPMOE, Inpatient Medication Order Entry.
a The selected broad‑spectrum antimicrobials included piperacillin–tazobactam, cefoperazone–sulbactam, cefepime, imipenem–cilastatin, meropenem, and vancomycin. Smart ASP was rolled out in phases: meropenem was added on 1 February 2024, piperacillin–tazobactam on 5 March 2024, and cefoperazone–sulbactam, cefepime, imipenem–cilastatin, and vancomycin on 7 May 2024.
b IPMOE (Inpatient Medication Order Entry) is the locally standardized closed-loop electronic medication administration subsystem utilized across Hospital Authority institutions in Hong Kong.
c Day 4 was selected to allow sufficient time for final culture and susceptibility results to be reported and acted upon by the primary team, while Day 15 was chosen to flag unusually prolonged courses of therapy that require clinical microbiologist or infectious disease specialist review.
Consumption of antimicrobials before and after implementation of Smart ASP
Antimicrobial prescriptions from 2016 to 2025 were retrieved from the Clinical Data Analysis and Reporting System (CDARS) as previously described. Reference Wong, Chau and So16 This included overall consumption of all antimicrobial classes and individual agents across various specialties, such as Medicine, Surgery, Orthopedics, Oncology, and the ICU. Monthly antimicrobial consumption was calculated as defined daily dose (DDD) per 1,000 patient days using patient days data from CDARS.
Incidence of MDROs before and after implementation of Smart ASP
The corresponding incidence of new MDRO cases, including methicillin-resistant Staphylococcus aureus (MRSA), vancomycin-resistant Enterococci (VRE), extended-spectrum beta-lactamase (ESBL)-producing organisms and carbapenem-resistant Acinetobacter (CRA) species, was retrieved from the CDARS. Data on carbapenemase-producing Enterobacterales (CPE) were obtained from the laboratory information system. A new case was defined as a patient without a laboratory culture of the respective MDROs in the preceding 12 months. Incidence is expressed as the number of new cases per 1,000 patient days. Reference Wong, Chau and So17
Statistical analysis
Descriptive statistics summarized antimicrobial consumption from 2016 to 2025 as DDD per 1,000 patient days, reported as medians with interquartile ranges (IQRs). Continuous longitudinal trends in baseline antimicrobial consumption over the 10-year period were assessed using ordinary least squares (OLS) linear regression. Nonlinear longitudinal trends in MDRO incidence rates (per 1,000 patient days) were evaluated using Locally Weighted Scatterplot Smoothing (LOWESS) with a smoothing fraction of 0.3.
To assess the rule-based Smart ASP’s impact, an interrupted time series (ITS) analysis was conducted using segmented OLS regression, aggregating data into monthly intervals. Specifically, total monthly antimicrobial DDDs were divided by total monthly patient days to calculate the continuous variable of DDD per 1,000 patient days, which was utilized in the regression models. The ITS models estimated two parameters: immediate level change (intercept step-change) at implementation and trend change (slope) during the postintervention period relative to the preintervention baseline. Residual autocorrelation was checked using the Durbin–Watson statistic, and subgroup ITS analyses evaluated the intervention’s impact in specific clinical specialties (Medicine, Surgery, Orthopedics, and ICU). Sensitivity analyses with 1-, 2-, and 3-month lag periods assessed potential delays in intervention effects.
To investigate the bidirectional temporal relationships between broad-spectrum antimicrobial consumption and MDRO incidence, a cross-correlation function (CCF) analysis with double-prewhitening was performed to prevent spurious correlations driven by underlying temporal trends or autoregressive artifacts. Optimal autoregressive integrated moving average (ARIMA) models were fitted using the lowest Akaike information criterion (AIC) to independently reduce both the antimicrobial and MDRO time series to white noise. To confirm the appropriate use of this statistical approach, Ljung–Box testing was performed in advance to verify that the ARIMA-derived residuals for all evaluated series were successfully reduced to white noise. Subsequently, cross-correlations of the prewhitened residuals were calculated for time lags ranging from −3 to +3 months, with statistical significance of lagged correlations evaluated using Z-scores. Changes in prescribing quality were assessed by comparing the proportion of appropriate antimicrobial prescriptions between the preintervention (2019 Q1–2023 Q4) and postintervention (2024 Q2–2025 Q4) periods using the Mann–Whitney test. Data from the transition period of Smart ASP in Q1 2024 were excluded from the analysis. Specialties without preintervention data were excluded from this analysis. All statistical analyses were performed using Python (version 3.14), with a two-sided P value < .05 considered statistically significant.
Results
Overall antibiotic consumption
Median overall targeted antimicrobial consumption was 188 DDD per 1,000 patient days (IQR, 169–204). Piperacillin-tazobactam and meropenem comprised the majority of this consumption. Piperacillin-tazobactam was the most utilized agent (43.3%; median 81 DDD per 1,000 patient days), followed by meropenem (35.1%; median 65 DDD per 1,000 patient days) (Supplementary Table 2).
Longitudinal trends in targeted antimicrobial consumption
Monthly data revealed a significant and steady upward trajectory in overall antibiotic utilization over the decade (average monthly linear increase of +0.5 DDD per 1,000 patient days), mirroring the rising institutional MDRO incidence. Detailed longitudinal trends for individual agents are provided in Supplementary Figure 1 and Supplementary Table 2.
Appropriateness of antimicrobial prescriptions and operational capacity before and after Smart ASP implementation
Before Smart ASP implementation, our manual multidisciplinary ASP, using a two-stage immediate concurrent feedback model, achieved a guideline conformance rate of 79.4% from 2005 to 2007. Reference Cheng, To and Li12 The addition of clinical microbiologist consultations Reference Yuen, Seto and Chau15 led to recommended modifications in 95.2% of consulted cases. In the five years preceding the Smart ASP intervention (2019–2023), the appropriateness of targeted antimicrobial prescriptions was monitored in the Department of Medicine, Surgery, and Orthopedics. During this period, appropriate prescription rates fluctuated between 74.9% and 97.1% across Medicine, Surgery, and Orthopedics. Following the transition to the Smart ASP in 2024 Q2, appropriateness rates significantly improved to over 90% in Medicine, Surgery, and Orthopedics (all P < .001 vs preintervention), and exceeded 90% in the newly assessed Oncology and ICU units (Supplementary Table 3).
Furthermore, the Smart ASP significantly increased overall stewardship capacity. Prior to the intervention (2021–2023), the ASP team manually reviewed an average of 170 cases per month, limited to three departments. Following full implementation (May 2024 to December 2025), the system automatically assessed an average of over 1,500 prescriptions per month hospitalwide. By auto-flagging an average of 530 potentially inappropriate prescriptions monthly for automated prescriber feedback, the system effectively filtered the workload so that only approximately 160 complex cases required manual review by the clinical microbiologist or infectious disease specialist (Supplementary Table 4).
Antimicrobial consumption after Smart ASP implementation
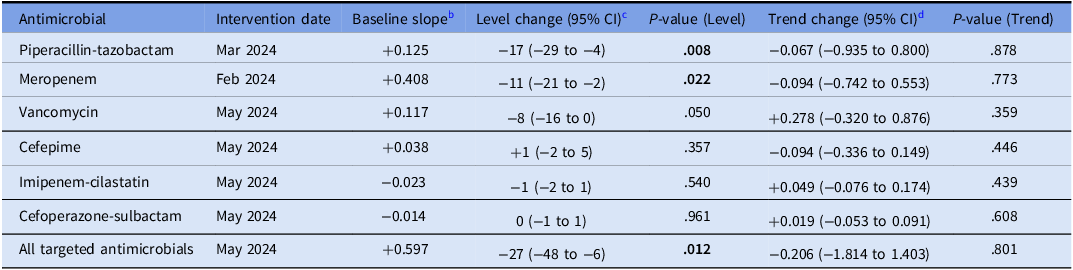
Implementing Smart ASP was associated with a significant reduction in overall targeted broad-spectrum antimicrobials consumption hospitalwide (Figure 1). Following full implementation in May 2024, an immediate level drop of −27 DDD per 1,000 patient days occurred (95% CI: −48 to −6, P = .012) (Table 2). Similar immediate reductions were observed for the most utilized agents, piperacillin-tazobactam and meropenem. The subsequent postintervention consumption trends remained largely unchanged (P = .801). This sustained trajectory aligns with expectations, as antimicrobial use continued to rise alongside the increase in MDRO incidence and may reflect continued need for the appropriate targeted therapies. Sensitivity analyses revealed no delayed effects on the overall consumption trend (Supplementary Table 5).
Interrupted time series analysis of hospitalwide and clinical specialty antimicrobial consumption before and after Smart ASP implementation. (A) Overall hospitalwide consumption. Subgroup analyses are stratified by department: (B) Medicine, (C) Surgery, (D) Orthopedics, and (E) Intensive care unit (ICU). Solid lines represent the predicted trends based on the interrupted time series (ITS) model, and scattered points represent observed monthly consumption in defined daily doses (DDDs) per 1,000 patient days. Vertical dashed lines indicate the implementation dates of the rule-based Smart ASP for different targeted antimicrobials (February to May 2024).

Interrupted time series analysis of antimicrobial consumption following Smart ASP implementation a

Table 2. Long description
The table presents data on the impact of Smart ASP implementation on antimicrobial consumption. It includes columns for Antimicrobial, Intervention date, Baseline slope, Level change (95% CI), P-value (Level), Trend change (95% CI), and P-value (Trend). The table has 8 rows and 7 columns. Row 1: Antimicrobial, Intervention date, Baseline slope, Level change (95% CI), P-value (Level), Trend change (95% CI), P-value (Trend). Row 2: Piperacillin-tazobactam, Mar 2024, +0.125, -17 (29 to 4), .008, -0.067 (-0.935 to 0.800), .878. Row 3: Meropenem, Feb 2024, +0.408, -11 (21 to 2), .022, -0.094 (-0.742 to 0.553), .773. Row 4: Vancomycin, May 2024, +0.117, -8 (16 to 0), .050, +0.278 (-0.320 to 0.876), .359. Row 5: Cefepime, May 2024, +0.038, +1 (-2 to 5), .357, -0.094 (-0.336 to 0.149), .446. Row 6: Imipenem-cilastatin, May 2024, -0.023, -1 (2 to 1), .540, +0.049 (-0.076 to 0.174), .439. Row 7: Cefoperazone-sulbactam, May 2024, -0.014, 0 (-1 to 1), .961, +0.019 (-0.053 to 0.091), .608. Row 8: All targeted antimicrobials, May 2024, +0.597, -27 (48 to 6), .012, -0.206 (-1.814 to 1.403), .801.
a Consumption is measured in defined daily doses (DDDs) per 1,000 patient days.
b Baseline slope represents the preintervention monthly trend.
c Level change represents the immediate step-change in DDD per 1,000 patient days at the time of intervention.
d Trend change represents the difference between the postintervention slope and the preintervention slope.
Subgroup ITS analysis revealed varied impact across specialties (Supplementary Table 6, Figure 1). The most pronounced immediate reduction in overall consumption was observed in the ICU (−151 DDD, 95% CI: −249 to −54, P = .003), followed by Surgery (−26 DDD, 95% CI: −51 to 0, P = .048). Medicine was the only specialty to demonstrate a significant postintervention trend reduction in overall consumption (trend change = −1.67 DDD per month, 95% CI: −3.15 to −0.18, P = .028).
Incidence of MDROs
During the 10-year study period, the overall incidence of MDROs showed a marked upward trend, primarily driven by a dramatic increase in CPE incidence from 2021 onward (Supplementary Figure 2, Supplementary Table 7). In contrast, the incidence rates of other monitored MDROs remained relatively stable throughout the decade.
Ecological time-lagged dynamics between antimicrobial use and MDRO incidence
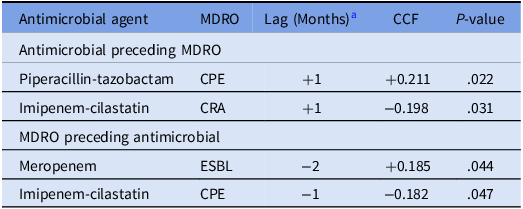
Ecological analysis of antimicrobial consumption and subsequent MDRO incidence demonstrated two statistically significant time-lagged associations. Elevated piperacillin-tazobactam consumption was significantly associated with an increase in CPE incidence one month later (Lag + 1: CCF = +0.211, P = .022), while increased imipenem-cilastatin usage correlated with a subsequent decrease in CRA incidence at one month (Lag + 1: CCF = −0.198, P = .031). Conversely, analysis of MDRO incidence preceding antimicrobial consumption revealed two significant associations. An increase in ESBL incidence was significantly associated with an increase in meropenem consumption two months later (Lag −2: CCF = +0.185, P = .044). Additionally, an increase in CPE incidence was associated with a statistically significant decline in imipenem-cilastatin usage in the following month (Lag −1: CCF = −0.182, P = .047). No significant time-lagged correlations were observed between vancomycin consumption and the incidence of MRSA or VRE within the evaluated time frame (Table 3).
Significant time-lagged correlations between antimicrobial consumption and MDRO incidence

Table 3. Long description
A table with four rows and five columns. The columns are labeled Antimicrobial agent, MDRO, Lag (Months), CCF, and P-value. The table is divided into two sections: Antimicrobial preceding MDRO and MDRO preceding antimicrobial. Under Antimicrobial preceding MDRO, the rows are Piperacillin-tazobactam with MDRO CPE, Lag +1, CCF +0.211, P-value .022; Imipenem-cilastatin with MDRO CRA, Lag +1, CCF -0.198, P-value .031. Under MDRO preceding antimicrobial, the rows are Meropenem with MDRO ESBL, Lag -2, CCF +0.185, P-value .044; Imipenem-cilastatin with MDRO CPE, Lag -1, CCF -0.182, P-value .047.
Note: CCF, cross-correlation function; CPE, carbapenemase-producing Enterobacterales; CRA, carbapenem-resistant Acinetobacter; ESBL, extended-spectrum beta-lactamase; MDRO, multidrug‑resistant organism.
a Positive lags indicate that changes in antimicrobial consumption precede changes in MDRO incidence. Negative lags indicate that changes in MDRO incidence precede changes in antimicrobial consumption. Lag 0 was excluded from this analysis.
Discussion
Our study demonstrates a concerning antimicrobial consumption trend, with a median of 188 DDD per 1,000 patient days over the 10-year period, although this figure is lower than that reported in a comparable Asian single-center study. Reference Kim, Hwang, Kim, Lee and Pai18 Historic data show significant initial achievement in our ASP, with compliance rates reaching 79.4% between 2005 and 2007. Reference Cheng, To and Li12 Despite these successes, the manual nature of the ASP, involving ICN-coordinated intensive case reviews and clinical microbiologist consultations, led to plateaued compliance. The time lag between antimicrobial prescription and audit in acute care settings further limited reductions in consumption. Consequently, we implemented the rule-based Smart ASP.
The introduction of Smart ASP, which provides microbiological data, indications, and timely prescription review reminders, marked a pivotal shift. This was associated with an immediate decrease in overall antimicrobial consumption, particularly broad-spectrum agents such as piperacillin-tazobactam and meropenem, with total targeted antimicrobials declining by 27 DDD per 1,000 patient days postimplementation. Subgroup analyses suggested that the effect of Smart ASP varied by specialty. Both ICU and Surgery demonstrated significant immediate reduction in antimicrobial consumption. In contrast, Medicine did not show a significant immediate overall reduction, but was the only specialty with a significant postintervention downward trend in antimicrobial consumption. These findings suggest Smart ASP exerts varied effects across clinical settings. Notably, the profound immediate reduction observed in the ICU likely reflects the introduction of stewardship activities to a previously unassessed unit, made possible by the workflow efficiencies of the Smart ASP, which increased hospitalwide assessment capacity nearly tenfold while keeping the manual review burden stable. The distinct benefits observed in units with mature and established manual ASPs, specifically the significant immediate consumption drop in Surgery and the sustained downward trend after implementation in Medicine, demonstrate that the Smart ASP provided substantial additive value and optimization.
The transient consumption reduction, followed by a continued upward trend despite sustained appropriateness improvements, emphasizes a fundamental stewardship principle: the ultimate goal is optimal, not minimal, use. The sustained upward consumption trajectory is driven by increasing patient acuity and shifting infectious diseases epidemiology, particularly the dramatic rise in CPE since 2021. Because these prescriptions meet IMPACT guideline appropriateness criteria, total consumption rises despite high conformance. Reference MacDougall and Polk19 This provides reassurance that rising consumption is an evidence-based response to escalating MDRO rates rather than inappropriate empirical prescribing. Behaviorally, clinical decision support systems are frequently subject to habituation and “alert fatigue.” Reference Ancker, Edwards and Nosal20 Although the Smart ASP’s initial deployment deterred borderline prescribing, prescribers may have gradually become desensitized to automated reminders, contributing to the consumption rebound.
ASPs often encounter administrative and cultural obstacles, particularly where clinical autonomy is highly valued. Competing clinical priorities, resource limitations and personnel shortages hinder implementation. Reference Pouly, Coppry, Rogues and Dumartin21–Reference Abbas23 Furthermore, increasing patient complexity, rising MDRO prevalence exacerbates these challenges, making automated solutions like Smart ASP increasingly valuable.
Our analysis revealed a significant positive temporal correlation between increased piperacillin-tazobactam consumption and a rise in CPE incidence one month later. This finding is consistent with the hypothesis that broad-spectrum antimicrobial exposure may contribute to selective pressure, but causality cannot be inferred from this ecological analysis. Reference Lee, Oh, Choi and Lee24 Interestingly, the ecological association between increased imipenem-cilastatin usage and a subsequent CRA incidence decrease was unexpected, as literature indicates carbapenem use typically facilitates CRA emergence. Reference Lautenbach, Synnestvedt and Weiner25 However, enhanced infection control measures have effectively controlled healthcare-associated carbapenem-resistant Acinetobacter baumannii, even amid increasing use of extended-spectrum beta-lactam/beta-lactamase inhibitor combinations, cephalosporins, and carbapenems. Reference Wong, Chau and So16 This reinforces the importance of implementing an infection control program incorporating continuous innovations in hand hygiene promotion Reference Wong, Ip and Kwok26,Reference Wong, Chiu and Chiu27 in conjunction with the ASP. Conversely, rising ESBL-producing organism incidence was associated with subsequent increases in meropenem use, likely reflecting clinical prescribing responses to changing resistance epidemiology. Reference Ho, Wong, Chow, Yip, Wong and Que28–Reference Ho, Cheung and Wang30 The increase in CPE incidence was associated with subsequent lower imipenem use, consistent with imipenem not being a preferred treatment for CPE infections, demonstrating the need for tailored antimicrobial strategies. However, we acknowledge that MDRO incidence is a long-term, multifactorial metric influenced by shifting epidemiology, patient acuity, and broader infection control practices, meaning these correlations reflect ecological trends rather than isolated outcomes of the ASP intervention alone.
In Hong Kong, controlling carbapenem use is challenged by increasing fecal carriage of ESBL-producing organisms and community sources of multidrug-resistant bacteria. Reference Ho, Wong, Chow, Yip, Wong and Que28–Reference Wong, Chan and Lam31 The rising CPE incidence is evident from our multi-pronged screening strategy. Community acquisition is linked to wet market exposure and detection of resistant E. coli in food animals and healthy populations. Reference Ho, Chow and Lai32–Reference Ho, Wang and Liu34 Although CPE control extends beyond hospitals, Reference Cheng, Wong, Wong, Ho and Yuen35 enforcing strict infection control within healthcare settings remains crucial to prevent the propagation of AMR. Reference Cheng, Wong and Ma36
A key study strength is the advanced statistical methodology evaluating temporal dynamics between antimicrobial consumption and MDRO incidence. Unlike previous studies relying on simple correlations or basic linear regression models, Reference Liang, Zhang, Zhou, Meng, Zhong and Peng37–Reference Paiboonvong, Tedtaisong, Montakantikul, Gorsanan and Tantisiriwat39 which often ignore temporal trends and autocorrelation, our ARIMA modeling with double-prewhitened CCF analysis identifies time-lagged associations from confounding artifacts. This provides a significantly more robust characterization of the bidirectional ecological associations between antimicrobial consumption and MDRO incidence.
Despite strengths including extensive longitudinal data and advanced ARIMA modeling, our study has several limitations. First, our single-institution design limits generalizability. Second, the hospitalwide rollout included units with and without preexisting manual stewardship; thus, the aggregate consumption reduction reflects a combined effect, although subgroup analyses help delineate these distinct effects. Moreover, as an ecological time series analysis, these temporal correlations cannot establish causation at the patient level and may be influenced by unmeasured confounders, including infection control practices, case mix, colonization pressure, screening intensity, and outbreak dynamics. Finally, we did not adjust for potential changes in infection control practices over the COVID-19 pandemic when studying these correlations. Reference Ma, Hsu and Chow40
Conclusion
Our findings demonstrate the potential utility of rule-based decision support approaches in achieving a transient reduction in antimicrobial consumption, with heterogeneous effects across clinical specialties, while reiterating the complexities of ASPs amid rising MDROs. Comprehensive strategies addressing drivers of antimicrobial use and continuous evaluation of automated stewardship interventions are needed for sustainable improvement.
Supplementary material
The supplementary material for this article can be found at https://doi.org/10.1017/ash.2026.10799.
Data availability statement
The data sets generated for this study will be made available in anonymized form from the corresponding author upon reasonable request.
Acknowledgements
We are grateful to the Information Technology and Health Informatics Division of the Hong Kong Hospital Authority for their technological support, as well as to the clinical microbiologists and infectious disease specialists for their contributions to the antimicrobial stewardship program at Queen Mary Hospital.
Author contribution
EKYC: Conceptualization, Data curation, Formal analysis, Methodology, Project administration, Writing—original draft, and Writing—review and editing. SCW: Conceptualization, Data curation, Methodology, Project administration, Writing—original draft, and Writing—review and editing. SYCS: Data curation, Methodology. EHWC: Methodology, and Writing—review and editing. ART: Writing—review and editing. ESKM: Data curation and Writing—review and editing. KYY: Writing—review and editing. KHYC: Conceptualization, Data curation, Methodology, Project administration, Writing—original draft, and Writing—review and editing. VCCC: Conceptualization, Data curation, Formal analysis, Methodology, Project administration, Supervision, Writing—original draft, and Writing—review and editing. All authors have read and agreed to the published version of the manuscript.
Financial support
This study has no funding or sponsorship.
Competing interests
The authors declare no competing interests.
Ethical standard
This study was approved by the Institutional Review Board of The University of Hong Kong/Hospital Authority Hong Kong West Hospital Cluster (IRB reference number: UW 26-130).


 Open access

