


1. Introduction
Observations have shown that a small but significant Antarctic warming has occurred over the past century (Reference Jacka and BuddJacka and Budd, 1998), and the average Antarctic sea-ice extent may have reduced by about 5 × 10⁶ km2 (over 2° lat.) from the early 1930s to the mid-1970s (Reference De la MareDe la Mare, 1997). It is known that the Antarctic sea ice plays a pivotal role in global climate (e.g. Reference BuddBudd, 1991; Reference HannaHanna, 1996). Interaction of sea ice with the atmosphere above and the ocean beneath influences the polar climate. The change of the ice cover influences the turbulent- (sensible-and latent-)heat transfer, the absorption of solar radiation at the surface, the formation of cloud, wind stress, ocean currents, oceanic heat flux, salinity, bottom water formation and other factors, and through feedbacks affects the climate at lower latitudes. The changed climate can in turn influence the sea-ice distribution which is a sensitive indicator of climatic change (Reference BakerBaker, 1986). It is therefore important to be able to simulate an accurate representation of the sea-ice distribution and its past changes with time in coupled global climate models to provide confidence in the use of the models for future climate-change studies. In this work we use a combination of modelling techniques in conjunction with the limited available observational data to examine Antarctic sea-ice changes with global warming over the past century.
2. Description of Models
The CSIRO (Commonwealth Scientific and Industrial Research Organisation) global climate model (GCM) (Reference Gordon and O’FarrellGordon and O’Farrell, 1997) is a comprehensive GCM comprising sub-models of the atmosphere, ocean, sea ice and land biosphere. The atmospheric model is spectral, with 21 wave (R21) and 9 (sigma) vertical levels (Reference McGregor, Gordon, Watterson, Dix and RotstaynMcGregor and others, 1993). The ocean model is the standard GFDL (Geophysical Fluid Dynamics Laboratory) model but includes oceanic eddy-induced advection (Reference Hirst and McDougallHirst and McDougall, 1996), according to the Reference Gent and McWilliamsGent and McWilliams (1990) scheme which improves the model simulation (Reference Hirst, Gordon and O’FarrellHirst and others, 1996). The sea-ice model (Reference Gordon and O’FarrellGordon and O’Farrell, 1997; Reference O’FarrellO’Farrell, 1998) includes the three-layer thermodynamic treatment of Reference SemtnerSemtner (1976), with ice dynamics based on Reference Flato and HiblerFlato and Hibler (1992).
The Melbourne University atmosphere-sea-ice model includes a 21 wave (R21) 9 (sigma) level atmospheric general circulation model (Reference SimmondsSimmonds, 1985) and a dynamic-thermodynamic sea-ice model (Reference Wu, Simmonds and BuddWu and others, 1997). The thermodynamic representation of the sea-ice model is the Reference SemtnerSemtner (1976) "zero-layer" version model plus a parameterisation for leads and albedo of ice and snow given by Reference Wu, Simmonds and BuddWu and others (1997). The dynamics of the sea-ice model is similar to but simpler than the "cavitating-fluid" version of the Reference Flato and HiblerFlato and Hibler model (1992), with only the compressive stresses effective in the sea ice. At low ice concentration the sea ice is modelled to move in free drift, with a speed taken to be 2% of the (instantaneous) atmospheric wind, and at an angle of 25° to the left of it (in the Southern Hemisphere). Internal resistance of sea ice to deformation occurs at high concentrations of sea ice, and a mass conservative parameterisation of the rafting processes, which is ice-thickness and open-water-fraction dependent, is included (Reference Worby and WuWorby and Wu, 1998; Reference Wu, Budd, Lytle and MassomWu and others, 1999).
3. Experiments and Data
In this study we examine changes in the Antarctic sea ice which have occurred along with changes in surface temperature over the past century, by using a combination of modelling techniques in comparison with the limited observational data available. Firstly, we use the CSIRO coupled GCM forced by the increasing greenhouse gases from last century (starting in AD 1880) to the present and on into the future. The equivalent CO2 used is varied to give the same radiative forcing change as resulting from the total greenhouse-gas build-up observed for the calendar years 1880-1990 and estimated according to the IS92a scenario for 1991-2082 (Reference Houghton, Filho, Callander, Harris, Kattenberg and MaskellHoughton and others, 1996). The equivalent CO2 reaches three times the 1880 value at 2082 and is held constant thereafter (Reference HirstHirst, 1999). It should be noted that the IS92a scenario is about in the middle of the IS92 "family". In this work we focus on the simulation over the Southern Hemisphere from 1880 to the present and to the end of next century. Secondly, in order to examine how the sea-ice changes relate directly to the temperature changes alone, we use the Melbourne University atmosphere-sea-ice model forced with the Reference ReynoldsReynolds (1988) sea-surface-temperature (SST) climatology and the GISST (U.K. Meteorological Office global sea-ice and SST; Reference Parker, Jackson and HortonParker and others, 1995a) anomalies of 1881-1910 from 1980-94 to compute changes in the Antarctic sea ice from last century to the present. Thirdly, we use the Melbourne University atmosphere-sea-ice model forced with Reference ReynoldsReynolds (1988) SST climatology and the global SSTanomalies derived from the CSIRO coupled-model simulation, to model the changes in the Antarctic sea ice. In this way we assess the relation between the sea-ice and SST changes and examine how both change with the greenhouse-gas forcing in comparison with observations.
Reasonably accurate observations of the sea-ice distribution have been available from satellites since the early 1970s. Some limited sea-ice data are available over a longer timescale from a variety of sources which include observations made from ships and aircraft, and from coastal and island stations, and indirect observations derived from whaling records (Reference De la MareDe la Mare, 1997). However, the Antarctic sea-ice distribution was not well known prior to the 1960s (Reference ParkinsonParkinson, 1990). The observational data of sea ice used in this study comprise a number of compilations based on ship observations, including the early data from last century which were published by Reference ParkinsonParkinson (1990), in conjunction with the most recent satellite observations of the Special Sensor Microwave Imager (SSM/I) (1988-95). The observed sea-ice extent for the historical data used is the combination of results of the expeditions of Cook, Bellingshausen and Wilkes in the late 18th and early 19th centuries (see Reference ParkinsonParkinson, 1990, for details). The sea-ice extent observed by Cook, Bellingshausen and Wilkes may differ from that of the later period, 1881-1910 However, the more comprehensive compilations of sea-ice extent made from the later ship observations, including the Belgica, Deutchland, Gauss and Endurance (Reference Meinardus, Koppen and GeigerMeinardus, 1938) and the Discovery (Reference HerdmanHerdman, 1948), provide further evidence that there was little long-term net change in the sea-ice extent through the 19th century when compared to the large interannual variability (Reference RenkinRenkin, 1997). Therefore in this study we use the sea-ice extent observed by Cook, Bellingshausen and Wilkes relative to the extent of ice at the same locations at the same time of year from the most recent satellite data to represent the sea-ice extent of 1881-1910, although this may only provide a limited indicative estimate of the sea-ice-extent reduction over the past century. The temperature data are taken from the combined land-air and sea-surface temperature of Reference JonesJones (1994), Reference Parker, Folland and JacksonParker and others (1995b) and Reference Kelly and JonesKelly and Jones (1996). The observations over the Antarctic are from jacka (unpublished data, http://www.antcrc.utas.edu.au/∼jacka/climate.html).
4. Results
4.1. Temperature
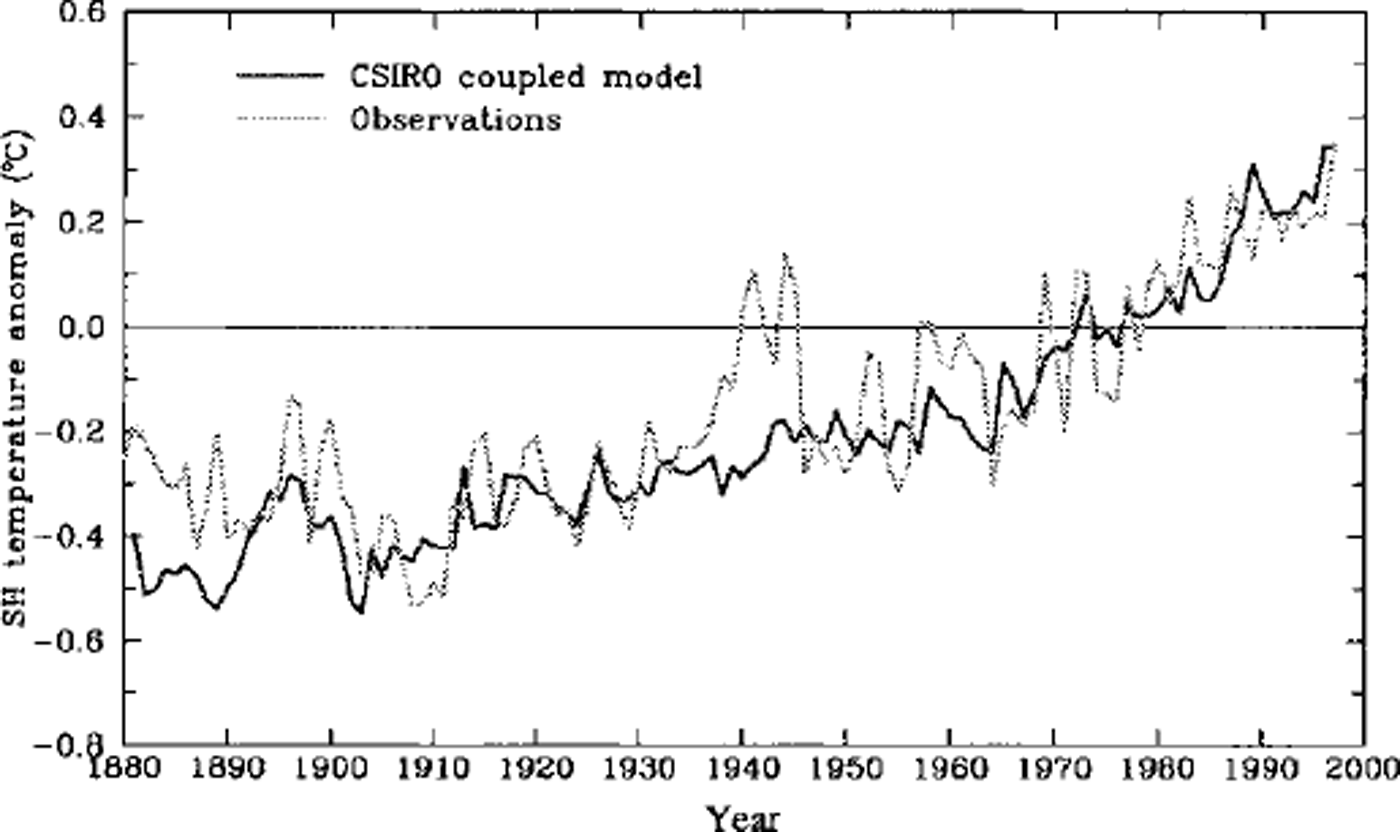
Southern Hemisphere surface-temperature anomalies (relative to 1961-90) simulated by the CSIRO coupled model are compared with observations in Figure 1. The observational data are the combined land-air and sea-surface temperatures from the global dataset (Reference JonesJones, 1994; Reference Parker, Folland and JacksonParker and others, 1995b) also computed as anomalies from the 1961-90 average. It is recognised that observations in the higher latitudes for the early periods are very sparse, but the close agreement between the model results and observations also holds well over all latitudes, including the domain of lower latitudes where the observations are more robust.
Southern Hemisphere annual mean surface-temperature anomalies, 1881-1997 (relative to the long-term mean, 1961-90), as simulated by the CSIRO coupled model and compiled from observations (Reference JonesJones, 1994; Reference Parker, Folland and JacksonParker and others, 1995b).
Regional average surface mean-temperature changes from 1881-1910 to 1980-94 and 1950-64 to 1980-94 are compared in Table 1. These include the globe, the Southern Hemisphere, the Southern Ocean sector (we choose the region 25-65° S) and the Antarctic (60° S poleward). Because of the lack of observations over the Antarctic before the International Geophysical Year (1957-58), it is not practical for us to make comparisons between the model simulation and the observations on the time-scale of 100 years. It can be seen that the simulated surface-temperature changes compare well with the observed changes over both the past 100 years or so and the past 30 years. The simulated excessive global mean warming is due to the higher warming simulated in the Northern Hemisphere, possibly due to the lack of the cooling effect of aerosols not included in the model (Reference HirstHirst, 1999).
Averages of surface temperature changes (°C) from 1881-1910 and 1950-64 to 1980-94 for the globe (G), the Southern Hemisphere (SH), the region 25-65° S (SOC) and the Antarctic (60° S poleward), from observations (Reference Kelly and JonesKelly and Jones, 1996) and model simulations

Although the large-scale and long-term temperature changes are well simulated, the year-to-year variations of temperature can be quite large at any one location, and the model simulations can be quite different from observations. For example, Reference Connolley and O’FarrellConnolley and O’Farrell (1998) showed that the CSIRO coupled model (and two other models), when forced with atmospheric greenhouse gases, does not reproduce temperature changes as observed in the Antarctic Peninsula region over the past 50 years. The surface air-temperature increase simulated in the CSIRO coupled model at the South Orkney Islands (on Laurie Island, 60°45’S, 44°43’ W) is also found to be less than that from the observations (Jacka, unpublished data). It can be seen in Figure 1 that the observed Southern Hemisphere warming during the 1940s is not captured by the model simulation. In addition, the model greatly underestimates the interannual and multi-annual variability. There could be many reasons for this. Firstly, there are many processes in the real world which have not been included in the coupled model (e.g. the effect of volcanoes, aerosols and land-surface anthropogenetic and biofeedback effects). Secondly, the incomplete coverage of the observations and the changes in this coverage over time need to be kept in mind. Thirdly, the equivalent CO2 record used in the model was smoothed, and the initial magnitude and phase for any anomalies in the climate system, compared to those in the start of the coupled model, are unknown. Finally, there is a conservative influence of the flux correction used in the coupled model. Nevertheless, the model reasonably simulates the large-scale, long-term mean global warming over the past 100 years or so, and provides useful information for many other climatic variables which form part of the interactive climate system and for which there are either limited or no observations.
4.2. Sea-ice extent
The change in latitude of observed sea-ice extent at each location (longitude) was calculated where available historical data permitted, and the mean changes are given in Table 2. The simulated mean changes from 1881-1910 to 1980-94 are also given in Table 2 for the CSIRO coupled model (CM), and the Melbourne University atmosphere-sea-ice model forced with SST anomalies from the GISST data (FGISST) and from the CSIRO coupled-model-derived SST anomalies (FCM). To avoid any undue influence of extreme outliers when the change is >4° from the observations at any location, that location is excluded from the calculation of the averaged change. Comparing the ice-edge locations recorded by Reference CookCook (1777, as referred to in Reference ParkinsonParkinson, 1990) with those of the present (satellite observations of SSM/I, 1988-95) the sea ice reduces by about 1.17°, which is more than the CSIRO coupled-model simulation of 0.65° for 1881-1910 to 1980-94, but less than the SST forcing simulations which are 2.03° for FGISSTand 1.43° for FCM. Comparing the ice-edge locations recorded by Reference BellingshausenBellingshausen (1831, as referred to in Reference ParkinsonParkinson, 1990) with those of the present, the sea ice reduces by about 1.03°, which is more than the simulations of CM (0.46°) and FCM (0.84°) but less than the simulation of FGISST (1.29°). In contrast to Cook’s and Bellingshausen’s observations, the ice-edge locations recorded by the Wilkes expedition (from Reference BertrandBertrand, 1971, as referred to in Reference ParkinsonParkinson, 1990) when compared with those of the present show virtually no change in the averaged sea-ice extent, although there are reductions at some locations yet increases at other locations. However, all model simulations show sea-ice reduction at the Wilkes expedition locations but with a smaller magnitude than at Cook’s and Bellingshausen’s observed locations. Combining the observations recorded by Cook, Bellingshausen and Wilkes, the average sea-ice extent is about 0.71° less than at present, which is more than the simulated change from CM (0.44°) but less than the simulated changes from FGISST (1.31°) and FCM (0.91°).
Change in observed and simulated mean sea-ice extent. Units are °lat.
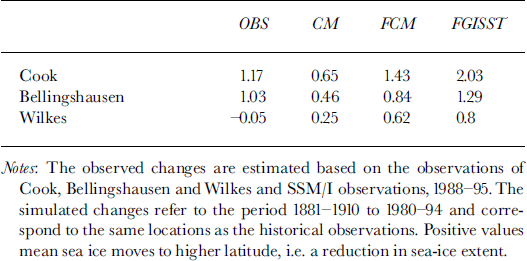
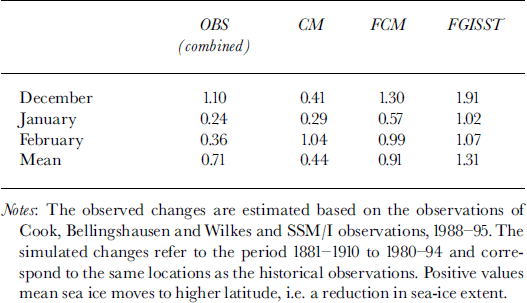
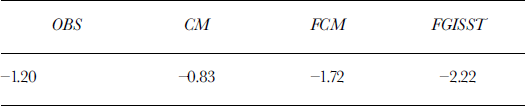
The historical expeditions mainly covered the summer season, December-February. The greatest reduction of sea-ice extent relative to the present occurs in December, and the smallest in January (Table 3). This agrees with the forcing-model simulations, but CM shows the greatest change in February. Bearing in mind the uncertainty of the historical observations of sea-ice extent, FCM produces the simulation of changes closest to the observed of the three experiments conducted. The ratio of mean sea-ice-extent change to temperature change in the Southern Ocean sector (25-65° S) is given in Table 4. Observations indicate that a 1°C warming corresponds to approximately a 1.20° retreat in sea ice. This retreat is larger than that simulated by the CSIRO coupled model (0.83°) but smaller than that simulated in the SST forced experiments (1.72° for FCM and 2.22° for FGISST).
Change in observed and simulated mean sea-ice extent, December-February. Units are ° lat.
Ratio of mean sea-ice-extent change to temperature change (in the Southern Ocean sector 25-65° S) from both observations and model simulations. Units are ° lat. K-1
4.3. Predicted temperature and sea-ice changes into the next century
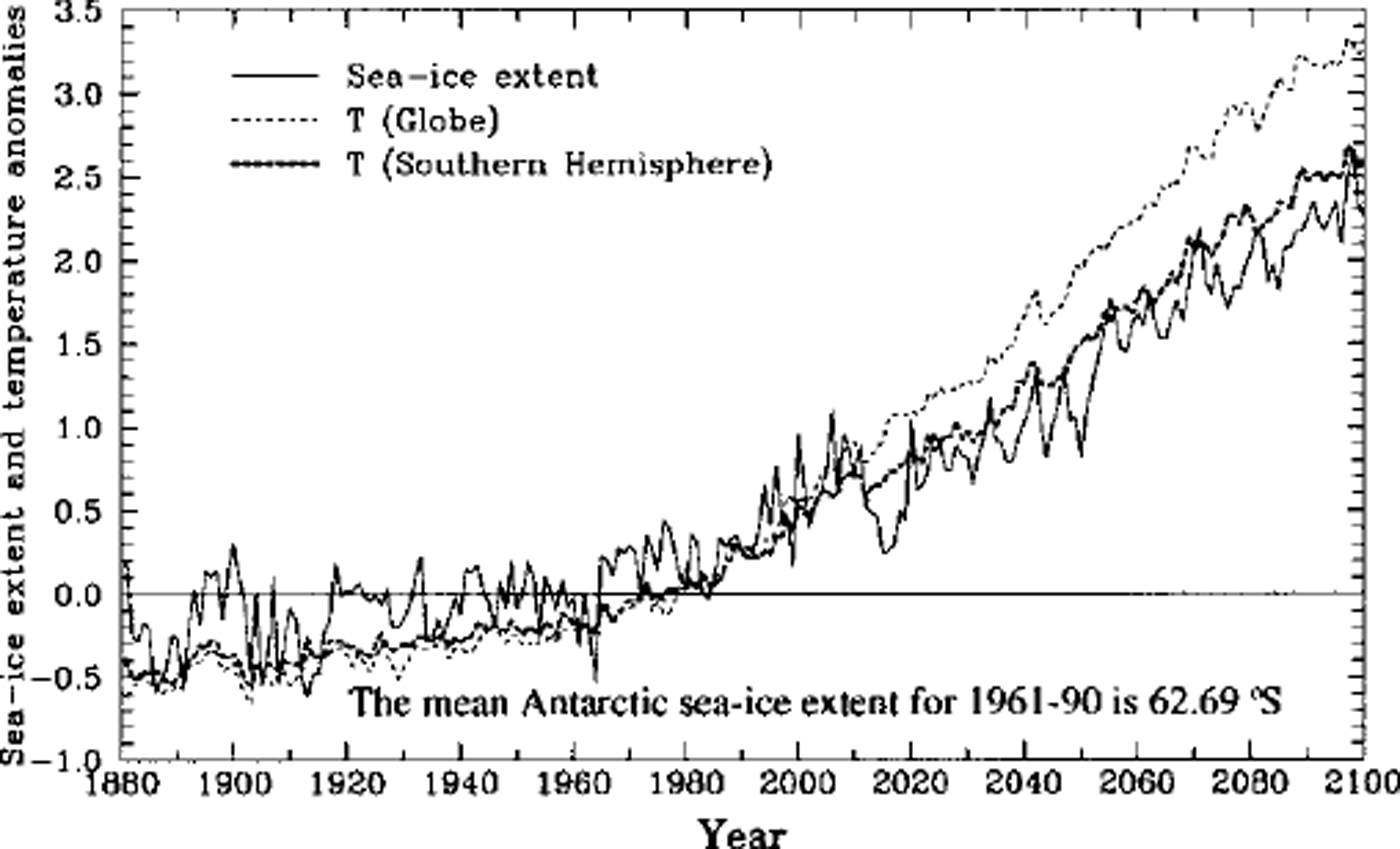
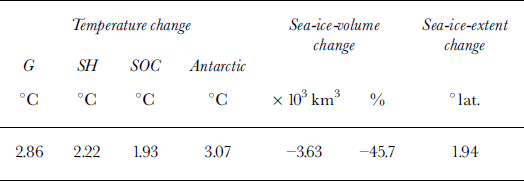
Using the IS92a greenhouse-gases-emission scenario (Reference Houghton, Filho, Callander, Harris, Kattenberg and MaskellHoughton and others, 1996), the CSIRO coupled model simulates a global warming of 2.8°C and a Southern Hemisphere warming of 2.2°C by the end of the next century (Figs 2 and 3; Table 5). This simulation also indicates a reduction in the annual mean Antarctic sea-ice extent of 1.94°, and a reduction in Antarctic sea-ice volume of >45% from the present.
Coupled-model simulation of the annual mean Antarctic sea-ice extent and surface temperature for both the globe and Southern Hemisphere, 1881-2100. The values are expressed as differences relative to the 30year average values, 1961-90. The units for sea-ice extent are °lat. (positive value means sea-ice edge moves to a higher latitude, indicating a reduction in sea-ice extent).The units of temperature are0 C.
Coupled-model simulation of the Southern Hemisphere annual mean sea-ice volume, 1881-2100. The values are expressed as differences relative to the 30year average values 1961-90.

Coupled-model simulated averages of annual mean surface temperature changes for the globe (G), the Southern Hemisphere (SH), the region 25-65° S (SOC) and the Antarctic (60 °Spoleward), 1980-94 to 2080-94. Also given are the annual mean sea-ice-volume and sea-ice-extent changes for the same period
5. Discussion and Conclusions
A combination of modelling techniques is used in combination with the limited available observational data to examine the Southern Hemisphere warming and the changes in Antarctic sea ice over the past century. The CSIRO coupled model gives an increase in the Southern Hemisphere mean surface temperature, due to increasing greenhouse gases, from last century to the present, of about 0.6°C, which is comparable to the observed changes. The modelled temperature changes are less over the Southern Ocean (north of the sea ice) and more over the Antarctic continent and sea-ice regions, which is also in agreement with observations (Reference Jacka and BuddJacka and Budd, 1998). The CSIRO coupled-model simulation gives reductions in the mean Antarctic sea-ice extent of about 0.44° lat. compared to the observations of about 0.71° lat. based on the mean historical data recorded by the Cook, Bellingshausen and Wilkes expeditions (Reference ParkinsonParkinson, 1990) and the most recent satellite (SSM/I) observations. For the two SST forcing cases using the Melbourne University atmosphere-sea-ice model (FCM and FGISST) the resultant sea-ice-extent changes give larger reductions in mean extent of about 0.91-1.31° lat, which exceeds both the results from the CSIRO coupled-model simulation and the observations (Table 3). Assuming the two models reproduce plausible low and high estimates for changes in sea-ice coverage, we conclude that the sea-ice extent over the past century has reduced by about 0.4-1.8° lat. (Table 6). We also conclude that the CSIRO coupled model is unlikely to overestimate the changes in sea-ice extent from last century to the present.
The change in simulated monthly and annual mean sea-ice extent. The simulated changes refer to the period 1881-1910 to 1980-94 and all longitudes. Units are ° lat.

Finally, the CSIRO coupled model simulates a global warming of 2.8°C and a Southern Hemisphere warming of 2.2°C by the end of the next century. This simulation also indicates a reduction in mean sea-ice extent of 1.94°, and a reduction in Antarctic sea-ice volume of >45% from the present. With greater sensitivity in the decrease of Antarctic sea-ice extent obtained with the Melbourne University atmosphere-sea-ice model, the decrease of Antarctic sea-ice extent and volume by that time, for the same temperature change, might be expected to be even larger along with consequential similar larger reductions in salt flux and Antarctic Bottom Water production. Since the mean temperature changes from greenhouse-gas forcing for the CSIRO coupled model are similar to those obtained from other coupled-model simulations (Reference Houghton, Filho, Callander, Harris, Kattenberg and MaskellHoughton and others, 1996) we conclude that the future sea-ice changes simulated by the CSIRO coupled model are not expected to be overestimates of those likely to occur.
Acknowledgements
We thank members of the Climate Modelling Program at CSIRO Atmospheric Research for developing the CSIRO fully coupled model. In particular, A. G. Hirst and S. P. O’Farrell made the CSIRO fully coupled model and data available to us. We would also like to thank I. Simmonds and an anonymous referee for valuable comments which helped to improve the paper.



