Introduction
With further advancement in the treatment techniques of radiation therapy, the planning procedures become more sophisticated. Oncologists are required to contour different types of treatment targets and organs at risk in vicinity. This is a tedious and very time-consuming job. The delineation of targets and organs at risk was done manually; the contouring time for a complete set of nasopharyngeal (NP) cases could be up to 2·7 hours.Reference Harari, Song and Tomé 1 Different semi-automatic and automatic segmentation methods were proposed. Previous studies showed that the contouring time could be reduced by 25–75%.Reference Teguh, Levendag and Voet 2 – Reference Young, Wortham, Wernick, Evans and Ennis 5 Many studies focussed on proving the efficiency and validating their proposed semi-automatic or automatic method. Several studies evaluated the efficiency by comparing the amount of contouring time saved from editing the auto-segmented contours.Reference Teguh, Levendag and Voet 2 – Reference Young, Wortham, Wernick, Evans and Ennis 5 Some studies used evaluation metrics such as the Dice similarity coefficient (DSC) and auto-segmented volume to validate the auto-segmentation programme.Reference Yang, Zheng, Nofal, Deasy and El Naqa 6 , Reference Velazquez, Parmar and Jermoumi 7 The measure of editing time approach was regarded as the gold standard as it could accurately reflect the efficiency of the segmentation method. However, this approach required significant resources and was not always practical. The evaluation metrics method used was similarity metrics to evaluate the similarity between auto-segmented contours and manual drawn contours. It was postulated that the higher the value of the similarity indices, the more efficient was the proposed auto-segmentation method, and hence, more time would be saved in the structure delineation process. The evaluation metric method was found to be more frequently used in evaluating the performance of segmentation algorithms.
The most popular similarity indices could be categorised as overlapping-based and distance-based indices. For the overlapping-based indices, the DSC is the most common method. The DSC had a drawback of missing the distance information of misclassified volumes. For instance, two contours with the same number of voxels being misclassified would have the same value of DSC regardless of their distance from the true boundary. The distance-based methods such as Hausdorff distance (HD) could supplement this missing information.
Both DSC and HD were widely used to evaluate the similarity of two contours and the performance of the auto-segmentation algorithms.Reference La Macchia, Fellin and Amichetti 4 , Reference Yang, Zheng, Nofal, Deasy and El Naqa 6 , Reference Hwee, Louie and Gaede 8 – Reference Al-Mayah and Moseley 10 These similarity measures offered the advantage of easy calculation. However, these similarity measures might not be a good indicator to reflect the editing time required. As measuring the manual contouring and modifying contour time might not always be practical, a new quantitative measure that could directly reflect the amount of contouring time saved would be desirable in this research area.
In light of the above difficulties, we proposed a new perimeter-based similarity index that hopefully could have a stronger relationship with the amount of contouring time saved. The traditional way to delineate the targets and organs at risk was to draw the contours by free hand on the axial images. The contouring time should be related to the axial perimeter of the structure. This paper aimed to validate the proposed perimeter-based similarity index and at the same time to evaluate the accuracy of the most commonly used metrics, DSC and modified normalised average Hausdorff distance (MNAHD).
Methods
The proposed perimeter-based index (PBI) was designed based on the contouring behaviour of the observers. The observers delineated the targets and organs at risk by contouring their outlines instead of using a paintbrush to fill the structures. Intuitively, the contouring time was related to the perimeter more than the area of the structures.
We postulated that the contouring time was directly proportional to the length drawn, that is the perimeter of the structures.
 $${{{\rm Editing}\,{\rm time}} \over {{\rm Manual}\,{\rm contouring}\,{\rm time}}}\propto{{{\rm Editing}\,{\rm length}} \over {{\rm Manual}\,{\rm contouring}\,{\rm length}}}$$
PBI was calculated using the following equation:
 $$\displaylines { {\rm PBI {\equals} }1-\left( {{\rm Total \,\, editing \,\,length}} \right)\,/\,\cr \left( {{\rm Total\,\, axial\,\, perimeter \,\,of\,\, a\,\, structure}} \right) \cr {\equals}1{\minus}\mathop \sum\limits_{{\rm i}{\equals}1}^n (a_{i} {\plus}r_{i} )\,/\,\mathop \sum\limits_{i{\equals}1}^n (P(R_{i} )) $$
where n is the number of axial slice that contained the reference structure;
 $a_{i} $
the contour length for adding the missing part at the i
th axial slice;
 $r_{i} $
the contour length for removing the excess part at the i
th axial slice and P(R
i
) is the contour length of the reference contour at the i
th axial slice.
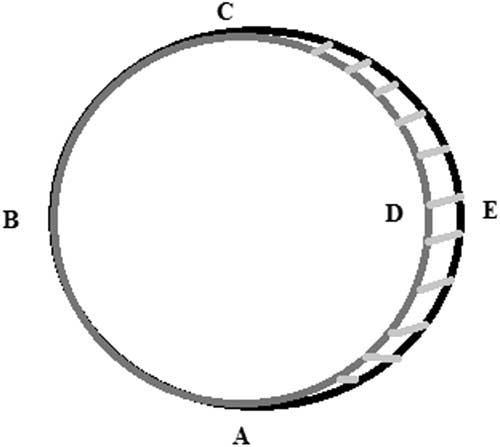
Figure 1 illustrated the calculation of PBI, which is given by
 $${\rm PBI}{\equals}1{\minus}{{L\left( {\mathop{{CEA}}\limits^{\frown } } \right)} \over {L\left( {\mathop{{CEAB}}\limits^{\frown } } \right)}}\,\approx\,0.5$$
where
 ${\rm L}\left( {\mathop{{CEA}}\limits^{\frown } } \right)$
is the editing length for adding the missing part and
 $${\rm L}\left( {\mathop{{CEAB}}\limits^{\frown } } \right)$$
is the reference structure axial perimeter.
The black circle (ABCEA) represents the manual drawn contour. The grey circle (ABCDA) represents the auto-segmented contour. The shaded area is the missing part that needs to be added.

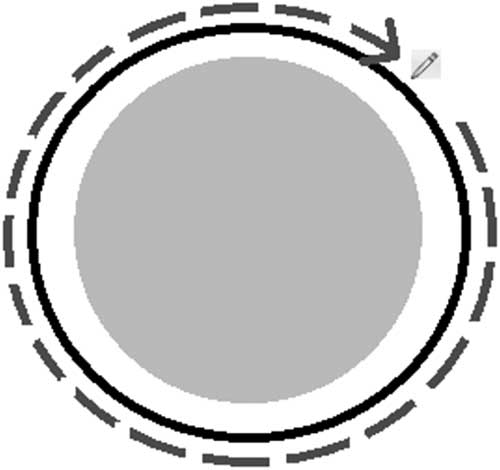
Figure 1 illustrated a scenario that half of the contour needed to be re-drawn but the DSC was high due to a high amount of overlapping. Figure 2 illustrated another scenario how DSC fell short in predicting the amount of editing required. In Figure 2, a high degree of overlapping was found between the two contours. However, no reduction of contouring time would be expected in this case as the whole contour needed to be re-drawn. Whereas the PBI in this case was 0, and thus reflected the amount of editing required.
An example showing that the overlapping index does not relate to the contouring time saved. The grey segment represents the auto-generated contour; the black line represents the true contour.

To validate the proposed index, three observers were invited to study the correlation between the editing time and the similarity indices. Two medical physicists and one radiation therapist with more than 10 years of experience in the field were invited to participate in this study.
Description of image data
A total of 120 patients (60 prostate cancers and 60 NP cancers) who were treated at our radiation therapy centre were randomly selected and recruited for this study. All patients were treated with intensity-modulated radiation therapy technique and underwent computed tomography scans with the same scanning protocol with a slice thickness of 2·5 mm. Among 120 cases, 50 cases of each group were randomly selected to build an atlas library for the atlas-based auto-segmentation (ABAS) programme and the remaining 10 cases were used as validation cases.
Evaluation methods
The observers were asked to contour two structures, namely brain stem and left parotid, without the use of any aids in each of the validation case for the NP group. For the prostate group, the observers were asked to contour bladder and the rectum. The time taken for these manual contouring was regarded as the manual contouring time in Equation (1).
Auto-segmented contours were generated with an ABAS programme MIMVista version 6·0 ABAS software (MIMVista Corp., Cleveland, OH, USA) and the three observers were then asked to edit the contours of these auto-segmented contours. The time taken for editing was regarded as the editing time in Equation (1).
The amount of contouring time saved was calculated by recording the manual contouring time and the editing time from the auto-segmented contour. For each validation case, three structure sets with different degrees of similarity level were auto-segmented by ABAS. To obtain a wide range of similarity, six sets of contours were first generated for each validation case. They were obtained by using atlases of different sizes and different number of cases in the averaging process. The size of the libraries ranged from 1 to 50. The number of cases from the atlases chosen for averaging ranged from 1 to 5. The similarity of the auto-segmented contour was first assessed using DSC. For the odd-numbered validation case, the three contours that ranked 1st, 3rd and 5th were chosen. For the even-numbered validation case, the three contours that ranked 2nd, 4th and 6th were used.
A total of 30 structure sets were generated from the 10 validation cases and each had three auto-segmented contours set with different degrees of similarity levels. The observers were asked to manually edit these auto-segmented structures with the basic contouring tools. There were three sets of contours for each validation case, thus creating a three-cycle task for the observers. Each cycle was composed of editing one contour set for each case. The observers were asked to separate each cycle by at least a week to reduce the memorising effect. The editing time was recorded and the amount of contour time saved was calculated for each auto-segmented contour.
Other assumptions made in the index are:
∙ Observers only delineated the structures in the axial planes.
∙ Segments that had no intersection with the reference contour were removed with negligible time.
∙ The editing segment had to be larger than a certain threshold value for editing. This threshold was taken as 1% of the area of structure in that axial slice. Those segments of less than the threshold value would be neglected. To determine this threshold value, five cases for each group, NP and prostate, were used. For each case, the structure set contained a manually drawn contour and an auto-segmented contour. Boolean operation was performed to find the difference between the manual drawn contour and the auto-segmented contour. The observers were asked to identify the segments that needed to be edited. The auto-segmented contours were modified to include these segments that did not require editing. The difference between this modified auto-segmented contour and the manual drawn contour was the segment that truly required editing. The PBI was calculated with this modified auto-segmented contour to reflect what needed to be edited. Next, the PBI was also calculated with the original auto-segmented contour with different threshold value sets. The correct threshold value would obtain a PBI score close to the PBI value that was calculated from the modified auto-segmented contour.
A computer programme written in C# was used to calculate the proposed index by reading the DICOM RT structure file. The correlation between the proposed index and the contouring time saved was compared with the DSC and the modified normalised average HD. The original average Hausdorff distance (AHD) was a useful tool for evaluating the similarity of two structures. However, it was size-dependent, and AHD alone could not tell the similarity of the two structures. To overcome this problem, the AHD was normalised to the diagonal of the boundary box of the reference contour, which in our case was the manually drawn contour. The normalised AHD was referred to as the MNAHD.
Determine the cut-off value of the three levels of similarity
There was little information in the literature on how the DSC or AHD could be used to describe the general similarity of two contours. The most often quoted value to describe a good overlap in terms of DSC is 0·7.Reference Hwee, Louie and Gaede 8 In this section, we aimed to find the cut-off value of each index to indicate three levels of similarity. The three levels of similarity were defined by the amount of contouring time that could be saved: 50%=excellent, 25%=good, and 0%=fair.
A receiver operating characteristic (ROC) curve was plotted to determine the accuracy of each index, and the Youden index was calculated to determine the optimum cut-off point for each similarity level.
Statistics
Pearson correlation coefficients were calculated between the indices and the amount of time saved. The differences in Pearson correlation between different indices were tested by performing Fisher’s r to z transformation, and a two-tail z-test was performed to determine the significance of the difference between the two Pearson correlations.
Results
The average threshold size of the segment that required editing was 1% of the cross-sectional area. Only segments that were larger than this threshold value were regarded as requiring editing in the subsequent calculation.
Table 1 showed the relationship between the similarity indices and the contouring time saved in the contouring process. Both the DSC and our proposed index had a positive linear relationship with the contouring time saved, while the MNAHD had a negative linear relationship. For rectum and brain stem, both indices showed a similar degree of correlation with the contouring time saved. Pearson’s r showed that both indices had a high positive correlation with the contouring time saved, ranging from 0·75 to 0·82. No significant difference was found between the two indices.
The correlation between the indices and the contouring time saved

* The Pearson correlation of PBI is significantly better than DSC (p<0·05).
# The Pearson correlation of PBI is significantly better than MNHAD (p<0·05).
For bladder and parotids, our proposed index showed a stronger correlation than the DSC. For bladder, a high correlation relationship was found with Pearson’s r ranging from 0·81 to 0·86, whereas the DSC only showed a moderate correlation with Pearson’s r ranging from 0·51 to 0·63. The strength of correlation was found to have a significant difference between the two indices.
There were similar findings for parotids. A higher correlation relationship was found with our proposed index of Pearson’s r ranging from 0·73 to 0·84, while the DSC only had a moderate correlation with Pearson’s r ranging from 0·48 to 0·59. The strength of correlation was found to have a significant difference between the two indices for two of the observers. The difference was insignificant for the remaining observer.
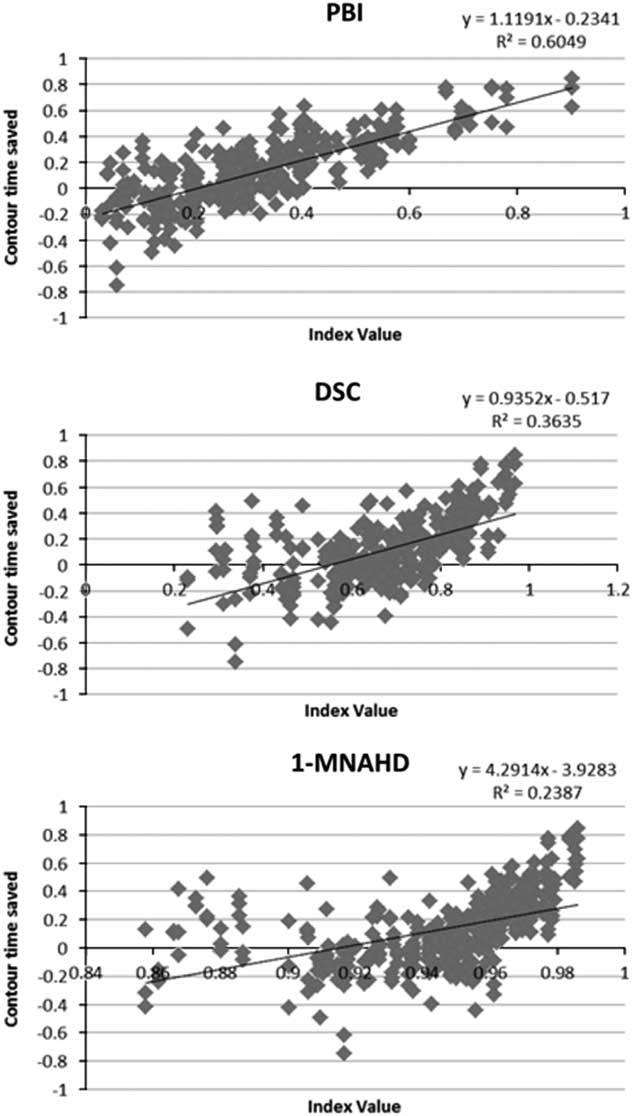
The MNAHD showed a weak correlation than the DSC and PBI for rectum, brain stem and parotid but a stronger correlation in bladder than the DSC. Combining all results from all structures and observers, Pearson’s r between the contouring time saved and the PBI, DSC and MNAHD were 0·78, 0·60 and 0·49, respectively (Figure 3).
Scatter plots of different indices with the amount of contour time saved.

Determining the cut-off value for the similarity indices
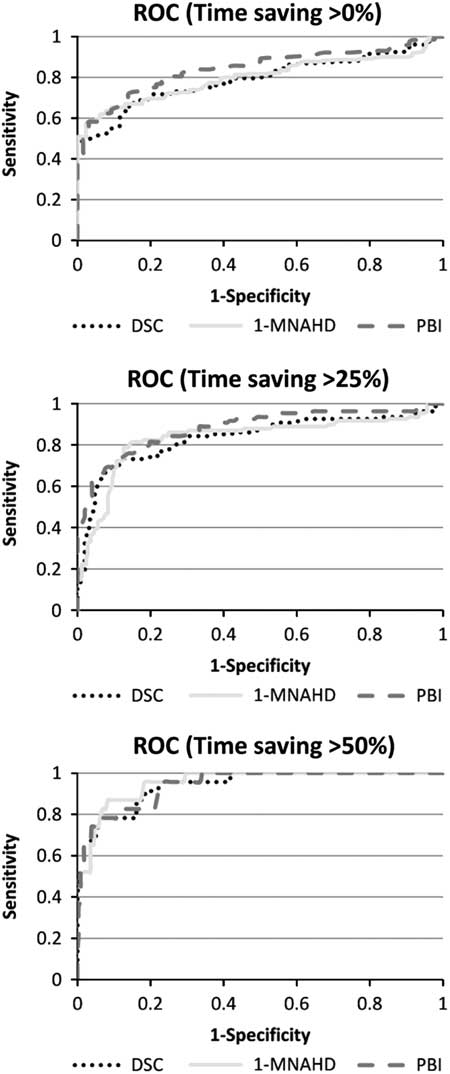
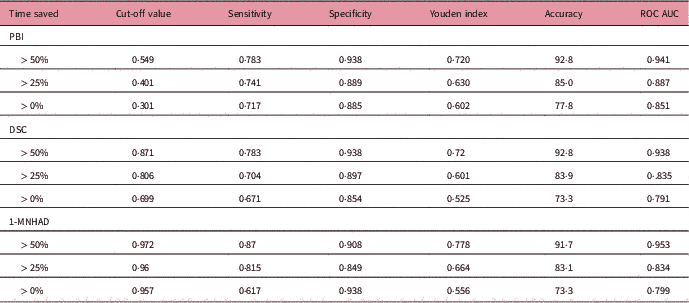
Figure 4 and Table 2 presented the results of the ROC analyses. The ROC curves showed the ability of the indices to predict the contouring time saved at three levels (time saved more than 50, 25 and 0%). The cut-off values for our index were 0·549, 0·501 and 0·301 for the three levels. The areas under the curve (AUC) for our proposed index ranged from 0·851 to 0·941. An AUC value of 0·80–0·90 was defined as having good accuracy and 0·90–1·00 was defined as having excellent accuracy.Reference Huttenlocher, Klanderman and Rucklidge 9
The ROC curve of the different indices on their ability to predict the amount of time saved at three levels.

Accuracy of indices on predicting the contouring time saved

The Youden index ranged from 0·602 to 0·720. The accuracy of our index increased with the amount of contouring time saved. The accuracy at the level (time saved > 0%) was 77·8%. The accuracy increased to 92·8% at the level of time saved more than 50%. The Youden index ranged from 0·525 to 0·72 for the DCS and from 0·556 to 0·778 for the MNAHD.
All three indices showed increased sensitivity and specificity when progressing from the lowest time saved level (>0%) to the highest time saved level (>50%).
Discussion
The proposed index was constructed on the basic assumption that the time saved was directly proportional to the editing length. The value of the proposed index ranged from 0 to 1. A value of 0 indicated no reduction in the contouring length and implied no reduction in the contouring time. It showed that the proposed index did not intercept at 0 but intercepted a negative y-intercept in the graph of the time saved against our index value. This is because the delineation process was not just a simple line-drawing process. Even for a perfect auto-segmented contour, the editing time would not be 0. The observers would spend time to go through the auto-segmented structures and to decide whether or not editing of the contour was required. This contour reviewing time was difficult to predict and was influenced by many factors. The size of the structures, the sharpness of the structure boundary, and the experience of the observers might affect the amount of time required. Our proposed index resembled a perfect observer with no reviewing time. However, the delineation process was very complicated and our proposed index fell short in some situations.
The proposed PBI performed the same or better than the DSC coefficient in the correlation to the editing time saved for all four structures, but some structures had high correlation, whereas the others had only moderate correlation. Bladder had the highest correlation among the four structures. One possible reason was the effect on the reviewing time. The reviewing time was difficult to estimate and contributed to an error in the correlation. The average editing time for a large organ such as bladder was longer, and the reviewing time occupied a small portion in the total editing time. For smaller organs, the average contouring time was shorter and the reviewing time occupied a significant portion thereby lowering the correlation of our index. Our proposed index would not work on small organs with short contouring time.
Because the reviewing time could not be predicted, our index could not directly tell the amount of time that would possibly be saved. However, the proposed index still showed a stronger relationship with the editing time saved than the other indices did. The proposed index could be used as a tool for intra-object comparison to evaluate the performance of different segmentation algorithms on the same object.
Apart from using the proposed index for intra-object comparison, it could also be used to describe the general agreement of the two segmentations. The ROC study was performed and the Youden index for all three time-saving levels was higher than the DSC. The accuracies of all three levels were more than 77%.
The cut-off value for the DSC to determine the time saved of more than 0% was 0·699, which was close to the recommended value described in the literature as having good agreement.Reference Zou, Warfield and Bharatha 11 Our study showed that for a DSC of greater than 0·7, it was likely that there would be a decrease in the contouring time.
The HD was always used in conjunction with other similarity metrics to evaluate the performance of different segmentation algorithms. The present study found that the correlation of MNAHD with the amount of contouring time saved was the lowest among the indices studied. This indicated that the MNAHD should not be used on its own for intra-object comparison. However, this study found that the MNAHD was a good method to describe the general accuracy of the segmentation. The Youden index of the ROC analysis was slightly higher than the DSC at all 3 levels.
Conclusion
The proposed index showed a stronger relationship to the amount of time saved in editing the auto-segmented contours. It provided a quick and simple method to evaluate the performance of the segmentation algorithm or software and could be used as a first-line evaluation tool for the auto-segmentation algorithm. However, similar to other indices, PBI had its own inadequacy and had to be used in conjunction with other similarity indices for a complete performance evaluation of any segmentation algorithm or software.
Acknowledgement
None
Conflict of interest
There is no conflict of interest with regard to this manuscript.