


1. Introduction
Equity-linked contracts that combine life contingent benefits with financial benefits are popular in many insurance markets. There is a huge demand for contracts that combine capital protection with the potential for high returns if the market performs well. Competition leads companies to innovate and propose new and complex products. These new contracts have non systematic risk (mortality risk) that insurers are used to dealing with by pooling as well as systematic risks from financial exposures that are often hedged in the capital markets. It is challenging for insurers to hedge these systemic risks in normal times and even more so in times of market turbulence.
The pricing, valuation and risk management of insurance contracts are also influenced by regulatory requirements. New regulations and new accounting standards have been recently introduced by the International Accounting Standards Board (IASB) in 2005 in Europe and by the Financial Accounting Standards Board (FASB) in the USA. For example, in Europe insurers are required to evaluate these types of products at their market value in their balance sheets because of the new accounting standards (International Financial Reporting Standards (IFRS)) and under the requirements of Solvency II (see Jørgensen, Reference Jørgensen2004; Ballotta et al., Reference Ballotta, Haberman and Wang2005). The USA, Australia and several Asian countries are also adopting or about to adopt this “fair value” or “mark-to-market” reporting system (Hansen, Reference Hansen2004). For the current situation in the USA, see also Blanchard (Reference Blanchard2008).
These regulatory changes have sparked an important debate about the effects of “marking to market”. Plantin et al. (Reference Plantin, Sapra and Shin2004) discuss the main arguments. First, such a change can be viewed in a positive light because “the market value of a liability is more relevant than historical cost since it reflects the amount at which that liability could be incurred or settled in a current transaction between willing parties.” However it is often countered that market values cannot be obtained if there is no external market where the corresponding instruments are traded as is the case with some types of insurance liabilities. Some observers contend that evaluating the balance sheet at its market value dramatically increases the volatility of the annual results of insurance companies and runs contrary to the smooth returns policyholders and shareholders generally prefer. Moreover these new reporting standards might induce excessive volatility in the markets. Further details of the various arguments can be found in Plantin et al. (Reference Plantin, Sapra and Shin2004).
The current economic and regulatory environment in the insurance industry poses new challenges. There is an important need for robust methods to hedge and manage the risk associated with new insurance contracts that combine complicated equity participation with basic guarantees. Moreover, as we will see shortly, these contracts have embedded options that make them very sensitive to changes in market conditions, in particular to the market volatility.
This paper proposes the establishment of a natural hedge to reduce the volatility risk of an insurance company's liabilities. We show how to stabilize the market value of the insurer's aggregate liabilities by building an appropriate portfolio of policies. More specifically by combining contracts with different payoffs, the insurer can achieve immunization against small changes in the market volatility. This natural hedge is meant to complement normal dynamic hedging rather than replace it. The idea is similar to the hedging of longevity risk in life insurance contracts which combines contracts with opposite sensitivities to mortality risk. Natural hedges of mortality risk have been investigated by Lin & Cox (Reference Lin and Cox2007) and Piggott et al. (Reference Piggott, Valdez and Detzel2005). However, the natural hedging of financial risk appears to be less widely studied.
Most of the actuarial papers on Equity Indexed Annuities (EIAs) discuss the pricing and/or the hedging of some specific type of contracts. (For example, Boyle & Schwartz, Reference Boyle and Schwartz1977; Brennan & Schwartz, Reference Brennan and Schwartz1976; Ballotta, Reference Ballotta2005; Barbarin & Devolder, Reference Barbarin and Devolder2005; Bacinello, Reference Bacinello2001, Reference Bacinello2003a, Reference Bacinello2003b, Reference Bacinello2005; Boyle & Hardy, Reference Grosen and Jørgensen1997, Reference Boyle and Hardy2003; Grosen & Jørgensen, Reference Grosen and Jørgensen1997, Reference Grosen and Jørgensen2000, Reference Grosen and Jørgensen2002; Miltersen and Persson, Reference Miltersen and Persson2003; Tanskanen & Lukkarinen, Reference Tanskanen and Lukkarinen2003; Nielsen & Sandmann, Reference Nielsen and Sandmann1995; Bernard et al., Reference Bernard, Le Courtois and Quittard-Pinon2005, Reference Bernard, Le Courtois and Quittard-Pinon2006). However none of these papers investigates the interaction between different designs from the perspective of the insurer. In practice, insurers do not just sell one type of contract but sell a portfolio of different contract designs.
This paper proposes a general approach to show how the choice of different designs can reduce risk. We illustrate the approach with two specific contracts, a simple European contract and a highly path-dependent contract. Specifically we consider a standard equity linked contract and a so-called Monthly Sum Cap EIA. The method developed here could be extended to a wider range of EIA designs and could also be used to develop a natural hedge for other financial risks such as, for instance: correlation risk, interest rate risk and gamma risk.
The layout of the rest of this paper is as follows. Section 2 describes the Equity Indexed Annuities market in North America and reviews some popular designs that are currently offered. Section 3 introduces the two contracts that we will use in constructing the natural hedge. For each design, we compute the prices, and the sensitivity to changes in the volatility. Section 4 explains how insurers can benefit from a natural hedge by combining standard EIAs (also sometimes called participating policies) with more complex designs such as the popular Monthly Sum Cap Contracts. Section 5 concludes.
2. The Equity Linked Annuity Market
In this section, we first define an equity linked annuity and then provide an overview of the North American market.
In a typical equity linked annuity, the consumer pays an initial amount to the insurance company. At maturity the payoff to the consumer is based on the performance of some designated reference index, for example, a stock market index. The contract participates in the gains (if any) in the reference portfolio during this period. The detailed arrangements of how this participation is calculated vary, but invariably there is some limit. For example, the limit may be expressed in terms of a participation rate in the return of the underlying index, say 60% of the return on the portfolio. Alternatively, the return on the reference portfolio can be capped where the cap is imposed periodically or globally. In addition, these contracts generally provide a floor of protection if the market does poorly. For example, the guaranteed floor may be a percentage of the initial investment or it may consist of the initial investment rolled up at some low interest rate such as 1% or 2% per year.
We now describe more specifically the two main different types of equity linked products sold by insurance companies. These are variable annuities and equity indexed annuities.
Variable annuities
A variable annuity is a composite contract containing both investment and insurance features. It is designed to produce retirement income so there is typically an accumulation phase, when funds are built up, and a payout phase where payments are made to the investor. At inception, the initial investment or premiumFootnote 1 is placed in a separate account. Typically, the investor can allocate their investments across different sub-accounts. These sub-accounts are like mutual funds. Their assets include stocks, bonds, money market instruments, or some combination of the three. The performance of the separate account depends directly on the portfolios in which the funds are invested. Thus, gains and losses on the underlying assets flow though to the policyholder's account. These investments are directly exposed to market risk although some variable annuities have guarantees to protect the investor in case of poor market performance.
Variable annuities provide life insurance benefits should the policyholder die during the accumulation phase. Furthermore, the policyholder receives tax deferral on the investment earnings. Variable annuities offer several contract choices and optional additional extras that make the product very complex. In addition, various types of embedded options or riders can be added (for a fee) to the basic variable structure (for example, the Guaranteed Minimum Income Benefit, the Guaranteed Minimum Accumulation Benefit or the Guaranteed Minimum Withdrawal Benefit). See for instance Hardy (Reference Hardy2003).
Equity indexed annuities
Equity Indexed Annuities (EIA) are customized investment products sold by insurance companies to provide savings and insurance benefits. EIAs differ from variable annuities in some significant ways. The investment return under an EIA is guaranteed to not fall below a certain minimum level during the accumulation phase whereas this need not be the case for a variable annuity. This minimum guarantee means that EIAs qualify as insurance products and can be regarded as fixed annuities rather than securities for certain regulatory purposes. Because of this distinction EIAs are exempted from Securities Exchange Commission (SEC) regulationFootnote 2 and fall under state insurance regulation.
EIA premiums form part of the insurer's general account and are not invested in a separate identifiable account as in the case of a variable annuity. Hence the policyholder's benefits and guarantees under an EIA are liabilities of the insurer's general account.
An EIA provides a fixed return plus the possibility of an additional return based on the performance of the underlying reference index. In the USA, the S&P 500 index is often used as the reference index. There are different ways of computing the crediting rate for different types of contract. There is normally a guarantee that is financed with some limitation on the equity returns such as a cap on benefits or a curtailed rate of participation.
We now describe some popular ways of computing the crediting rate:
• The point-to-point design. In this case, the crediting rate is linked to the realized rate of return on the underlying index over a specified period, say one year. This return is often capped at some level; for example, the yearly cap might be 7%.
• The Asian type design. In this design, one first computes the average of the returns on the index over the year based on the monthly returns during the year. This averaged return can also be capped to compute the credited rate.
• Monthly Sum Cap design. In this case, the credited rate is based on the sum of the monthly-capped rates. This product is a typical example of globally-floored locally-capped contract since it is monthly-capped and usually has a global guarantee over the life of the contractFootnote 3.
The size of the EIAs market has expanded significantly in recent years. Palmer (Reference Palmer2006) explains that EIAs were first introduced in 1995 and sales in 2006 were about $25 billion. The variable annuity market is much larger and it is estimated that the total VA industry net assets were $1.41 trillion as of June 30, 2008 (see Milliman research report by Sun et al., Reference Sun, Mungan, Corrigan and Finkelstein2009 and Koco, Reference Koco2007).
3. Two Types of Equity Indexed Annuities
We now discuss the two different types of Equity Indexed Annuities that will be used to construct a natural hedge. Both contracts have a European payoff at a fixedFootnote 4 future maturity T. The payoff is linked to an underlying index that is denoted by S throughout the paper. As mentioned in the previous section, there is a wide variety of possible designs. We restrict ourselves to the analysis of financial guarantees and ignore the mortality benefits. It is possible to extend the study to the case when mortality is diversifiable and we briefly explain how to do this in section 4.4.
Hence we study two popular contracts in North America: standard participating EIAs and Monthly Sum Caps. We also discuss the introduction of an annual guarantee (local floor) in this type of contract since it is very often included in practice. This annual guarantee is sometimes called “reset annual option” or “annual step-up option” in North America. In Europe it is often called a cliquet optionFootnote 5. However cliquet options are defined differently by Wilmott (Reference Wilmott2002). In the latter paper, “cliquet options” are similar to locally-capped contracts such as Monthly Sum Caps.
In both contracts, the initial investment (net of fees, and commissions) is assumed to be M and the minimum guaranteed rate g. Thus the payoff at maturity T will always be at least Me gT. Note that it is straightforward to extend the study to the case when there is a fixed percentage fee.
For simplicity, we assume the financial market is arbitrage-free, frictionless and complete. We assume the risk-free rate is constant and equal to r, the constant dividend yield on the index is δ and the index volatility is denoted by σ. There exists a unique risk neutral probability Q, under which the underlying index is assumed to follow
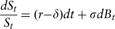
where B is a standard Brownian motion under Q.
3.1 Standard EIA
We now describe a standard EIA with a participating rate k. The maturity payoff, at time T, can be written as:
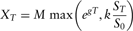
where k is called the participating coefficient. This payoff can be rewritten as
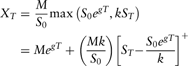
This means the maturity payoff XT can be decomposed into a zero coupon bond with face value Me gT and  standard call options with maturity T and strike price
 . The time zero market value of XT is given by

A closed-form formula for this price as well as formulas for the price sensitivities (GreeksFootnote 6) exist and are straightforward to obtain using the Black Scholes formula for the call option price and the corresponding formula for the Greeks (see for example Hull, Reference Hull2003, Chapter 14: “the Greek letters”).
3.2 Monthly Sum Cap
A significant number of EIAs have a periodically-capped payoff. We now describe a monthly-capped contract with a cap level equal to c on each monthly return. Assume the minimum guaranteed rate at maturity of the product is g. Let t 0 = 0,  . The payoff ZT under this design can be expressed as:

In the sequel, this contract is referred to as the Monthly Sum Cap. It is a more complex contract since the payoff cannot be easily replicated with standard options.
Example of a Monthly Sum Cap
As an example, consider a Monthly Sum Cap where the cap rate c is 3% per month and a maturity T of 1 year. Assume the global floor g = 0. Table 1 shows the computation of the investor's yearly return for two different years: 2003 and 2008. The numbers in the second column are the raw monthly returns on the S&P 500 for 2003 and those in the fourth column the corresponding raw returns for 2008. These returns do not include dividends as is the convention with this type of contract.
Computation of Returns for a Monthly Sum Cap (in percent). The reference index in this case is the S&P 500 for calendar years 2003 and 2008

First we discuss the computations for 2003. Notice that the monthly return on the index for April 2003 was 8.1% but that, because of the cap, the return used in the computation is the maximum rate of 3%. In contrast, when the monthly return is negative, as was the case for January 2003 (−2.74%) the entire negative return is used in computing the investor's return. The total of the adjusted returns for 2003 is 12.46%. This is the return credited to the investor under the contract. We can see that if there are large negative returns (exceeding 3% per month) over the year, they are given more weight than corresponding large positive returns since the latter are capped. Hence, if the volatility is high, this tends to reduce the credited rate under this type of contract design. The year 2003 delivered relatively good returns under this monthly sum cap contract since the volatility of the S&P was very low and there were no large negative monthly returns over the year.
In contrast, the year 2008 delivered very poor returns for the capped contract. During this year equity returns were highly volatile and the S&P experienced very significant losses in January (−6.12%), June (−8.60%), September (−9.08%), October (−16.94%) and November (−7.48%). The sum of monthly capped returns for 2008 is −47%. Hence in 2008, only the minimum guaranteed rate would have been credited.
Pricing of a Monthly Sum Cap
We wish to emphasize that in pricing the Monthly Sum Caps we make some very strong simplifying assumptions. These contracts are notoriously difficult to hedge (see Wilmott, Reference Wilmott2002). Over time as the value of the reference portfolio changes the gamma of the contract can change sign. We have not taken this into account. In addition the market data shows that there is a negative relation between the return and volatility which is not captured in our simple lognormal model. To capture this negative relation, the two factor Heston model could be used. In this paper we have just used a simple Black Scholes model for pricing and not taken these important factors into account.
We now explain briefly the method used to price these contracts in the context of a specific example. Assume M is the initial investment net of commissions and fees. We suppose that the index volatility σ is initially equal to 20%, the interest rate is constant and equal to r = 5% and that there is a continuous dividend yield δ = 2%. These parameters correspond to our benchmark market assumptions. The prices of these contracts are very sensitive to the volatility assumed in the calculation as will be shown shortly.
Under our assumptions, Monthly Sum Cap contracts can be priced using Fourier analysis or Monte Carlo techniques. We choose to evaluate the contracts via Fast Fourier Transforms since FFT methods are more efficient than Monte Carlo methods in this case. We provide the details in Appendix B and we use numerical differentiation to estimate the Greeks since the pricing is very smooth with respect to each parameter. In this case we could extend the approach by FFT to more general distributions for the underlying index since we only require a discrete approximation of the distribution (see (8) in Appendix B). For ease of exposition, we work in the Black and Scholes framework.
3.3 Comparison of the two designs and their sensitivity to volatility
The construction of the natural hedge hinges on the differing sensitivities of the prices of the standard EIA and the Monthly Sum Cap to the volatility. We compare these sensitivities for a range of parameter values.
We assume the initial investment in each contracts is M = $100. We assume the participating coefficient of the standard EIA, k (in equation (1)) is fairly determined. In other words, the market value of the contractFootnote 7 is equal to the initial investment M. We also suppose that the local cap level c given in (3) is also determined such that the fair value of the locally-capped contract is equal to 100.
Pricing, sensitivity to volatility
Figure 1 shows how the prices of the standard EIA and the Monthly Sum Cap vary with changes in the volatility. This graph illustrates an interesting property of the capped contracts. Their values at first increase with volatility and then decline as the volatility increases. In contrast, the market value of a standard EIA is increasing with the volatility parameter and with the initial underlying stock value. This is not surprising since standard EIAs can be expressed in terms of call options. Thus, the delta and the vega are positive as well as the gamma due to the convexity of a call option.
Sensitivity of EIA prices to the volatility parameter σ.
Sensitivity of the prices of standard participating policies and Monthly Sum Caps to volatility. Parameters are r = 5%, δ = 2%, g = 1% p.a. The volatility σ varies between 5% and 40%. The two contracts in question have the same maturity of T = 1 year. The participation is set at k = 89.6% and the monthly cap is equal to c = 5.4%. Assuming σ = 20%, the two contracts are fairly priced at $100

The monthly capped contract has more complex behaviour. Figure 1 shows that the monthly sum cap is very sensitive to volatility. When the volatility parameter is larger than 12%, then we observe that the higher the volatility, the less valuable the Monthly Sum Cap contract is. For small volatilities, the opposite holds (see Figure 1). The non monotonicity is quite unusual for an option contract (since call and put options are both increasing functions of the volatility of the underlying). The intuition is as follows. Recall that the monthly loss is not floored. With a low volatility, this monthly loss will be less than it would be for high levels of volatility. To give the intuition consider a Monthly Sum Cap with a one month horizon. The payoff in this case can be decomposed into a portfolio of a bond, a long position in a call option and a short position in another call option. Hence the price is thus the difference of two increasing functions of the volatility and this difference need not be increasing in the volatility. More details can be found in Bernard et al. (Reference Bernard, Boyle and Gornall2011).
3.4 Cliquet option, annual guarantee or local floor
The two types of contracts presented above normally have contract terms that last several years (often 7 years or longer) but can include an annual guarantee (in other words a cliquet option or a reset option).
With this annual guarantee, at the end of each year the value of the policyholder's account increases with the maximum of the minimum annual guaranteed rate and the credited equity-based rate. Any benefits earned at the previous period are maintained until the maturity of the contract. This type of contract can thus be defined recursively. We provide the formal description of this feature and explain how to price it for both types of contracts in Appendix C.
Note that in the presence of the cliquet benefit, if we keep the same parameters (guaranteed rate g, participating coefficient k and local cap c) and do not include the impact of the guarantee, the price of the contract is no longer fair. The annual guarantee significantly increases the value of the Monthly Sum Cap by offering a “local floor”. However, it can decrease the value of the participating policy.
Using the parameters of Figure 2, the fair participating rate such that the standard EIA with no annual guarantee (payoff (1)) has a market value equal to $100 is k = 92.6%. This participation rate is applied to the return over the 5 years of the life of the contract. In the presence of an annual cliquet option, the crediting rate is now computed per annum and thus the policyholder gets 92.6% of the annual return if this exceeds the minimum guaranteed annual return. The following year, he will get 92.6% of the new return. Intuitively, 92.6% of 92.6% is not as valuable as computing 92.6% of the return over 2 consecutive years.
Cost of an Annual Guarantee.The horizontal axis represents the minimum annual guaranteed rate η. We assume the contracts previously described are fairly priced at $100 without a cliquet guarantee. The maturity of the two contracts is T = 5 years. Parameter values are r = 5%, δ = 2%, σ = 20%. The minimum guaranteed rate at maturity is g = 2% p.a.. The fair participating coefficient k = 92.6%. The fair monthly cap level is 12.1%

Let η be the annual minimum guaranteed rate (annual rate continuously compounded). Figure 2 illustrates this fact and estimates the cost of the annual guarantee with respect to the level of the guaranteed annual rate. This cost could be significant for the Monthly Sum Cap (up to half of the market value of the contract without an annual guarantee when η = g = 2%). Figure 2 shows that the cost of the annual guarantee for the Monthly Sum Cap varies roughly between 5 and 50 for a policy that has an initial market value of 100. In practice, the annual guaranteed rate is often close to zero and could even be negative (for example when only a percentage of the initial investment is guaranteed). Indeed the guarantee at maturity is sometimes defined as a percentage of the initial investment, say 95%M Footnote 8. Solving for η such that Me η = 0.95M will provide a negative value for η (η = −0.05129).
3.4.1 Volatility sensitivity for contracts with cliquets
We now analyze the sensitivity of the prices of both contracts to the volatility parameter with and without the annual guarantee. We assume the participating coefficient is k and the monthly cap level c are calculated such that both contracts are fairly priced when the volatility is σ = 20%. We show how the price of each contract depends on the volatility parameter σ in Figure 3.
Sensitivity of EIA prices to the volatility parameter σ.
Sensitivity of the prices of Participating EIAs and Monthly Sum Caps to volatility. Parameters are r = 5%, δ = 2%, g = 2% (annual interest rate continuously compounded). The volatility σ varies between 5% and 40%. The two contracts under study have a maturity of T = 5 years. In Panel A, there is no annual guarantee, the fair participation k = 92.6%, the monthly cap level c = 12.1%. In Panel B, we assume an annual minimum guaranteed rate equal to 0%, the fair participation k = 90.3%, the monthly cap level c = 5.6%. In panel A and in Panel B, assuming σ = 0.2, the contracts are fairly priced at $100 as can be seen on both graphs.

It is interesting to see that including the annual guarantee increases the sensitivity to volatility of standard EIAs. Comparing the scale of Panel A and Panel B of Figure 3, one can observe that the inclusion of the annual guarantee increases the sensitivity to changes in the volatility parameter. In particular it can add value to the Monthly Sum Cap. From Panel A we see that the market value of a Monthly Sum Cap contract over 5 years is roughly bounded above by 100. However, after adding the annual cliquet, the value of the contract may increase to 105 as can be seen from Panel B of Figure 3.
4. Natural Hedge for Insurers
This section describes how we can combine portfolios of these two types of equity linked contracts to reduce exposure to changes in the volatility. The essence of the idea can be seen from Figures 1 and 3. We see that over certain ranges of the volatility the vegas of the two contracts have opposite signs. Hence it should be possible to have an appropriate mix of these two books of business that minimizes the dependence of the combined portfolio to volatility risk. We now formalize this intuition.
We first ignore the annual guaranteed cliquet options and focus our analysis on the two European designs described in Section 3.1 and 3.2. We will then discuss the volatility risk associated with cliquet guarantees.
4.1 Reducing sensitivity to the volatility parameter
We have shown that our two types of contract design have different exposures to the volatility parameter. We will now use this fact. First we introduce some more notation. Let X 1 be the payoff of a participating standard EIA and X 2 be the payoff of a Monthly Sum Cap based on the same index S. The current prices of these contracts, assuming the same index and the same time to maturity T are
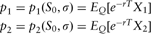
Let n be the total numberFootnote 9 of contracts the insurer sells, where n 1 is the number of contracts of the first type and (n−n 1) is the number of contracts of the second type. There are different objectives we could impose. A simple one is to select the number of contracts of each type to minimize the sensitivity of the portfolio to the level of the implied volatility over some range. For now, we assume that the implied volatility can vary within the range [σlow, σhigh].
Thus the insurer's objective is to select n 1 (and hence n−n 1) such that

is minimized. We denote by  the optimal number of contracts of type X 1 that minimizes
 .
This optimization will enable an insurer to set up a natural hedge against uncertainty in the volatility estimation. The idea is that the insurer wishes to minimize the sensitivity of the aggregate portfolio of policies to the volatility assumption. In other words, the insurer is interested in stabilizing the market value of the liabilities and in reducing the volatility of its balance sheet if it is required to report the market value of its liabilities. This procedure can also cushion the result against an error in the estimation of the volatility. Therefore minimizing  could assist in controlling model risk and estimation risk.
Figure 4 summarizes the results of this exercise for some specimen parameter values. For n = 100, we plot the total market value of n 1 EIAs and (100−n 1) Monthly Sum Cap contracts for n 1 ranging from zero to one hundred. The initial value of the volatility is 20%. The different lines on the graph correspond to different volatility ranges parametrized by ε where

Parameters are r = 5%, δ = 2%, g = 1%p.a., σ = 0.2, n = 100. The number of EIAs sold, n 1, lies between 0 and 100 and can be directly interpreted as the percentage of EIAs in the portfolio of policies of the insurer. The maturity is set to T = 1 year with a monthly cap level equal to 5.4%. The participation rate k = 89.6% and both contracts have a fair value equal to $100

Thus the initial volatility σ 0 is assumed to be twenty percent, and ε measures the uncertainty on the volatility parameter σ 0.
Figure 4 illustrates the concept of natural hedge. It corresponds to a portfolio of one-year-policies of the two types of contract. We assume there is no cliquet benefit. The respective market value of each type of contract responds to volatilty changes as shown in Figure 1. From Figure 1, it is clear that for σ∈(15%, 25%), the sensitivity to the volatility (vega) of the standard EIA remains approximately constant and is positive while the vega of the Monthly Sum Cap remains approximately constant with a negative slope. The ratio between these two slopes is close to one third, which explains why there is an optimal percentage close to one third of standard EIAs (28%). This percentage does not change with respect to ε when the vega of each contract is constant over (σ 0−ε, σ 0 + ε).
Figure 4 shows that the function S(n 1) defined by (4) is minimized when the number of EIAs sold is equal to  for different values of ε. There are two interesting features. First there exists an optimal proportion strictly between (0,100%) such that the sensitivity of the portfolio to volatility changes is minimized. In other words, the company can benefit from this diversification. Second the result does not depend on ε for this range of parameter. It is important to stress that not all parameters choices will give a similar result, and the pattern observed in Figure 4 will not always happen. These two properties stem from the particular choice of the parameters. To guarantee that the company can benefit by selling two different designs, the company has to make sure that the prices of the two different types of contracts move in opposite directions when the volatility parameter changes. In other words one has a positive vega whereas the other one has a negative vega.
For example if the initial estimated volatility σ 0 = 5%, and all other parameters are as in Figure 1, and the company wants to minimize the vega of its portfolio, it will sell only standard EIAs, and in this case  . There is no possible natural hedge based on diversification since both contracts have a positive vega. The standard EIA has a smaller vega than the Monthly Sum Cap, therefore if the objective is to minimize the total vega, the company will sell only the standard EIAs. It is then clear that if the company can choose the parameters of the contracts it sells, it should choose them in such a way that a natural hedge is possible.
From Figure 4, for each value of ε, the optimal percentage of EIAs is roughly 28%. This shows that this measure is robust for this example and these parameter values. This occurs because the parameters of the two types of contract design are such that when the volatility parameter is slightly higher or smaller than σ 0, the sensitivity to volatility of each contract remain approximately constant (the vegas are approximately constant and in opposite directions). This is the type of situation where a company can successfully implement a natural hedge. The idea is to choose the designs and parameters of both contracts such that this property holds.
If the vegas are not approximately constant over a small range of volatilities around σ 0, the optimal number  depends on the parameter ε and the result is less robust.
4.2 Sensitivity to model parameters
The optimization in the previous paragraph depends on our assumptions on parameters. Note the minimization of  corresponds to minimizing the portfolio sensitivity to the volatility parameter σ by altering n 1. This minimum
 exists and is unique when the vegas of the two contracts used for natural hedge are approximately constant over a small range of volatilities. To implement the natural hedge, these two vegas are of opposite signs.
In case the vegas are not constant over the range of volatilities considered in the optimization, then we cannot guarantee the uniqueness of the optimal proportion and each case has to be examined.
The robustness of the optimal proportion depends critically on the sensitivity of the vega to market conditions. For example, the vega of the equity indexed annuity (2) is equal to

(See Chapter 14 of Hull, Reference Hull2003).
It is also of interest to examine the sensitivity of the optimal solution to k. Table 2 shows the sensitivity of the optimal natural hedge to the participating parameter k. For our parameter ranges the solution is reasonably stable with respect to variations in k.
Parameters are r = 5%, δ = 2%, g = 1%p.a., σ = 0.2, n = 100, ε = 5%. We report the optimal number  as a function of the participating coefficient k. The maturity is set to T = 1 year with a monthly cap level equal to 5.4% (such that the monthly sum cap has initial value $100). The participation rate varies from 0.75 to 0.9 and the initial value of the participating policy is not necessary $100. The optimization is done over integer numbers (the case k = 0.896 corresponds to Figure 4)

Since for this example, the vega is also fairly stable with respect to σ, we expect a rather stable optimal proportion  as a function of the participating coefficient k. Note also that the vega is an increasing function of the participating coefficient k. Therefore we will need fewer contracts of type 1 to compensate for the negative vega of the monthly sum cap contract.
4.3 Limits and applications to a dynamic setting
The natural hedge presented in this paper is based on the instantaneous sensitivities of market values to changes in the volatility parameter. Insurance contracts are typically long-term contracts, and this natural hedge is only valid at contract inception. For hedging purposes, this approach could be implemented in a dynamic setting in two ways.
First it is possible at least in theory to reflect changes in market conditions by altering the composition of the new business in a smart way. The optimal proportion between contract 1 and contract 2 will change over time. To stabilize the market values of liabilities and their sensitivity to volatility, the insurer could update the optimal proportion of each contract and choose new designs to issue to offset as much as possible sensitivity of the current portfolio of policies of the company to changes in the financial market. In practice this might be difficult.
Second this natural hedge should not be viewed as replacing the ongoing risk management of the embedded guarantees but rather as complementing it. For example the insurer may also be dynamically hedging some of its guarantees through a delta hedging or a delta gamma hedging program. It is intuitive that by constructing a portfolio that has little or no exposure to a given risk factor the need to hedge against movements in this risk factor is reduced. It would appear logical for insurers to integrate their natural hedging program with their ongoing dynamic hedging strategy. For example, if the risk factors of interest are delta, gamma and vega then the combined program can be designed to minimize these risks. The specifics and details will vary from case to case.
4.4 Including mortality risk
Throughout the paper, we have ignored mortality risk and lapse risk. This means that the maturity date of the contracts under study is fixed and all contracts are then European. In the presence of mortality risk, the maturity date may be linked to the time of death or the survival status of the policyholder.
Let us illustrate the case when the payoff is paid at the end of year of death if death occurs in the next 10 years: the maturity T of the contract is now random. We assume that mortality is fully diversifiable (no longevity risk and mortality is not stochastic). In this case the actual deaths corresponding to a large number N of identical policies issued by the company can be estimated from life tables. In this case instead of hedging one contract with random maturity, the insurer will sell a lot of identical policies and anticipate the expected number of contracts that terminate every year.
We assume the probability distribution of the time of death is given. Recall that qx +t denotes the probability that a policyholder of age x + t dies before age x + t + 1, with t = 0,…, T−1, and that the survival probabilities are given by px + t=1−qx + t. Thus the contract's market value at time 0 for an individual of age x, denoted V 0, is simply given by
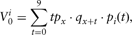
where  is the probability that an individual of age x survives at least t years and pi(t) is given by (4) and denotes the market value of the respective contracts with a fixed maturity t. It is the same idea as in Bernard & Lemieux (Reference Bernard and Lemieux2008) who show how to incorporate mortality risk into the pricing of life insurance contracts with index linked minimum guaranteed death benefits without explicitly simulating mortality.
Observe that the market value of the contract given by formula (5) is now a linear combination of contracts with fixed maturities. The insurer collects a large number N of premiums. Then there are approximately NTpx contracts that will mature at time T, and Ntpx·qx +t that will terminate at time t + 1 for any time  . Since the market value is a linear combination of European contracts, the Greeks can be easily derived from the Greeks of the European contracts.
5. Conclusions and Limitations
This paper shows how insurers can immunize their liabilities against volatility uncertainty by diversifying judiciously across different product designs. We showed in a simple case how to determine the optimal proportion of each contract type. We show that this natural hedge is robust to the estimation of the volatility parameter as well as to small changes in the market volatility. The balance sheet becomes more stable even though it is evaluated at market value.
In practice to develop a natural hedge for equity indexed annuities as described in this paper one needs two different product designs with opposite sensitivity to a given parameter. By appropriately combining these two contracts it is possible to reduce the sensitivity to this given parameter. To achieve this goal insurers should sell contracts with different types of exposures to various risks. Of course there may be difficulties in doing this in practice. For example, within a certain company the divisions responsible for different product lines may have considerable autonomy. In addition there may be legal or jurisdictional impediments. During certain periods, particular products become very popular in the market place and it may be difficult for an insurer to persuade its sales force to sell the required quantities of the less popular contracts.
This paper described a very elementary approach that could be used to combine contracts to better manage volatility risk. Many extensions are possible. For instance we could consider portfolios of books of business from this perspective to hedge out other risk sensitivities. The current analysis is carried out under the Black and Scholes assumptions. A natural extension would be to investigate a stochastic volatility model. Another extension would be to explore how to combine the natural hedge with a dynamic hedging strategy to achieve better results. The financial crisis proved very challenging (Sun et al., Reference Sun, Mungan, Corrigan and Finkelstein2009) for conventional hedging programs and there is a need for more imaginative approaches. The authors hope the proposed method will be of interest in this connection.
Acknowledgments
Both authors acknowledge support from the Natural Sciences and Engineering Research Council of Canada and from WatRISQ. P. Boyle also acknowledges support from the Social Sciences and Humanities Research Council of Canada and C. Bernard from Tata Consulting Services.
A. Pricing the Two Contracts
Using the Girsanov theorem, we can express the underlying index dynamics under the risk neutral probability Q as follows:
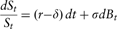
where B is a standard Brownian motion under Q. Standard calculations give the following underlying price:

The no-arbitrage prices at the initial time 0 of a payoff X is obtained by taking the expectation under the risk neutral probability of the discounted payoff X:

This expectation can be computed using Monte Carlo techniques. In the case when the contract includes cliquet benefit, there is no obvious alternative to the Monte Carlo techniques. In the absence of cliquet benefit, participating policies can be evaluated in closed-form as mentioned in section 3.1 and Monthly Sum Caps can be computed by Fast Fourier analysis as it is explained in Appendix B.
B. Accurate FFT Pricing of Monthly Sum Caps
Recall that the payoff a Monthly Sum Cap is given by equation 3 in the text:

We can rewrite it as follows:

We can obtain a discrete approximation of the distribution of ZT. Let us define
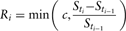
We first obtain the distribution of the sum 

and then the one of ZT. Ri takes its value between [−1, c], and the sum  lies in [−n, nc].
The idea is to get the discrete distribution of Ri, compute the Fast Fourier Transform of the distribution and then the distribution of the sum is obtained by taking the power n of the FFT of Ri since the random variables Ri are i.i.d.
The steps of this method are summarized as follows:
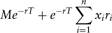
1. We start by discretizing the interval [−n, nc] of possible values for the sum. The number of points is a power of 2 in order to apply Fast Fourier techniques. xi = −n + i × dx where i = 0.2k−1 and dx is such that
 .
2. Discretize the distribution of R 1. Denote by
,(8)where and and α is chosen such that the sum of all probabilities is equal to 1.3. Compute the Fast Fourier Transform of the discrete distribution of Ri, denoted by ΦR (see for instance Carr & Madan, Reference Carr and Madan1999).
4. Calculate
where ΦR denotes the characteristic function of one of the random variable Ri defined by (6) (since they all have the same distribution) and ΦS is the characteristic function of defined by (7) and which is the sum of i.i.d. random variables distributed as R 1.5. Invert using by Fast Fourier Transform inversion to get the discrete distribution of
. Get:6. Obtain
7. The no-arbitrage price of the Monthly Sum Cap contract is then obtained by the following formula:
 .
 ,

 and
 and α is chosen such that the sum of all probabilities is equal to 1.
 where ΦR denotes the characteristic function of one of the random variable Ri defined by (6) (since they all have the same distribution) and ΦS is the characteristic function of
 defined by (7) and which is the sum of i.i.d. random variables distributed as R 1.
 . Get:


C. Description and Pricing of Cliquet Feature
This Appendix describes the cliquet feature and explains how to price it. To stay as general as possible, we introduce a time period Δ such that  . We let η be the minimum guaranteed rate (continuously compounded) over the period Δ. We can write the payoffs of the two previous designs including this cliquet option, with a minimum guaranteed rate continuously compounded, equal to η for each period Δ.
For the participating policy, the crediting rate is computed recursively as follows:

The final payoff is  . We assume that the contract still includes a maturity minimum guaranteed rate equal to g since we want to understand the effect of adding an annual guarantee, all other parameters kept equal.
In particular, with a monthly sum cap design, we assume Δ is computed based on K subperiods (where the return is periodically capped at level c over each subperiod). The payoff at maturity T is computed recursively.

The final payoff is  because of the minimum guaranteed rate at maturity.
A typical Monthly Sum Cap has an annual guarantee and a maturity of 7 years. Thus Δ = 1 year (that is an annual guarantee, or annual floor) and K = 12 subperiods of 1 month. The returns are thus monthly-capped as in the Monthly Sum Cap. In this special case, the payoff at maturity is defined recursively as follows:

The final payoff is  .



