Introduction
This article starts from a simple yet important question, namely why have different industrialized capitalist market economies developed such different systems for social protection, social insurance, and redistribution? This question has generated a huge amount of research and one reason for this is that the societies we have in mind share a number of basic structural, social, political, and institutional features. This, one could argue, should have produced similarity and convergence in their levels of social protection and policies for redistribution and not huge and persistent, and in some cases increasing, differences (Korpi and Palme, Reference Korpi and Palme1998; Huber and Stephens, Reference Huber and Stephens2001; Iversen, Reference Iversen2005; Kenworthy and Pontusson, Reference Kenworthy and Pontusson2005; Pontusson, Reference Pontusson2005; Alber, Reference Alber2006; Scruggs and Allan, Reference Scruggs and Allan2006). For example, given that they are seen as western liberal market-oriented democracies, the variation in their systems of social protection and equality-enhancing policies can hardly be explained by reference to basic economic, social, or political structural conditions. Moreover, as Larsen et al. (Reference Larsen2006) have shown, little speaks for the notion that the variation between, for example, the encompassing and universal character of the Scandinavian welfare states and the residual and targeted system that exists in the United States can be explained by variation in popular beliefs about social justice or wage inequalities.
A different approach to the values/beliefs explanation would be to refer to the level and spread of religious beliefs in the population. However, if the extent and coverage of the welfare state were connected to Christian values of supporting the poor and the needy, then why do the most secular countries also have the most extensive programmes for economic support and the lowest percentages of children living in poverty (Norris and Inglehart, Reference Norris and Inglehart2004; Smeeding, Reference Smeeding2004)? The United States, one of the world's richest and, among developed nations, most religious societies, also has the highest percentage of children living in poverty and the highest percentage of newborns that do not reach their first birthday among the OECD countries. Simply put, why are the least religious countries in the developed world the most generous to the least fortunate and most vulnerable of their members?
A more utility-based line of thought starts from neo-classical economic theory, which predicts that given that these are all societies where the logic of the market dominates, economic agents (workers, employers, unions, firms, associations, bureaucracies, etc.) should act on the basis of similar utility functions and perceptions about risks. Their demand for protection from these risks and the following interactions should then result in similar systems for social protection and redistribution. Alternatively, the less efficient welfare state systems should, according to the logic of increased global economic competition, have been weeded out by more efficient ones. However, what we see is that differences, both in terms of institutional configurations and coverage, are huge and stable (Swank, Reference Swank2002; Pontusson, Reference Pontusson2005; Alber, Reference Alber2006).
One of the most successful approaches for explaining variation in the size and coverage of welfare states is the so-called Power Resource Theory (PRT), according to which this difference is largely a function of working class political mobilization (Korpi, Reference Korpi1983; Huber and Stephens, Reference Huber and Stephens2001). However, when PRT scholars reflect upon the importance of institutions for explaining variations in welfare states, they do not consider issues such as legitimacy or the Quality of Government (QoG). Instead, political institutions are seen as simple arenas for conflict among social classes or as useful political tools for the parties involved in this struggle. In other words, within PRT, institutional factors have no independent explanatory power (Korpi, Reference Korpi2001).
Our argument is precisely the opposite. In each country, historically inherited government institutions have an important impact on the choice of both individual wage earners and their representatives over whether or not to give the state responsibility for extracting resources and implementing policies for social insurance and welfare state redistribution. More precisely, this causal effect springs from generally established perceptions and the respective ideological and political discourses on the quality of the government institutions, which tend to have enduring effects (Rothstein and Uslaner, Reference Rothstein and Uslaner2005; Acemoglu and Robinson, Reference Acemoglu and Robinson2008; Schmidt, Reference Schmidt2009). What we argue is not a rebuttal of the PRT, but a complement to it. We agree that working class mobilization is key to understand welfare state expansion, but we clarify the hitherto neglected underlying condition for when this process is likely to take place: high QoG.
The argument will unfold in four steps. We first present the background, key virtues, and our critique of the PRT. We then present our own theoretical understanding of the problem – called the QoG theory – and state its observable implications. A section on data and research design is followed by a large-n test based on time-series cross-sectional data on 18 OECD countries during 1984–2000. We find (a) that QoG positively affects the size and generosity of the welfare state, and (b) that the effect of working class mobilization on welfare state generosity increases with the level of QoG. We end by discussing our conclusions.
The PRT: appraisal and critique
The PRT grew from an effort by a group of scholars who, during the late 1970s, tried to find a ‘middle way’ between the then popular Marxist–Leninist view that the welfare state should be understood as merely a functional requisite for the reproduction of capitalist exploitation, and the alternative view that welfare states follow from a similar functionalist logic of modernization and industrialization. Reacting against these functionalist explanations, PRT emphasizes two important issues. First, PRT scholars were the first to point out the variation in factors like coverage, extension, and generosity among existing welfare states and that this variation needed to be explained. Second, they introduced the importance of political mobilization based on social class as an explanation for this variation (Korpi, Reference Korpi1983). Variation in welfare states reflects, according to this theory, ‘class-related distributive conflicts and partisan politics’ (Korpi, Reference Korpi2006: 168). The more political resources the working class can muster, such as a strong and united union movement providing electoral support to Labour or Social Democratic parties, the more extensive, comprehensive, universal, and generous the welfare state will become (Esping-Andersen, Reference Esping-Andersen1990). The reason for this, according to the theory, is that the splits in the employment situation, reflecting class divisions, ‘generate interactions between class, life-course risks and resources, so that categories with higher life-course risks tend to have lower individual resources to cope with risks’. The argument is that such diversity in social risks generates ‘a potential for class-related collective action’ (Esping-Andersen, Reference Esping-Andersen1990). Although the theory has been challenged, it has been more successful than its contenders in explaining the outcome we are interested in (Huber and Stephens, Reference Huber and Stephens2001; Korpi and Palme, Reference Korpi and Palme2003; Allan and Scruggs, Reference Allan and Scruggs2004).Footnote 1
The analytical problem that we would like to point out in the Power Resource Approach is the following. Wage earners may have two reasons for supporting welfare state policies. One is that social classes give rise to different social risks, and rational wage workers (and their representatives) reasonably opt for some kind of protection from these risks. The other is a demand for redistribution based on either norms about social justice or class-based self-interest. In both cases, however, we need an explanation for why people trust the state to handle risk protection and/or redistribution. There are, not only in theory, many other possibilities. First, unions or national union movements could take care of many of these risks and create large insurance organizations that also work as ‘selective incentives’ when recruiting and retaining members. The same goes for the demand for increased redistribution. Second, strong unions could force employers (or employers’ organizations) to take on either the whole or a part of the costs for risk protection in addition to demands for redistribution. Especially for risk protection, a third possibility is that various ‘friendly societies’, or similar voluntary non-profit organizations, handle the demand for social protection. Another possibility is of course to rely on extended family networks or private insurance systems. Our point is that in order for wage earners and their representatives to turn to the state to respond to their demand for protection against social risks and for redistribution, they have to have a high degree of confidence in ‘their’ state. This can readily be seen from a Nordic perspective (the countries in which the PRT originally developed). In these countries, issues of political corruption or clientelism have hardly ever made the political agenda. Although many policies in the Nordic countries were universal and thereby left little room for bureaucratic discretion, others such as active labour market policies had to rely on extended forms of bureaucratic discretion. Compared to other European states, even before the emergence of democracy, the Nordic states were historically less corrupt, less clientelistic, less prone to use violence against their citizens, and more open to popular influence than most Continental and Southern European states (Heckscher, Reference Heckscher1952; Rothstein, Reference Rothstein2007; Frisk Jensen, Reference Frisk Jensen2008).
It is certainly possible to argue that there are certain risks that only the state can handle, and that the state is more effective than any other organization for implementing redistribution (Barr, Reference Barr1992; Boadway and Keen, Reference Boadway and Keen2000). Even so, we still need an explanation for the variation in the success of wage earners in getting such policies enacted by ‘their’ state. In some countries, it seems to have been unproblematic for leftist political leaders to argue for an increased role for the state in both risk protection and redistribution. In other countries, the state was seen as a much more problematic entity. For example, at the beginning of the 20th century, the union movement in the United States encountered courts that systematically produced decisions they thought of as hostile to their interests and this in turn changed the unions’ political strategy (Forbarth, Reference Forbarth1989; Hattam, Reference Hattam1993). In France in 1905, a conservative government wanted to involve the unions in the administration of an unemployment insurance system, but remembering the bloody defeat of the Paris Commune in 1871, the radical unions refused to collaborate with the French state (Alber, Reference Alber1984). On a more general level, while high levels of distrust in government authorities are rare in the Nordic countries, the opposite is true for much of the rest of the world, not least in developing and ‘transition’ countries. This is probably due to high levels of corruption, clientelism and patronage, and the effect of this distrust in that the possibility for governments to (a) collect taxes and (b) deliver services to its population is severely hampered.Footnote 2 (Kornai et al., Reference Kornai, Rothstein and Rose-Ackerman2004; Rothstein and Uslaner, Reference Rothstein and Uslaner2005; Adésínà, Reference Adésínà2007; Riesco and Draibe, Reference Riesco and Draibe2007; Brautigam et al., Reference Brautigam, Fjeldstad and Moore2008; Sorj and Martuccelli, Reference Sorj and Martuccelli2008; Holmberg et al., Reference Holmberg, Rothstein and Nasiritousi2009; Pasotti, Reference Pasotti2010). A close observer of the situation in Latin America has described this situation as follows:
I don't think there is any more vital issue in Latin America right now…. It's a vicious cycle that is very hard to break. People don't want to pay taxes because their government doesn't deliver services, but government institutions aren't going to perform any better until they have resources, which they obtain when people pay their taxes (Rother, Reference Rother1999).
It should be noted that in the very early forms of ‘workers’ insurance’ systems established in, for instance, Sweden and Denmark, the question of the trustworthiness and legitimacy of the institutions that were to implement the policies was central. In both countries, the solution was to give trade unions representation in, and sometimes direct control over, the various insurance funds behind the implementation of the system (Rothstein, Reference Rothstein1991). Moreover, in some cases, the unions could use this control as a form of ‘selective incentive’ to increase their membership and thereby their organizational strength (Western, Reference Western2001; Scruggs, Reference Scruggs2002). There are thus good arguments for why unions could have answered the demand for social protection themselves rather than transferring it to the state.
The conclusion we draw from this is that the causal logic in PRT is too ‘monochrome’ in its ontological foundations (cf. Hall, Reference Hall2003). The idea of a linear causal logic between the degree to which wage earners are politically mobilized and the size of the welfare state omits the existence of what have been called ‘feedback mechanisms’ that focus on the existence of a reverse causal link from the implementation of policies to public opinion (Soss and Schram, Reference Soss and Schram2007). By this we mean that it pays too little attention to the ramifying conditions under which the working class (or, more precisely, its political representatives) is likely to succeed in mobilizing support for social protection and/or redistribution by the state.
What happens when the state is brought back in?
In her well-known book Protecting Soldiers and Mothers, Theda Skocpol (Reference Skocpol1992) shows that the welfare sector in the United States was quite large during the late 19th century. A central part of this was the pension system for war veterans who participated in the Civil War and their dependent family members, a programme that during the decades following the end of the war became a huge operation both in terms of finances and the number of people supported. The problem, however, was that the system for deciding eligibility was complicated and entailed large amounts of administrative discretion. It is easy to imagine the difficulty in deciding what kind of health problems should count as resulting from military service. The result, according to Skocpol, was that ‘the statutes quickly became so bewilderingly complex that there was much room for interpretation of cases’ (Reference Skocpol1992: 121). What happened was that the war veteran pension administration became a source of political patronage and clientelism:
Because the very successes of Civil War pensions were so closely tied to the workings of patronage democracy, these successes set the stage for negative feedbacks that profoundly affected the future direction of U.S. social provisions. During the Progressive Era, the precedent of Civil War pensions was constantly invoked by many American elites as a reason for opposing or delaying any move toward more general old-age pensions…. Moreover, the party-based ‘corruption’ that many U.S. reformers associated with the implementation of Civil War pensions prompted them to argue that the United States could not administer any new social spending programs efficiently or honestly (Skocpol, Reference Skocpol1992: 59)
The point Skocpol makes is that the reason why the United States today has a comparatively small, targeted, and not very redistributive welfare state cannot be explained only by the lack of a Social Democratic type of labour movement or by reference to normative ideals about the population being devoted to a ‘rugged individualism’. On the contrary, the US welfare state was comparatively well developed at the beginning of the 20th century. It was thereafter politically delegitimized due to what was generally perceived as its low QoG.
In this paper, we argue that Skocpol's argument can be generalized. Many of the North European countries that started to develop encompassing welfare states during the first half of the 20th century had successfully increased their QoG during the preceding century. Bavaria, Prussia, Britain, Denmark, and Sweden, for example, carried out large-scale changes in their government institutions that did away with systemic corruption and pervasive patronage, and introduced impartial (meritocratic) systems for recruiting civil servants and handling the implementation of public policies (Heckscher, Reference Heckscher1952; Rubinstein, Reference Rubinstein1987; Harling, Reference Harling1996; Weis, Reference Weis2005; Frisk Jensen, Reference Frisk Jensen2008). These countries, when starting to build their welfare states, could thus start from a comparatively very advantageous position in terms of how their citizens perceived the trustworthiness, competence, and reliability of the government authorities that would be given the sensitive and intricate task of implementing the policies (Rothstein and Uslaner, Reference Rothstein and Uslaner2005).Footnote 3 However, although Skocpol's analysis was impressive, it dealt with just one (albeit important) case. It is noteworthy that, to our knowledge, in none but one of the literally hundreds of comparative statistical analyses produced during the last three decades in the welfare state research industry we have found any attempts to test the hypothesis originally launched by Skocpol.Footnote 4 Interestingly enough, the problem of low QoG is not mentioned even in recent works that argue welfare state research must move beyond the advanced industrial countries and focus more on the developing world (Carnes and Mares, Reference Carnes and Mares2007).
The QoG theory of the welfare state
Making a living in a market economy is a situation that for most people carries a lot of well-known risks, such as unemployment or having to pay for costly medical treatment. When facing risks, a rational response for most individuals is to try to find ways to get insurance or other forms of support. Our starting point is to try to understand the micro-logic of support for various social policy programmes: how individual citizens and/or their political representatives may analyse and reason about how to handle the risks they (or the group they represent) are facing and/or their demand for redistribution.
It should be noted that welfare states are complicated systems and therefore not easy to theorize ‘in toto’. They usually have different systems for increasing equality, for redressing severe types of poverty, and for handling social risks either for specific groups or for the whole, or very broad, segments of their populations. Thus, they are used for redistribution as well as for insurance against risks (Iversen, Reference Iversen2005: 21). However, as shown by Åberg (Reference Åberg1989) and Korpi and Palme (Reference Korpi and Palme1998), for example, systems that are meant to be mostly redistributive may be less so than systems that are intended to be mostly about social insurance. As Moene and Wallerstein have argued, social insurance systems ‘generally provide insurance against a common risk on terms that are more favourable for low-income individuals than for high-income individuals’ (Reference Moene and Wallerstein2003: 487). Moreover, if generally available services such as basic education, day-care, elderly care, and health care are included, the redistributive effects of welfare state policies increase dramatically (Zuberi, Reference Zuberi2006). The reason is that even if taxation is proportional to income (and not progressive), costs for services are on average nominal and the net effect of proportional taxation and nominal benefits is massive redistribution (Åberg, Reference Åberg1989). The effect of this is that whether or not the welfare state is understood as the provision of social protection, social services, or social insurances, the overall tendency is that ‘more encompassing’ generally implies increased redistribution. As shown by Moene and Wallerstein (Reference Moene and Wallerstein2001, Reference Moene and Wallerstein2003), the same underlying micro-foundations apply whether preferences for welfare state generosity are based on demand for insurance or redistribution.
Starting from micro-foundations does not imply that our theory rests on agents having ‘unrealistic’ levels of competence concerning the ability to process and compute information. A welfare state is a complicated piece of machinery and for most citizens it is very difficult to calculate the likelihood (or risk) that they will be winners or losers over their lifetime in this system. Inspired by Peyton Young's work in evolutionary game theory, we believe that one cannot build models assuming that agents are ‘hyper-rational’, or have close to perfect information. As he states it, the requirement on agents in standard rationalistic models ‘is a rather extravagant and implausible model of human behaviour’. Instead, we should realize that agents ‘base their decisions on fragmentary information, they have incomplete models of the process they are engaged in, and they may not be especially forward looking’ (Young, Reference Young1998: 5f). The implication is that the politically manufactured images (‘collective memories’, ‘discourses’) of what type of agent ‘the state’ is will be important when agents make decisions about whether to direct their demand for social protection towards the state or not (Schmidt, Reference Schmidt2009).
This does not imply that we should think of the agents as irrational and more or less helpless victims of the political manipulation of various forms of ‘false consciousness’. On the contrary, even though they are not fully informed and must base their decisions on far from perfect information, agents in our model ‘adjust their behaviour based on what they think other agents are going to do, and these expectations are generated endogenously by information about what other agents have done in the past’ (Young, Reference Young1998: 6). Thus, since the welfare state is a mega-sized collective action problem and since it involves strong normative standpoints regarding things like justice, desert, obligations, and fairness, the individuals’ utility functions are not only based on calculations about individual utility (what's in it for me?), but also at least as much on expectations about how the other agents are going to play (who are the others?).
Based on this reasoning, citizens (and political representatives) have to handle (at least) three issues when deciding if they are going to support a social policy, for example unemployment insurance or a public healthcare system. The first concerns the normative side of the question – namely whether such policies are to be considered as a ‘good thing’ or not? Second, and more important for our theory, for most citizens/wage earners, the enactment of policies for risk protection implies that they will have to part with a substantial portion of their money through taxation or other forms of contributions. They are only likely to accept this if they believe that the system for taxation is run in a fair, uncorrupted, transparent, non-discriminatory, impartial, and competent manner (Scholz, Reference Scholz1998).
Moreover, it is reasonable to believe that the perceived quality of the institutions that are responsible for the implementation of the various programmes plays a role in this calculus. All systems of insurance and redistribution have to be based on trust and, as is well known, such trust is a delicate thing. In anonymous large-n systems like these, at least two complicated ‘trust games’ are involved. Citizens have to trust that when they are in a situation in which they need and are entitled to support, the system will actually deliver. In some cases, especially when we are dealing with long-time horizons (pensions, elderly care), we must think of this as quite a problematic ‘leap of faith’. Not only is the demand here substantial in the sense that it concerns the outcome, but, when it comes to services like health care, it is, in all likelihood, also procedural. People do not want just the ‘technical side’ of the service in question. They also want to be respected, listened to, and have rights to appeal when they believe that they have not been treated according to established standards of professionalism and fairness. As shown in experimental research, the perceived level of procedural fairness is as important as the level of substantial fairness when people decide whether they should support a policy or decision by an authority (Tyler, Reference Tyler1998). It has also been shown that if citizens perceive the level of corruption in their society as high, this has a significant negative impact on their generalized trust (Rothstein and Uslaner, Reference Rothstein and Uslaner2005; Uslaner, Reference Uslaner2008). And conversely, when individuals perceive that government institutions are fair and unbiased, this has a positive impact on their social trust (Dinesen, Reference Dinesen2011).
Using very detailed survey data from Sweden, one of the most encompassing welfare states in the world, Staffan Kumlin has shown that citizens’ direct experience of interactions with various social policy programmes has a clear influence on their political opinions and, moreover, that such experiences are more important than citizens’ personal economic experiences when they form opinions about supporting or not supporting welfare state policies (Reference Kumlin2004: 199f). In addition, based on a large survey of four Latin American countries, Mitchell Seligson (Reference Seligson2002) concludes that the perceived level of corruption has a strong negative effect on beliefs about the legitimacy of the government when controlling for partisan identification. Using World Values Survey data from 72 countries, Bruce Gilley states that a set of variables measuring the QoG (a composite of the rule of law, control of corruption, and government effectiveness) ‘has a large, even overarching, importance in global citizen evaluation of the legitimacy of states’ (Reference Gilley2006: 57). Thus, we conclude that there are reasonably strong empirical indicators for how our theory about trust in institutions has a positive impact both on generalized trust and on political support for policies.
In addition, many welfare state programmes, both those intended to be redistributive and those that are more social insurance oriented, have to establish processes against overuse and outright abuse. For example, even people in favour of generous unemployment insurance are likely to demand that people who can work, and for whom there are suitable jobs, work. Tolerance of ‘free riding’ and the willingness to be the ‘sucker’ is generally very low. The issue of whether the welfare state system will lead to an undermining of personal responsibility is thus important and such discourses can lead to a loss of legitimacy for the general idea of social protection and redistribution by the state (Schmidt, Reference Schmidt2002). In other words, in order to be legitimate, the welfare state system should be able to distinguish between those personal risks for which agents have to take private responsibility, and risks for which they have the right to claim benefits. Those in favour of a generous system for work accident insurance or the right to early retirement for people hit by chronic illness may have legitimate reason to fear the abuse of such systems. Our point is that even people who are true believers in social solidarity and strong supporters of redistribution are likely to withdraw their support for an encompassing welfare state if these three requirements are not met. Put differently, their support is ‘contingent’ upon their view of the quality of the public institutions that are to implement the programmes (Levi, Reference Levi1998). The quote below from John Reference RawlsRawls's ‘A Theory of Justice’ explains this moral logic well:
For although men know that they share a common sense of justice and that each wants to adhere to existing arrangements, they may nevertheless lack full confidence in one another. They may suspect that some are not doing their part, and so they may be tempted not to do theirs. The general awareness of these temptations may eventually cause the scheme to break down. The suspicion that others are not honoring their duties and obligations is increased by the fact that, in absence of the authoritative interpretation and enforcement of the rules, it is particularly easy to find excuses for breaking them (1971: 240).
In sum, we can think of this as citizens facing three interrelated problems when they decide if they should support a policy for social insurance or redistribution: the question of the policy's substantial justice, its procedural justice, and the amount of ‘free riding’ that can be expected in the process of its implementation. For example, an agent may agree that it is right to have universal health care, but still take a political stand against it because she believes the government is incapable of implementing such a programme in accordance with her demands for procedural justice. One can think of the success antagonists against universal healthcare insurance in the Unite States have had in branding this policy as ‘socialized medicine’. We would like to underline that these issues are likely to play a role not only, as is obvious, in programmes that are modelled as social insurance systems but also in programmes for redistribution. This is evident from the long-standing discussion, especially in the United States, about how to distinguish between the ‘deserving’ and the ‘undeserving’ poor (Skocpol, Reference Skocpol1987). The welfare state contract, whether ‘new’ or ‘old’, is for the individual citizen both a contract with all other citizens (will they pay their taxes and refrain from abusing the system?) and with the government authorities (when the day to collect the insurance or service comes, will they deliver and, if so, will they do so in an acceptable way?). This can be thought of as the ‘moral economy’ of the welfare state (Svallfors, Reference Svallfors2007).
We will leave the first normative question about a policy's substantial justice out of the discussion and concentrate on the second and the third. Both these problems concern how agents perceive the competence, honesty, and trustworthiness of the government institutions that are to implement the policies in question. In a recent publication, Rothstein and Teorell (Reference Rothstein and Teorell2008) conceptualized QoG as being founded on one basic norm, namely impartiality in the exercise of public power in the same vein as Robert Dahl has conceptualized democracy as being based on ‘political equality’ in access to public power. This discussion is connected to the more recent focus in development studies and institutional economics on the importance of ‘good governance’ (Acemoglu and Robinson, Reference Acemoglu and Robinson2008).
Our central hypothesis, in line with Rothstein and Teorell (Reference Rothstein and Teorell2008), is that without a reasonably high level of QoG, political mobilization for welfare state policies in the way that PRT has outlined is unlikely to have broad appeal. We would again like to underline that we do not think of these approaches as mutually exclusive, but rather as complementing one another. In other words, both political mobilization according to PRT and a high level of QoG are necessary, but are not on their own sufficient for creating an encompassing, universal, and thereby more redistributive welfare state. This has two implications for our initial question about how to explain the existing variations in social policy systems. The first has to do with the origins of the welfare state system. If our theory is correct, we should expect low QoG, that is, high levels of corruption and/or clientelism and patronage in government systems should lead to less encompassing welfare states. Second, we should expect high QoG to work as a ramifying condition for the success of PRT. More precisely, the effect of working class mobilization on welfare state expansion should increase with the level of QoG. We will now apply these two expectations to the data.
Data and research design
In order to test our hypothesis in a broader scope of observations than the historical US case, we need the measures of two things: the size of the welfare state and the QoG. Starting with the former, the lion's share of the large-n literature on determinants of the welfare state has relied on social spending data (see, e.g. Huber and Stephens, Reference Huber and Stephens2001; Swank, Reference Swank2002). Including government spending on both cash benefits and social service provisions, this is arguably a reasonable proxy for welfare state effort. Since the causal mechanism underlying our theory is in part based on the notion that ordinary citizens and/or their representatives refrain from entrusting the state with the kind of huge sums of money that an encompassing welfare state requires, this proxy actually suits our purposes well. As a first measure of welfare state development, we will therefore use total public social expenditure as a percentage of GDP as recorded in the OECD Social Expenditure Database (OECD, 2007) on an annual basis for 18 countries during 1984–2000, taking missing data in the independent variables into account.Footnote 5
True, there are well-known drawbacks involved in using social spending data. Some of these are more technical and hence more easily handled. For example, without proper controls for business cycles and the size of the target population, figures on social spending might tap into other phenomena in addition to the welfare state effort (see, e.g. Korpi and Palme, Reference Korpi and Palme2003; Scruggs, Reference Scruggs2007). The more fundamental problem with the spending data, however, concerns their risk of being ‘epiphenomenal to the theoretical substance of welfare states’ (Esping-Andersen, Reference Esping-Andersen1990: 19). When an ordinary citizen ponders the social risks involved in being laid off from work, for example, he or she is likely to demand some form of unemployment protection scheme, not simply ‘increased social spending on the unemployed’. Similarly, when political parties and representatives propose new legislation to increase social protection for sickness leave, they frame their proposals in those words, and not in terms of the budgetary increases these reforms require. In Esping-Andersen's (Reference Esping-Andersen1990: 21) famous words, whereas social spending definitely taps into increased welfare efforts, ‘it is difficult to imagine that anyone struggled for spending per se’.
For this reason, we will complement the social spending indicator with the hitherto most broad-ranging measure of welfare state effort based on actual social policy reforms rather than their implied costs.Footnote 6 This measure is Lyle Scruggs's (Reference Scruggs2006) ‘benefit generosity index’ that draws on detailed information on replacement rates, eligibility criteria, and the size of the population that is insured against unemployment and sickness, and participates in public pension schemes. The index theoretically varies from 0 to 64 and covers 18 countries annually from 1984 to 2000 (taking into account missing data in other variables). Since this index captures the kinds of social policy reforms that are more likely to be implemented in systems with high QoG more directly, we think of it as a more realistic proxy for the outcome our theory purports to explain. One potential drawback with the benefit generosity measure deserves mention, however, namely that it excludes the social service production part of the welfare state.
Second, we of course need a measure of QoG. Although cross-national indicators of QoG or ‘good governance’ have proliferated in recent years, only one of these gauges the QoG institutions over a longer period of time: the International Country Risk Guide's (ICRG) indicators (http://www.prsgroup.org). We need over-time (apart from cross-national) variation in QoG since the implication of our theory is that the cumulative experience of the state, not one-shot encounters, should be what matters (more on this below). Three of the ICRG indicators are of particular interest to us and they are based on expert perceptions of risks to international business and financial institutions stemming from (a) corruption (e.g. special payments, bribes, excessive patronage, and nepotism); (b) law and order (e.g. weak and partial legal systems, low popular observance of the law); and (c) bureaucracy quality (lack of autonomous and competent bureaucrats). The ICRG indicators have a distinguished history in the field of cross-national measurement of QoG going back to at least Knack and Keefer (Reference Knack and Keefer1995). We use the average of these three indicators, restricted to range from 0 (low) to 1 (high quality), and cover the same 18 countries from 1984 to 2000 as our key independent variable in the subsequent analyses.Footnote 7
As shown in Appendix, where basic descriptive information on all variables is displayed, the selection of countries for which we have data unsurprisingly belongs to the least corrupt and hence highest QoG countries in the world. This means that the variation in QoG that prevails among these countries applies to the higher end of the scale: The mean value is 0.94, ranging from Italy with an average of 0.77 to Canada with an average of 1.0. Moreover, the over-time within-country variation in both levels of QoG and the expansion of the welfare state is even smaller (ranging from some 25% of the cross-country variation in benefit generosity to some 50% in QoG). We argue that this weighs against the tests of our hypothesis. That is, having little variation in our key independent and dependent variables makes our test a conservative one. If we can find evidence of an effect of QoG on welfare state effort in this restricted set of countries, we should be more optimistic about finding such a pattern on a more global scale (had the data on welfare state expansion been available), where variation is known to be much larger.
Ideally, however, we would have preferred data on the QoG that dates further back in history, to the construction stage of the modern welfare state. Unfortunately, the time period our data cover is from the era of retrenchment, from around the mid-1980s onwards, when most social security provisions in the western world were scaled back. This poses a problem for the testing of our theory, since we believe the causal mechanism underlying our hypothesis relates more strongly to the political logic of welfare state expansion. Our solution to this problem is to rely on levels, rather than changes, in the dependent variables. These levels may be viewed as a long-run tally of all previous changes (positive or negative) in welfare state effort and should predominantly capture the extent of welfare state expansion rather than retrenchment.Footnote 8 We do, however, also incorporate two sets of robustness tests that focus, on the one hand, on within-country variation across time (i.e. controlling for country-fixed effects), and, on the other, test our argument on short-term changes in the level of welfare state expansion (by controlling for the lagged dependent variable).
By and large, then, we fairly closely follow the methodological setup of Huber and Stephens (Reference Huber and Stephens2001: Ch. 3), which provides the most encompassing quantitative support for PRT as an explanation for welfare state expansion to date. This has the additional advantage of highlighting the more exact contribution of the QoG factor. We also closely follow Huber and Stephen's (Reference Huber and Stephens2001) the measurement strategy for the partisan variables, based on their own data (Huber et al., Reference Huber, Ragin, Stephens, Brady and Beckfield2004): Left and Christian democratic cabinets, respectively, are the cumulative share of left/Christian democratic party governments (or fraction of parliamentary seats for all coalition member parties in coalition governments) since 1946.Footnote 9 The rationale for using the cumulative, rather than the annual, shares is again our focus on long-term development. We do not expect, for example, a left-party cabinet to be able to substantially alter the welfare state effort in their country from one year to the next. But the longer the time period that left parties have been in government in a country, the more expanded a welfare state we should expect to find. Following the same logic, we compute the cumulative scores of the QoG variable as well (in this case, the cumulative mean rather than the cumulative sum). The QoG factor for each year thus reflects the entire history of the QoG for that particular country since the first year of measurement (i.e. 1984). We believe that this measurement strategy resonates well with the cognitive mechanisms on which our theory is based, since citizens or their representatives are likely to judge the trustworthiness of their state institutions not as a single-shot evaluation at each time point but rather as a running tally of previous experiences.Footnote 10
It could of course be argued that an encompassing welfare state might generate high QoG, which would induce endogeneity bias into our estimates. Our response to this threat is partly methodological. First, we have lagged the QoG variable by 1 year in all models to make sure that our main explanatory variable has at least been measured at an earlier time point than the outcome we are attempting to explain. Moreover, when we check the robustness of our results with the inclusion of the lagged dependent variable, we are in effect controlling for the entire previous history of the expansion of the welfare state, making the counter-argument that the causal arrow might be pointing in the reverse direction highly implausible. But equally important, as argued in the theory section above, our historical understanding of the cases at hand is that countries that managed to create encompassing welfare states in the 20th century had reformed their state bureaucracies and rooted out endemic corruption and patronage problems in the 19th century. It could thus be argued that, at least historically speaking and in the Western hemisphere, high QoG preceded welfare state expansion.
Finally, we include a set of control variables in our analyses. Globalization is measured with two variables: openness to trade (Heston et al., Reference Heston, Summers and Aten2002) and an index of the liberalization of the regulation of capital and current transactions (Huber et al., Reference Huber, Ragin, Stephens, Brady and Beckfield2004; originally from Quinn, Reference Quinn1997). To control for business cycles, we include measures of unemployment and budget deficits as a percentage of GDP (Armingeon et al., Reference Armingeon, Gerber, Leimgruber and Beyler2008; International Monetary Fund (IMF), 2008).Footnote 11 Since Huber and Stephens (Reference Huber and Stephens2001) find that female labour force participation has a significant effect on the expansion of the welfare state, we also include a measure of the percentage of women in the labour force (OECD, 2006). To control for constitutional veto points, which can be argued to hinder welfare state expansion, we have used an additive index based on federalism, presidentialism, bicameralism, and frequent use of referenda (Huber and Stephens, Reference Huber and Stephens2001: 55f; Huber et al., Reference Huber, Ragin, Stephens, Brady and Beckfield2004). Finally, we control for the percentage of the population above 65 years of age, GDP per capita, and inflation (Heston et al., Reference Heston, Summers and Aten2002; OECD, 2007; World Bank, 2007).
Again, most of these variables can only be expected to influence the level of the welfare state effort in the long run, and they will therefore be measured cumulatively (this applies for liberalization of capital and current transactions, female labour force participation, constitutional veto points, population above 65 years of age, and inflation). A few of the variables can however be argued to influence the extent of the welfare state in the shorter run: A higher rate of unemployment means more recipients, which raises social spending without making the system more generous.Footnote 12 The same applies to openness to trade, which has been said to increase workers’ sense of risk of being displaced (Huber and Stephens, Reference Huber and Stephens2001: 63). GDP is not only the resource base for expanding the welfare state in the first place, but also the denominator in the spending measurement, and this is why short-term changes can be expected to influence our dependent variable. Finally, we expect that budget deficits tend to force governments to make cuts in the welfare state in the short run and the budget deficit variable is therefore not measured cumulatively.
Results
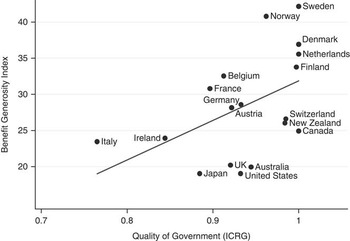
To provide a first illustration of the empirical patterns, we start by presenting two graphs to give a more visual feel for the data. Figure 1 displays the positive relationship at the country level between QoG and the level of welfare state effort, measured as the benefit generosity index. Both the QoG and the welfare state measures are computed here as the mean value of all observations during 1984–2000 for each country. As our theory would predict, we observe the encompassing Scandinavian welfare state to the upper right, that is, among countries with both high levels of QoG and benefit generosity. On the other side of the spectrum, however, are countries with lower QoG and smaller welfare states, such as Italy and Japan, located to the lower left.
Benefit generosity and Quality of Government in 18 OECD countries during 1984–2000.R 2 = 0.23, β = 55, P > |t| = 0.045. Note: Both the QoG measure and the benefit generosity index are here computed as the mean value of all observations 1984–2000 for each country.Sources: Scruggs and Allan (Reference Scruggs and Allan2006); ICRG.
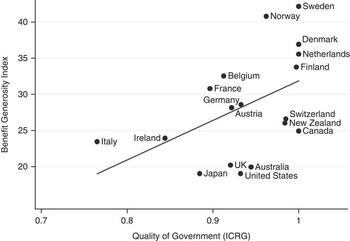
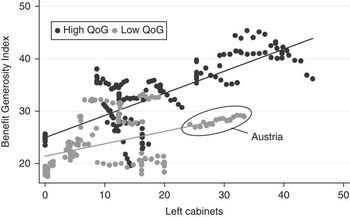
Figure 2 instead illustrates how QoG works as a ramifying condition for the effect of cabinet partisanship on welfare state generosity. The graph presents data for all the available country-year observations during 1984–2000 in the 18 OECD countries for which we have data. In the figure, we have divided the observations into two equally sized groups based on their value on the QoG variable (the cumulative mean): the high QoG observations in black, the low QoG observations in grey. The two regression lines track the relationship between left cabinets and the benefit generosity index for these two groups, respectively. As can be seen, the dark grey regression line, representing the group with high QoG, is steeper than the light grey regression line. This means that the effect of left cabinets on the benefit generosity index is bigger in the group with high QoG than in the one with low QoG. Thus, the effect of left cabinets on the level of welfare state effort is dependent on the level of QoG.
Illustration of the interaction in 18 OECD countries during 1984–2000.Notes: Each dot represents one country and year (e.g. Sweden 1984). The observations are split into two equally sized groups based on their level of QoG. The regression lines show that the effect of left cabinets on the benefit generosity index is bigger for the observations with high QoG than for the observations with low QoG.Sources: Scruggs and Allan (Reference Scruggs and Allan2006); Huber et al. (Reference Huber, Ragin, Stephens, Brady and Beckfield2004).
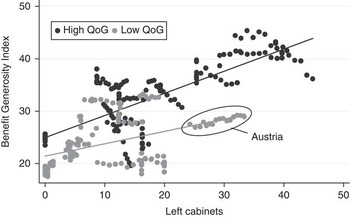
This latter result, however, critically depends on the inclusion of one country, whose observations have been circled in the figure, namely Austria. Although one could interpret this as a sign of non-robustness (more on that below), it should be noted that the Austrian case fits our theoretical argument well. Among countries with more extensive experience of leftist governments, Austria is alone in having a relatively less generous welfare state (all other countries being Scandinavian). Our theory explains why this is the case: Austria also has a lower QoG, implying that worker mobilization has not resulted in welfare state expansion to the same extent as in Scandinavia. This finding is well in line with qualitative work on the history of Austria. After 1945, the country's politics became dominated by the so-called ‘Proporz’ system in which the two main parties divided power. From the early 1960s, this system of high-level political consensus degenerated into a fully fledged system of patronage and clientelism in which even minor positions in the public administration, such as public school principals and chairs in the public universities, were divided along party lines. However, from the 1990s, the degeneration of the ‘Proporz’ system came in for widespread criticism. Identifying ‘Proporz’ as corruption became a major asset for the new populist party that gained strong electoral support in the late 1990s (Fallend, Reference Fallend1997; Heinisch, Reference Heinisch2002). To our knowledge, Austria is the only West European country that has institutionalized systematic clientelism in its civil service.
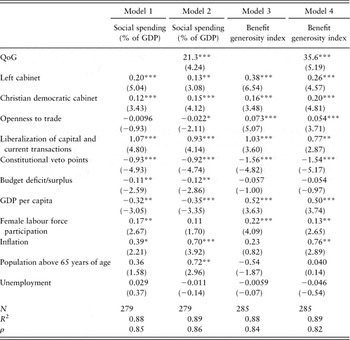
We now turn to the more systematic evidence underpinning these descriptive relationships. In Table 1, we display four empirical models that together show how QoG is part of the explanation of the generosity of the welfare state. The models again include all 18 OECD countries during 1984–2000. In models 1 and 2, we use social spending as our dependent variable. Model 1, where QoG is not included, confirms that our data are in line with PRT. That is, as predicted, both the left cabinet and the Christian democratic cabinet variables are positively related to social spending.
Regression estimates for QoG in 18 OECD countries during 1984–2000

QoG = Quality of Government.
t statistics are given in parentheses.
*P < 0.05, **P < 0.01, ***P < 0.001.
Notes: Prais–Winsten's regression with heteroskedastic panel corrected SE and AR1 autocorrelation structure. Year dummies are included in the model. Most independent variables are measured cumulatively (see text). All independent variables are lagged 1 year.
Turning to model 2, our main hypothesis is confirmed. QoG has a positive and significant effect on the level of welfare state effort measured as spending. Since the QoG variable in our sample varies from 0.75 to 1, it is easy to interpret the coefficient: the model predicts that a country with the best possible level of QoG will spend around 5 (i.e. 21 × 0.26) percentage units more of its GDP on the welfare state compared to a country with the lowest level of QoG. This can be compared to the between-country standard deviation in social spending, which incidentally is 5% of GDP.
In addition, model 2 shows that both left and Christian democratic cabinets still have a positive effect on the level of social spending when QoG is included in the model. The effect of left cabinets, however, is cut from 0.20 to 0.13, whereas the effect of the Christian democratic cabinet becomes somewhat bigger. The implication of this is that previous tests of PRT, where QoG has not been controlled for, have overestimated the effect that left cabinets exert on welfare state expansion and underestimated the effect of Christian democratic cabinets. The probable reason for this is that left parties have held power for longer spells in high QoG countries such as, for example, the Scandinavian countries, as compared to their lower QoG counterparts in southern Europe.
Turning to models 3 and 4 of Table 1, here we instead use Scruggs's benefit generosity index (Reference Scruggs2006) as our dependent variable. The results from models 1 and 2 are repeated. Without QoG in the model, left and Christian democratic governments have a significant and positive effect on the generosity of the welfare state (model 3). The effect of left cabinets is however reduced by almost one-third when QoG is introduced and the effect of Christian democratic cabinets increases by one-fourth (model 4). In model 4, our main hypothesis is again confirmed in that QoG is positively related to the dependent variable. The coefficient of 35.6 implies that an increase in QoG from the level of Italy (at 0.74) to the level of Canada (at around 1) would lead to an increase in benefit generosity of about 9.3 (35.6 × 0.26). In substantial terms, this effect is even slightly bigger than the between-country standard deviation in benefit generosity (which is about 7).
To sum up thus far, models 1–4 confirm our main hypothesis. QoG has a significant and positive effect on the level of welfare state effort, regardless of whether our dependent variable is measured as spending on the welfare state or through the benefit generosity index. Considering the fact, pointed out above, that we mostly observe countries with already high and fairly stable levels of QoG, which means there is relatively little variation in QoG to begin with, we believe this is a notable finding. However, the effect of cabinet partisanship still holds when QoG is included in the model. The PRT is therefore complemented rather than refuted.
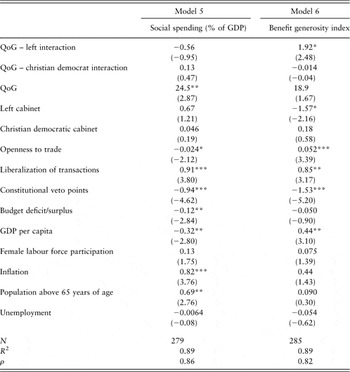
We now turn to the more systematic test of our second and supplementary hypothesis that the size of the effect of cabinet partisanship is conditional on the level of QoG. Table 2 presents this result with regression estimates, again for the 18 OECD countries during 1984–2000 and using the same control variables as in Table 1. The two interaction variables are simply the QoG variable multiplied by the left and Christian democratic cabinet variables, respectively. The coefficients for these interaction terms should be interpreted as the effect QoG exerts on the effect of either type of cabinet. In other words, if this second hypothesis is proved correct, we should expect a positive and significant interaction term.
Regression estimates for interaction effect of cabinet partisanship and QoG in 18 OECD countries during 1984–2000

QoG = Quality of Government.
t statistics are given in parentheses.
*P < 0.05, **P < 0.01, ***P < 0.001.
Notes: Prais–Winsten's regression with heteroskedastic panel corrected SE and AR1 autocorrelation structure. Year dummies are included in the model (coefficients not reported). Most independent variables are measured cumulatively (see text).
It turns out that this hypothesis is in part confirmed. There is a positive and significant interaction effect when the welfare state level is measured with the benefit generosity index (model 6), but not when it is measured as spending on the welfare state (model 5). In other words, the positive relationship between left and Christian democratic cabinets and spending on the welfare state does not vary with the level of QoG. However, the effect of left cabinets on benefit generosity increases with higher QoG. This means that our hypothesis is at least confirmed in the model with the most realistic proxy for welfare state effort.Footnote 13
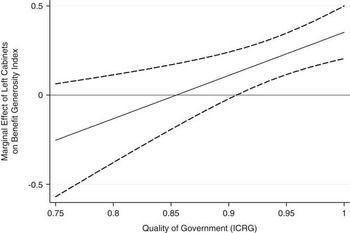
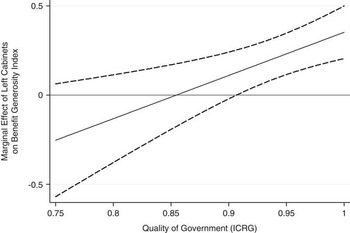
In Figure 3, we have plotted the effect of left cabinets on benefit generosity across the observed range of values for the QoG indicator, together with the 95% CI for this effect.Footnote 14 Apart from the clearly visible trend that the effect increases with higher levels of QoG, this figure makes clear at what level of QoG the effect of left cabinets becomes statistically significant. Although this point, at about 0.91, appears to be located relatively far up on the ICRG indicator, in reality 80% of our country-year observations are aligned above this point. Were this result to hold for a larger sample of countries, we should thus not expect PRT to travel very far from Europe, that is, into parts of the world with far higher levels of corruption, clientelism, and patronage, and hence lower levels of QoG (we return to this interpretation below).
The marginal effect of left cabinets across different levels of Quality of Government.
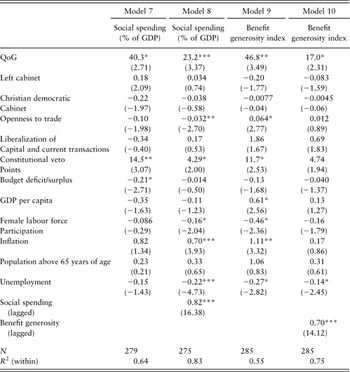
Apart from the fact that our second hypothesis, on the interaction between left cabinets and QoG, only holds for benefit generosity (but not for social spending), there are other indications that our main hypothesis, on the general effect of QoG on welfare state expansion, is the more robust of the two. In Table 3, we show that the general effect is both statistically and substantially robust after two rather demanding robustness tests. To begin with, it holds even when all cross-country variation has been partialled out through the use of country-fixed effects (a rather hard test considering that our variables are pretty stable over time). In this case, the QoG variable holds up as an explanation of the level of welfare state effort, regardless of what measure is used for the dependent variable (models 7 and 9). Given the multitude of alternative arguments for what may explain cross-country variation in welfare state expansion as cited above, we find it reassuring that our theory withstands empirical scrutiny even within countries over time. As a matter of fact, this applies even when, apart from year- and country-fixed effects, we control for the lagged dependent variable, in effect turning our estimates into a model of change (models 8 and 10). Our hypothesis on the interaction effect does not however withstand these robustness tests (results not shown). The main reason for this, as should be expected from the discussion of Figure 2 above, is the critical case of Austria. When Austria is excluded (or when all cross-country variation is cancelled out), the interaction effect does not hold.Footnote 15 The main effect of QoG on welfare state expansion is however not sensitive to the exclusion of any particular country. It is thus clearly the more robust finding of the two.
Robustness tests: country-fixed effects and lagged dependent variables

QoG = Quality of Government.
t statistics in parentheses.
*P < 0.05, **P < 0.01, ***P < 0.001.
Notes: All models (7–10) include country- and year-fixed effects. Models 7 and 9 robust SE clustered by countries to handle serial autocorrelation.
Conclusion
Our argument started from a discussion of how to explain variation in the extension of social insurance and social protection systems among the developed liberal democracies. We argued that the most successful theory explaining this variation to date is the PRT. Our criticism of this theory is that it has taken for granted that the state as an organization can always be seen as a suitable and unproblematic tool for implementing welfare state policies. Building on earlier historical case studies, we presented an alternative approach labelled the QoG theory in which the political legitimacy of the state is central for securing political support for public programmes for social insurance and systems of redistribution. We have tested this theory with data from 18 OECD countries and our results show that QoG has a significant and positive effect on a country's efforts for social protection and social insurance, both when this is measured as the level of spending and when measured as how generous the specific benefits are. However, since the effect of cabinet partisanship still holds when QoG is included in the model, the PRT is, as we expected, complemented rather than refuted. On our second hypothesis, that is, the size of the effect of cabinet partisanship is conditional on the level of QoG, we found that this interaction effect was confirmed when using benefit generosity as the dependent variable but not when we used overall spending. We argue that this means that our theory is confirmed when we use the data with the highest validity for measuring welfare state effort. It should be added that a country for which our empirical analysis is very telling is Austria, which has had a high level of Social Democratic cabinet members but a comparatively low level of welfare state effort. This fits well with the QoG theory since the Austrian state is the only one in our sample with an institutionalized system of political clientelism, which, moreover, has been successfully used by populist parties to delegitimize the established political order.
One way to evaluate the strength of a social science theory is to ask how well it ‘travels’. The more cases it can explain, the stronger it stands. In this case, the PRT has been shown to be fairly good at explaining the extent and institutionalization of social policies in 18 western OECD countries, which is of course important. However, it should be remembered that this is less than 10% of the total number of countries in the world, comprising less than 15% of the world's population. According to all cross-country empirical indicators that measure QoG, the 18 western OECD countries that PRT focuses on have comparatively high levels of QoG (cf. Samanni et al., Reference Samanni, Teorell, Kumlin and Rothstein2008). Although our results show that the QoG theory serves as a necessary complement to the PRT for the above-mentioned developed countries, it seems reasonable to argue that the importance of QoG for establishing an encompassing welfare state will increase as we move to countries in other regions of the world, such as, for example, Latin America or Sub-Saharan Africa. By contrast, the effect of working class or other forms of partisan mobilization should, as indicated in Figure 3, decrease. Given the rampant corruption and clientelism in countries such as Brazil, it is unlikely that we will see the enactment of a North European type of welfare state, even with leftist governments for an extended period (Weyland, Reference Weyland1996; Sorj and Martuccelli, Reference Sorj and Martuccelli2008). As Rudra puts it, politicians in these countries are inclined to use welfare systems for patronage politics ‘by appointing teachers, health and social workers in exchange for political support’ (Reference Rudra2004: 699). The same can be said of several countries in Sub-Saharan Africa (Samson, Reference Samson2002; Adésínà, Reference Adésínà2007). Thus, the farther away from the 18 developed countries our two theories travel, our presumption is that the QoG theory will become more important than the PRT for explaining variations in social protection through the state.
Acknowledgements
We would like to thank our colleagues in the Quality of Government Institute at the University of Gothenburg and Staffan Kumlin, Jonas Pontusson, Duane Swank, Stefan Svallfors and Peter Taylor-Gooby for valuable comments on earlier versions of this paper.
Appendix Descriptives

Note: The ‘Between std. dev.’ is the standard deviation between countries, that is, when the year variable is held constant. The ‘Within std. dev.’ is the standard deviation over time, that is, when the country variable is held constant.