



INTRODUCTION
West Nile virus (WNV) is a mosquito-borne virus that causes annual seasonal outbreaks in the USA which peak during the summer months but vary in size and location from year to year [1, Reference Petersen and Fischer2]. A large multistate outbreak occurred in 2012, with more cases reported nationally than in any year since 2003; one-third of all cases reported in 2012 were from Texas [3].
In Texas, positive WNV laboratory results are reported to the Department of State Health Services (DSHS) by participating laboratories through an electronic laboratory reporting system, the National Electronic Disease Surveillance System Base System (NBS). Detection of anti-WNV immunoglobulin (Ig)M antibodies in serum or cerebrospinal fluid is the most common way to diagnose WNV infection [Reference Janusz4, Reference Martin5]. The presence of anti-WNV IgM antibodies usually indicates recent infection, while the presence of IgG antibodies alone typically indicates past infection. The detection of WNV RNA indicates recent infection, but it is rarely identified in immunocompetent patients with clinical illness [Reference Lanciotti6, Reference Lanciotti7]. Immunohistochemical staining can be used to detect WNV antigens in fatal cases [Reference Guarner8].
During the 2012 WNV outbreak, Texas DSHS needed timely information on WNV disease cases to respond to public inquiries, inform stakeholders, and plan public health interventions. The objectives of our analysis were to evaluate if WNV laboratory reports in NBS accurately predict subsequent WNV disease cases, determine the sensitivity and positive predictive value (PPV) of WNV laboratory reports for WNV disease cases, and assess if laboratory reports provide more timely information about trends in disease cases than the traditional case-reporting mechanism in Texas.
METHODS
Case definitions
We defined an NBS suspect case as a person with evidence of recent WNV infection based on a laboratory result reported to Texas NBS. Evidence of recent WNV infection included a positive WNV IgM antibody, RNA, or viral antigen test result. A WNV disease case was defined as a Texas resident with a clinically compatible illness and laboratory evidence of recent WNV infection according to the national surveillance case definition [9]. A matched case was defined as any person who was an NBS suspect case and was also reported to Texas DSHS as a WNV disease case.
Case-finding and data extraction
WNV disease is a nationally notifiable condition and Texas laboratories are required to report positive test results to the state or local health department. Texas NBS is used by the health departments to receive electronic laboratory results for WNV and other notifiable conditions. Positive laboratory results are uploaded into NBS using electronic messages received from participating laboratories where the testing is performed. Negative test results are sometimes entered into NBS if they are linked to positive results on the same specimen (e.g. negative IgM and positive IgG antibody results on the same specimen might both be included and reported as two results). For laboratories that do not use electronic reporting, positive laboratory results are sent to the local health department. These results can be entered manually into NBS for local tracking, although this is not required to report a case. Healthcare providers also can report suspect cases to their local health department. After receiving a positive laboratory result through NBS or other means, the local health department conducts a case investigation to collect demographic and clinical information from interviews with the patient and medical providers. Patients meeting the national surveillance case definition are reported as disease cases [9]. All local and regional health departments in Texas report WNV disease cases to DSHS through a paper-based system. Although the state health department can use NBS to report nationally notifiable conditions to the Centers for Disease Control and Prevention (CDC), through 2012, DSHS reported WNV disease cases to CDC using ArboNET, the national arboviral surveillance system [10–12].
Since 2005, Texas DSHS has managed WNV laboratory results through NBS. In 2005 and 2006, all laboratory reports were entered manually. Electronic laboratory reporting in Texas was piloted in several laboratories in 2007 and two high-volume laboratories that provide WNV testing were added beginning in 2008. We limited our analysis to 2008–2012 to include years when laboratory results were routinely reported to NBS electronically.
WNV laboratory results were extracted from NBS using a query of 28 logical observation identifiers names and codes (LOINC) in the resulted and ordered test fields that represented tests for WNV IgM antibody, RNA, or antigen. To identify patients with evidence of recent WNV infection, we filtered the reports to exclude: (1) negative test results for any test type; (2) positive results for test types that do not meet the national surveillance case definition (e.g. WNV IgG and neutralizing antibody tests alone); and (3) subsequent reports when multiple positive laboratory reports were available for the same patient identification number (e.g. one cerebrospinal fluid and one serum, or two sera). Each person for whom a report remained after this filtering process was classified as an NBS suspect case. Variables obtained from NBS included: (1) patient's name, sex, date of birth, and contact address; (2) specimen collection date; (3) test type and results; (4) date the results were reported to NBS; and (5) whether the results were reported to NBS electronically or manually.
We obtained data for all WNV disease cases reported to Texas DSHS from 2008 to 2012 from the statewide database used for reporting to ArboNET. Variables obtained on WNV disease cases included (1) patient's name, sex, date of birth, and county of residence; (2) illness onset date; (3) clinical syndrome; (4) outcome; and (5) date the case was reported to Texas DSHS.
Data analysis
Matching was performed to determine the overlap between NBS suspect cases and WNV disease cases reported to Texas DSHS. Because no identification numbers were shared between NBS and the WNV disease case database, we used the SPEDIS function in SAS 9.2 (SAS Institute Inc., USA) to match records based on patients' first and last names and birthdates. A case was considered to match if there was (1) a complete match by first and last name or (2) a match by either first or last name and an exact match by birthdate. Less than 1% of NBS suspect cases were missing the patient's first name, last name, or date of birth.
To evaluate the association between NBS suspect cases and WNV disease cases, we calculated sensitivity (Se) and PPV using the following equations:
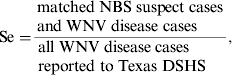 $${\rm Se =} \displaystyle{\matrix{{\rm matched}\;{\rm NBS}\;{\rm suspect}\;{\rm cases} \cr {\rm and}\;{\rm WNV}\;{\rm disease}\;{\rm cases} } \over \matrix{\hskip-10pt{\rm all}\;{\rm WNV}\;{\rm disease}\;{\rm cases} \cr\hskip-10pt {\rm reported}\;{\rm to}\;{\rm Texas}\;{\rm DSHS} }}, $$
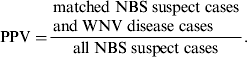 $${\rm PPV =} \displaystyle{\matrix{{\rm matched}\;{\rm NBS}\;{\rm suspect}\;{\rm cases} \cr {\rm and}\;{\rm WNV}\;{\rm disease}\;{\rm cases} } \over {{\rm all}\;{\rm NBS}\;{\rm suspect}\;{\rm cases}}}.$$
We used the ratio of the number of NBS suspect cases to the number of WNV disease cases to estimate the number of expected disease cases for each NBS suspect case. To assess the impact of filtering results on the sensitivity and PPV, we determined the sensitivity and PPV of the unfiltered NBS laboratory reports, which include all WNV test types, negative results, and multiple reports from individual patients.
To evaluate the timing of reporting events, we assessed matched cases with available reporting dates. We defined the lead time as the difference between the date an NBS suspect case was entered into NBS and the date it was reported as a WNV disease case. We defined the lag time as the difference between the date of a WNV disease case symptom onset and the date an NBS suspect case was entered into NBS.
We assessed the distributions of WNV disease cases vs. NBS suspect cases, by graphing NBS suspect cases by date reported and WNV disease cases by date of illness onset and date of report to Texas DSHS. Dates were plotted by week because of marked fluctuations in daily data, especially for electronic laboratory reports, which reflect days that laboratories perform tests and report results.
For laboratory report lead and lag times, we determined median and interquartile range (IQR). Wilcoxon rank sum test was used to compare lead and lag times for electronic vs. manual laboratory reports and lag times for 2012 vs. other years. Linear regression was used to examine trends in lead time by year and the number of cases per year; logistic regression was used to examine trends in electronic reporting over time; and the Cochran–Armitage trend test was used to examine trends in sensitivity and PPV over time. All analyses were performed using SAS 9.2 and a two-sided P < 0·05 was used to determine statistical significance.
RESULTS
Case identification and characterization
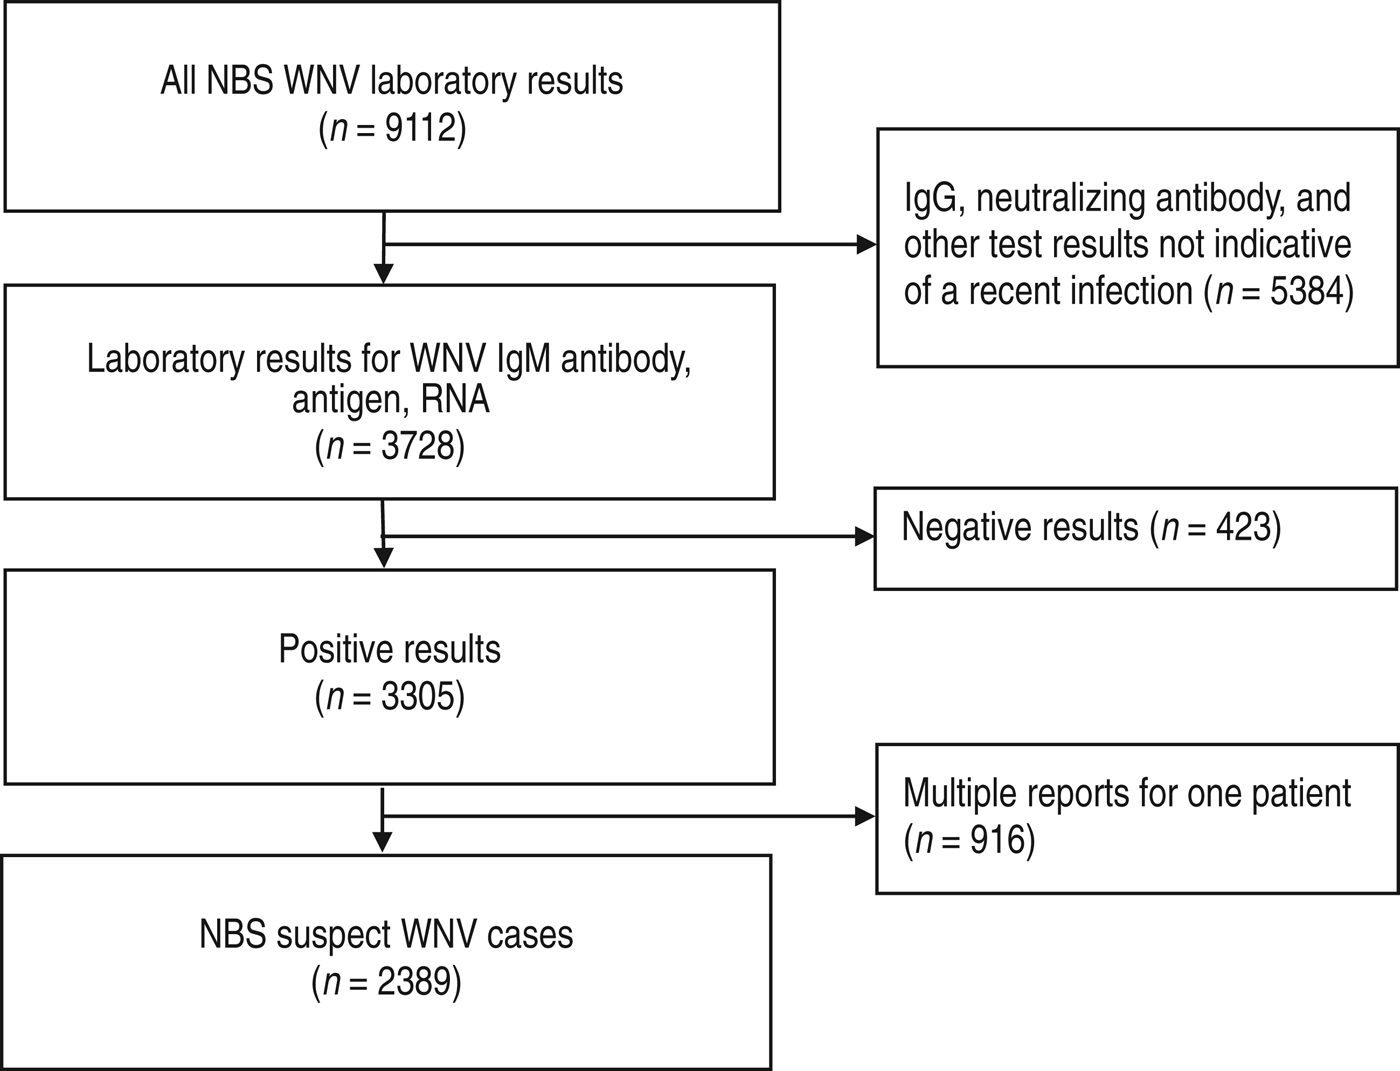
From 2008 to 2012, a total of 9112 WNV test results were reported to NBS in Texas (Fig. 1). Of those, 3728 (41%) were results for test types that are consistent with recent WNV infection, including 3613 IgM antibody, 115 RNA, and no viral antigen tests based on LOINC codes. The remaining 5384 (59%) WNV test results had insufficient evidence of recent infection. These included 5231 IgG antibody results and 153 results that represented other test types that could not be classified based on the LOINC code alone. Of the 3728 results for test types used to identify recent infections, 423 (11%) reports represented negative results that were entered along with a positive result (e.g. negative IgM and positive IgG results) from the same patient and 916 (25%) reports represented multiple reports from the same patient.
National Electronic Disease Surveillance System Base System (NBS) suspect West Nile virus (WNV) cases identified from laboratory results, Texas, 2008–2012.
After removing negative and duplicate reports, the individuals with the remaining 2389 reports were classified as NBS suspect WNV cases; of these, 2142 (90%) were reported electronically (Table 1). The proportion of NBS suspect WNV cases reported electronically each year did not change over the 5-year period (median 90%, range 86–98%; P = 0·77). During the same time period that the 2389 suspect cases were reported to NBS, 2161 WNV disease cases were reported to Texas DSHS (Table 1). The majority of both NBS suspect cases (88%, 2108/2389) and WNV disease cases (86%, 1865/2161) during the 5-year time period were reported during 2012.
Sensitivity and positive predictive value (PPV) of West Nile virus (WNV) suspect cases reported to the National Electronic Disease Surveillance System Base System (NBS) compared to WNV disease cases reported to the Texas Department of State Health Services (DSHS), by year, Texas, 2008–2012
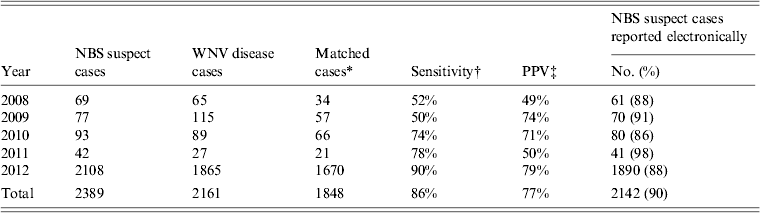
* A person who was an NBS suspect case and was also reported to Texas DSHS as a WNV disease case.
† Sensitivity = matched cases/all WNV disease cases reported to Texas DSHS.
‡ PPV = matched cases/all NBS suspect cases.
Sensitivity and PPV for NBS suspect cases
Of the 2161 WNV disease cases and 2389 NBS suspect cases, 1848 were present in both systems, 541 NBS suspect cases were not reported as WNV disease cases, and 313 WNV disease cases were not NBS suspect cases. Given this, the sensitivity of NBS reports was 86% (1848/2161) and the PPV of NBS reports was 77% (1848/2389) (Table 1). Sensitivity increased during the study period, from 52% in 2008 to 90% in 2012 (P < 0·01). PPV also increased during the study period, from 49% in 2008 to 79% in 2012 (P < 0·01). Using the ratio of NBS suspect cases to WNV disease cases, we estimate that for every 10 suspect cases reported to NBS, 9·0 [95% confidence interval (CI) 8·9–9·2] WNV disease cases were reported to Texas DSHS.
We also examined the impact that filtering NBS laboratory reports had on sensitivity and PPV. When all 9112 WNV laboratory reports to NBS from 2008 to 2012 were used, including all test types, positives, negatives, and multiple tests for the same patient, the sensitivity for identifying WNV disease cases remained stable at 88% (1892/2161) but the PPV decreased substantially to 21% (1892/9112). As a result, for every 10 WNV laboratory reports to NBS, only 2·4 (95% CI 2·3–2·5) WNV disease cases were reported to Texas DSHS.
Lead and lag times
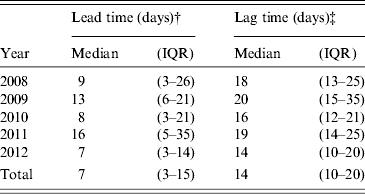
Of 1846 cases that were reported to both systems and had available reporting dates, WNV laboratory results were reported to NBS with a median lead time of 7 days (IQR 3–15 days) before the corresponding disease case was reported to Texas DSHS (Table 2). Although some laboratory results were reported to NBS after the case report, most (94%, 1726/1846) laboratory results were entered prior to the case report. The lead time from NBS report to when a case was reported to DSHS did not change over the period from 2008 to 2012 (P = 0·49) and was not associated with the number of disease cases reported in a given year (P = 0·37). Electronic laboratory reports provided a longer lead time (median 8 days, IQR 4–16 days) than manually entered reports (median 2 days, IQR 0–4 days; P < 0·01).
Lead time and lag time for matched cases by year, Texas, 2008–2012*
IQR, Interquartile range.
* A matched case was defined as a person who was a National Electronic Disease Surveillance System Base System (NBS) suspect case and was also reported to Texas Department of State Health Services as a West Nile virus (WNV) disease case.
† Lead time was the difference between the date a National Electronic Disease Surveillance System Base System (NBS) suspect case was entered into NBS and the date it was reported as a WNV disease case.
‡ Lag time was the difference between the date of a WNV disease case symptom onset and the date an NBS suspect case was entered into NBS.
Of 1847 matched cases that had a recorded date of onset in the Texas DSHS dataset and a reporting date in NBS, the median lag time between illness onset and reporting of a laboratory result to NBS was 14 days (IQR 10–20 days) (Table 2). The lag time was significantly shorter in 2012 (median 14 days, IQR 10–20 days) compared to previous years (median 18 days, IQR 13–25 days; P < 0·01). Electronic laboratory reports also provided a shorter lag time (median 14 days, IQR 10–20 days) than manually entered reports (median 19 days, IQR 13–29 days; P < 0·01). Overall, the median time from illness onset to specimen collection was 7 days (IQR 4–12 days). There was a median of 5 days (IQR 4–7 days) from specimen collection until a laboratory result was available and a median of only 1 day (IQR 0–2 days) from when the laboratory result was available until it was reported to NBS. The time from illness onset to reporting of results to NBS was the same for patients with neuroinvasive disease (i.e. meningitis, encephalitis, or acute flaccid paralysis) (median 14 days, IQR 10–20 days) and non-neuroinvasive disease (e.g. WNV fever) (median 14 days, IQR 10–21 days). However, the time from illness onset to specimen collection was shorter for neuroinvasive disease cases (median 6 days, IQR 3–10 days) compared to non-neuroinvasive disease cases (median 7 days, IQR 4–13 days; P < 0·01).
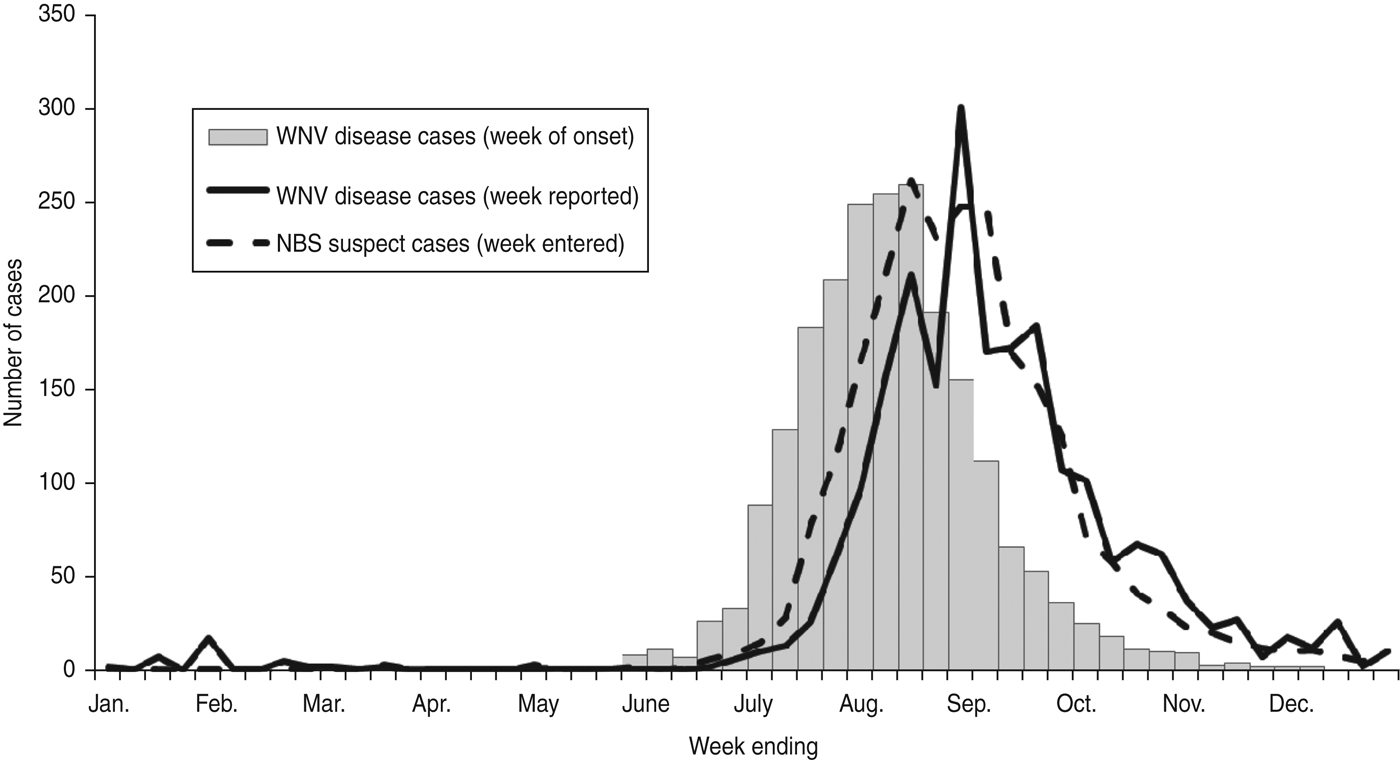
The distribution of NBS suspect cases by week reported was similar to the distribution of WNV disease cases by week of illness onset with the laboratory reports shifted later by ~2 weeks due to the lag time (Fig. 2). NBS suspect cases also had a similar distribution to WNV disease cases by week reported to Texas DSHS with the laboratory reports preceding the case reports by ~1 week due to the lead time.
West Nile virus (WNV) disease cases by week of onset and week reported and National Electronic Disease Surveillance System Base System (NBS) suspect cases by week entered, Texas, 2008–2012.
DISCUSSION
We found that NBS laboratory reports were useful surrogates for WNV disease cases that have already occurred and will be reported to Texas DSHS. From 2008 to 2012, most of the WNV disease cases reported to Texas DSHS had a corresponding NBS laboratory report. Laboratory reports provided ~1 week lead time for information about both the number and distribution of subsequent WNV disease cases. The data were most useful after being filtered to eliminate laboratory reports that did not satisfy the criteria of the case definition. Because filtering NBS laboratory results did not substantially alter the sensitivity but greatly improved the PPV, we recommend filtering NBS laboratory results before using them to assess disease trends. Using unfiltered data would be expected to substantially overestimate the subsequent number of WNV disease cases that might be expected. This finding also highlights the fact that positive IgG antibodies alone are evidence of previous and not recent infection and do not meet the criteria for the national surveillance case definition for WNV disease [9].
The PPV of NBS laboratory reports in this analysis (77%) was lower than a previous study which found a PPV of 85% for laboratory reports from a managed care organization in California for seven notifiable conditions (Campylobacter jejuni, Chlamydia trachomatis, Cryptosporidium parvum, hepatitis A, Neisseria meningitidis, Neisseria gonorrhoeae, Salmonella spp.) [Reference Backer, Bissell and Vugia13]. In that study, they found the PPV was decreased by patients with positive laboratory results who were not reported to the state health department as disease cases due to laboratory reporting errors, data-entry errors, failures to share information between county health departments, and disease coding. While we did not have this type of information for WNV laboratory reports, these same errors may have occurred and reduced the PPV of the NBS reports. Conversely, a study that evaluated laboratory reports for Lyme disease in New Jersey found a PPV of only 18% suggesting that laboratory reports may be poor surrogates for cases in diseases with complex case definitions and laboratory confirmation requirements [14]. The national surveillance case definition for WNV includes both clinical and laboratory criteria [9].
Our finding that electronically submitted laboratory results provided more lead time than manually entered results is consistent with the results of two previous studies. In Hawaii, electronic laboratory reports for five notifiable conditions (Salmonella spp., Shigella spp., Giardia spp., vancomycin-resistant enterococcus, Streptococcus pneumoniae) were submitted 4 days (95% CI 3–5 days) faster than paper reports [Reference Effler15]. Similarly, reporting of sexually transmitted infections, tuberculosis, and other communicable diseases to the New York City Department of Health and Mental Hygiene improved by a median of 11 days (range 3–42 days) when electronic laboratory reporting was used [Reference Nguyen16]. Increases in the proportion of laboratories using electronic reporting and sharing data electronically between health departments will likely decrease data errors and loss, and potentially improve both PPV and the lead time provided by laboratory reports [Reference Backer, Bissell and Vugia13, Reference Effler15, Reference Nguyen16]. However, laboratory reports alone lack some of the information gathered during traditional case reporting, such as symptoms, clinical syndrome, and outcome. The sensitivity and PPV of NBS reports both increased over time, causing the expected number of WNV disease cases for each NBS suspect case to remain relatively constant. However, this measure should be periodically re-evaluated as it may be affected by changes in Texas's electronic surveillance system [11].
Although we did not observe any trends in the lead time from laboratory result report date to disease case report date by year or the number of cases in a year, the median lag time from onset of illness to laboratory result report date was 4 days shorter in 2012 compared to previous years. This may be due to patients seeking care or healthcare providers ordering WNV testing earlier in the course of illness because of increased awareness of the disease during a large outbreak, or because of changes in laboratory testing schedules due to an increase in WNV test orders. In fact, with electronic laboratory reporting the rate-limiting steps in the timeliness of receiving results appear to be the time it takes for people to seek care, healthcare providers to order tests, and the laboratory to complete the testing. Patients with neuroinvasive disease appear to seek care or have laboratory tests ordered earlier in their course of illness but the difference is small and does not significantly impact the time to reporting of results. Laboratory test orders and results should be evaluated further to determine if they provide an early indicator of where WNV activity is occurring or when a seasonal outbreak has peaked.
This study was subject to at least several limitations. The results of this study may not be generalizable to other diseases investigated by Texas DSHS or to other states with different processes for investigating and reporting suspect WNV disease cases. We were also unable to classify all WNV laboratory results as to whether they provided sufficient evidence of recent infection, so some NBS suspect cases may have been missed. The lack of a common patient or sample identifier in the reporting systems could have led to errors in matching NBS laboratory reports and WNV disease cases. The relatively small numbers of cases reported from 2008 to 2011 might have impacted the precision of sensitivity and PPV calculations for those years. Finally, there was a lack of information on NBS suspect cases that were not reported as WNV disease cases and WNV disease cases that did not have NBS reports, so we were unable to assess these data for errors or find ways to improve the sensitivity or PPV of the system.
At least 42 states now have the capacity to receive electronic laboratory reports [11]. This number is expected to rise as more states comply with Centers for Medicare and Medicaid Services rules for meaningful use of health information technology. Therefore, electronic laboratory reports could increasingly be used to complement traditional case-reporting systems and provide more timely information about disease trends and outbreaks. We found that NBS laboratory reports could provide timely information about disease trends and may be useful during outbreaks for making decisions about public health interventions, such as insecticide spraying. Further analysis is warranted for WNV and other diseases and systems in other states to explore the usefulness and limitations of electronic laboratory reports as a complementary approach to infectious disease surveillance for the timely detection of cases.
ACKNOWLEDGEMENTS
We thank Doug Hamaker, Jim Schuermann, and Dawn Hesalroad for their assistance with this analysis. The findings and conclusions of this report are those of the authors and do not necessarily represent the views of the Centers for Disease Control and Prevention.
DECLARATION OF INTEREST
None.



