INTRODUCTION
Powdery mildew is one of the most devastating foliar diseases suffered by wheat (Godoy et al. Reference Godoy, Lazzaro, Casalongué and Segundo2000; Sancho et al. Reference Sancho, Gillabert, Tapp, Shewry, Skeggs and Mills2008; Maxwell et al. Reference Maxwell, Lyerly, Cowger, Marshall, Brown Guedira and Murphy2009). It changes the translocation and distribution of photosynthate, leads to leaf senescence and hence causes yield reduction (Daamen & Jorritsma Reference Daamen and Jorritsma1990; Hall & Williams Reference Hall and Williams2000; Sutton et al. Reference Sutton, Gilbert, Williams and Hall2007). Wheat powdery mildew can also exert a far-reaching influence on the source–sink relationship of wheat (Sutton et al. Reference Sutton, Gilbert, Williams and Hall2007). Previous studies on the disease have focused mainly on photosynthesis and metabolism of the leaves and shoots, as well as on yield change (James & Shih Reference James and Shih1972; Johnson et al. Reference Johnson, Baenziger, Yamazaki and Smith1979; Zheng et al. Reference Zheng, Huang and Yu2008; Ronis et al. Reference Ronis, Semaškienė, Dabkevičius and Liatukas2009). All of the mechanisms developed by sink organs in response to stress are finally expressed in the accumulation of proteins (Altenbach Reference Altenbach2012). Stress curtails assimilate supply during grain filling, and the level of substrate supply determines grain protein deposition (Jenner et al. Reference Jenner, Ugalde and Aspinall1991; Panozzo & Eagles Reference Panozzo and Eagles1999). Since grain proteins are crucial for crop quality (Altenbach Reference Altenbach2012), the effects of environment (such as drought, high temperature and nitrogen (N) fertilizer) on grain protein concentration (GPC) and protein composition as well as their accumulation have been investigated (Johansson et al. Reference Johansson, Oscarson, Heneen and Lundborg1994; Gupta et al. Reference Gupta, Masci, Lafiandra, Bariana and MacRitchie1996; Panozzo et al. Reference Panozzo, Eagles and Wootton2001; Triboï et al. Reference Triboï, Martre and Triboï-Blondel2003). However, a few studies have investigated the effects of the biotic stress powdery mildew on GPC (Johnson et al. Reference Johnson, Baenziger, Yamazaki and Smith1979; Smedegaard-Petersen & Stølen Reference Smedegaard-Petersen and Stølen1981). Moreover, little information is available in the literature on the influence of powdery mildew on synthesis of wheat proteins and the mechanisms involved. The study by Johnson et al. (Reference Johnson, Baenziger, Yamazaki and Smith1979) showed that a near-isogenic line of wheat, ‘Chancellor,’ exhibited a negative correlation between flour protein concentration and disease severity. Another study also indicated a reduction of GPC in powdery-mildew-infected barley (Smedegaard-Petersen & Stølen Reference Smedegaard-Petersen and Stølen1981). It was further found that GPC could be raised by employing measures used to control powdery mildew (such as fungicides). Therefore, it was inferred that powdery mildew could cause a GPC decrease in wheat (Gooding et al. Reference Gooding, Davies, Thompson and Smith1993, Reference Gooding, Smith, Davies and Kettlewell1994; Dimmock & Gooding Reference Dimmock and Gooding2002). Related historical research concerning the change of GPC in the wake of powdery mildew control has not always delivered consistent conclusions. Knowledge is limited on protein accumulation in grains of wheat and the direct effects on GPC under powdery mildew stress. It is known that some proteins (including enzymes involving in different metabolic pathways) may be involved in stress responses (Majoul et al. Reference Majoul, Bancel, Triboï, Ben Hamida and Branlard2003). This suggested that it may be useful to study the role of grain non-prolamins (albumins and globulins) in the response of wheat to powdery mildew stress. In the present study, the expression pattern of non-prolamins in wheat at specific growth stages under powdery mildew stress was investigated using two-dimensional gel electrophoresis (2-DE) and tandem mass spectrometry (MS/MS). Meanwhile, more detailed analysis was carried out on proteins and their components’ accumulation during these periods. The present research attempted to provide useful molecular information for understanding the response of grain protein to wheat powdery mildew stress.
MATERIALS AND METHODS
Experimental design and field management
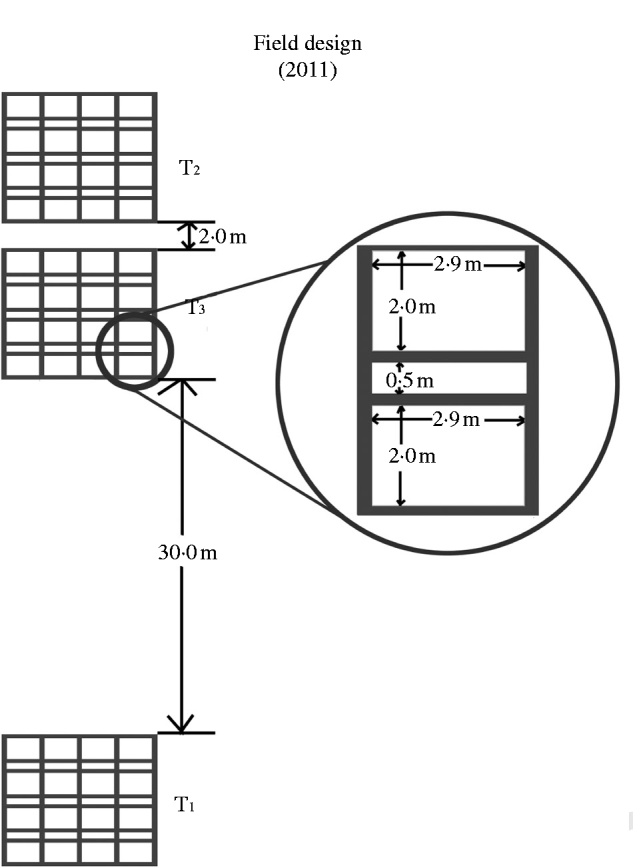
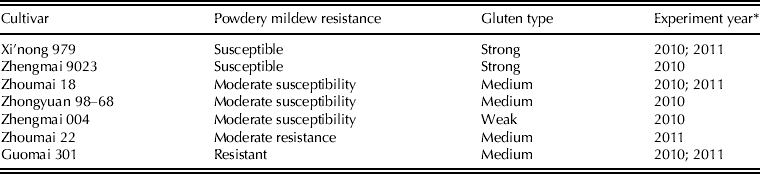
Experiments were conducted at the Science Education Experimental Park of Henan Agricultural University (34°51′N, 113°35′E, 95 m asl) in the 2009/10 and 2010/11 seasons (hereafter identified as 2010 and 2011, respectively). The preceding crop in both seasons was soybean. The experimental site was characterized by loam soils, pH = 7·8. Organic matter, total N, rapidly available phosphorous (P) and rapidly available potassium (K) in the upper 300 mm of soil were 11·6 g/kg, 0·99 g/kg, 18 mg/kg and 163 mg/kg, respectively. Seeds were sown on 15 October following soybean harvest in both years and the planting density was 2 400 000 seeds/ha. The following treatments were conducted in a split-plot design with four replications. The main treatment was powdery mildew severity, which was respectively marked as T1, T2 and T3, with T1 being the control. Beginning from the 20 April, T2 was artificially inoculated every 2 days for a total of nine times, by two methods. For the first method, pots prepared with infected seedlings were placed in the experimental plot (1 pot/plot) to initiate disease development, and were watered to maintain the seedlings and provide a constant supply of spores. For the second method, several infected wheat leaves were scattered in the experimental area. The T3 treatment was artificially inoculated once on 6 May by scattering several infected wheat leaves in the experimental area. The sub-plot was wheat cultivar (Table 1), planted in an area of 2 × 2·9 m, and 1 m apart. A number of powdery-mildew susceptible and resistant cultivars were used in 2010. Five susceptible cultivars with different quality characteristics were selected: Xi'nong 979 and Zhengmai 9023 (strong gluten), Zhoumai 18 and Zhongyuan 98–68 (moderate gluten strength) and Zhengmai 004 (weak gluten). A relatively new cultivar, Guomai 301, bred by the National Centre of Engineering and Technological Research for Wheat, Henan, People's Republic of China, was selected as a control with a high level of resistance to powdery mildew. In 2011 the two susceptible cultivars Xi'nong 979 and Zhoumai 18, together with the resistant cultivars Guomai 301 and Zhoumai 22, which was reported to be highly resistant to powdery mildew (Xu et al. Reference Xu, Li, Hu, Zhang, Zhang, Dong and Wang2010) were used. In T2 and T3, ‘inducing’ lines of Xi'nong 979 (which has high susceptibility and can supply spores continuously when infected by Bgt) were placed to a width of 0·5 m (so as to fully induce the disease) in the 1 m gap. In T1, separation lines to a width of 0·5 m of the resistant cultivar Guomai 301 were planted to prevent the spread of spores. For the main treatments, blocks were arranged in the order T1, T3 and T2, from south to north. The T1 and T3 treatments were planted 30 m apart while T3 and T2 were 2 m apart (Fig. 1). Guomai 301 was grown as separation lines between T1 and T3, and between T3 and T2 in addition to which four layers of 1·4 m high cotton cloth were set up as separation screens. Fertilization was conducted at the rate of 225 kg N/ha, 100·4 kg P2O5/ha and 112·5 kg K2O/ha. All the P, K and half of N was applied as base fertilizer, and other half of N was applied at the start of stem elongation, i.e. GS 31 (Zadoks et al. Reference Zadoks, Chang and Konzak1974). Irrigation was performed three times, spray irrigation was adopted prior to winter (GS 16), while flood irrigation was adopted at both the start of stem elongation (GS 31) and booting stages (GS 43). Weeds were controlled by hand weeding and no fungicides were used. The pesticide Bichonlin (Imidacloprid) was used as necessary to minimize the effects of pests.
Field design showing arrangement of main treatments T1, T2 and T3.

Description of the cultivars used in the study
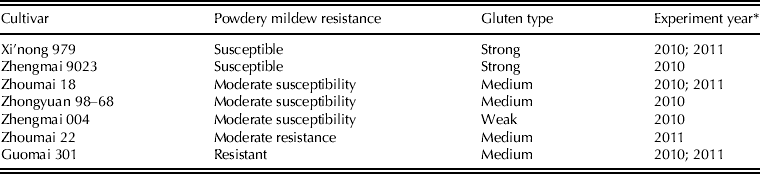
* 2010 represents cultivars grown in the 2009/10 season; 2011 represents cultivars grown in the 2010/11 season.
Assessment and control of powdery mildew severity in the field
Disease was assessed every 7 days after anthesis (DAA), four times in all, on 30 plants chosen by a five-point sampling method of each treatment combination as proposed by Li et al. (Reference Li, Jia, Wang, Duan, Zhou, Wang and Lu2012). At 21 DAA when the disease reached its full severity, the number of plants assessed from each treatment combination was increased to 60. A modified 0–9 scale method (0 = no infection and 9 = severe infection) was adopted for the assessment (Sheng & Duan Reference Sheng and Duan1991). This method may be expressed by the formula:
 $$ {\rm DI} = \displaystyle{{0 \times { n}_0 + 1 \times {n}_1 + {\cdots} + 9 \times {n}_9} \over ({{n_0} + {n_1} \plus {\cdots} + {n_9} {\rm )} \times {\rm the}\;{\rm highest}\;{\rm disease}\;{\rm grade}}} \times {100}$$
where n 0, n 1, …, n 9 represents number of the leaves with disease severity grade 0, 1, …, 9 respectively.
Sampling method
During the flowering period, representative and even-sized wheat ears that started to flower on the same day were marked. At anthesis, these marked ears were sampled and grains were removed every 5 days until maturity. Samples that were used for protein content and component content analysis were oven-dried immediately at 105 °C for 15 min to inactivate metabolic enzymes and then further dried at 80 °C to constant weight and ground with a small grinder, filtered through an 80-mesh (180 μm) screen and then preserved at 4 °C in a refrigerator. The sample of Xi'nong 979, for the analysis of non-prolamins, was quick-frozen in liquid N after hand threshing and then preserved at −80 °C in a refrigerator. Xi'nong 979 was used because it suffered the severest infection and showed the greatest increase in prolamin levels: the aim was to examine how powdery mildew affected prolamin by modifying non-prolamin. At maturity, all crops were harvested by hand and the total yield (t/ha) was calculated.
Protein composition analysis
The continuous concussion method was used for the analysis of wheat grain protein composition (Zhou et al. Reference Zhou, Jiang, Dai, Jing and Cao2006). The Kjeldahl method was used to determine the N content of all components, as well as the total N content. Protein concentration was calculated by multiplying N content by 5·7.
Prolamin analysis
Acid polyacrylamide gel electrophoresis (A-PAGE) was adopted for analysis of the gliadin content (Metakovsky et al. Reference Metakovsky, Akhmedov and Sozinov1986) and sodium dodecyl sulphate–PAGE (SDS–PAGE) was used for analysis of the wheat glutenin content (Liu et al. Reference Liu, Zhou, He, Wang, Zhang and Pefia2004). During the early period of grain filling, the gliadin and glutenin contents were relatively low and as a result, the amounts of samples used were increased such that the spectra would be clear and could therefore be photographed by the gel imaging system. Then, the quantities were determined.
Non-prolamin analysis
2-DE was used for non-prolamin analysis (Gao et al. Reference Gao, Wang, Li, Dong, Wang, Appels, Ma and Yan2009). For the purpose of a tandem mass spectrum analysis, significantly different spots with good repeatability were sorted out by comparison and analysis using PDQuest 2-DE software. If the data for the Total Ion Score confidence interval (CI) (second level) or Protein Score CI (first level) in the Excel table reached 0·95, the identification could be considered successful.
Statistical methods
All data were subjected to General Linear Model analysis of variance (ANOVA) and Pearson correlations using the SPSS 17.0 software (SPSS Institute Inc.). Duncan's Multiple Range Test was used to compare the differences among means of all treatments and calculate the standard errors of differences (s.e.d.). All determinations were replicated three times.
RESULTS
Disease assessment
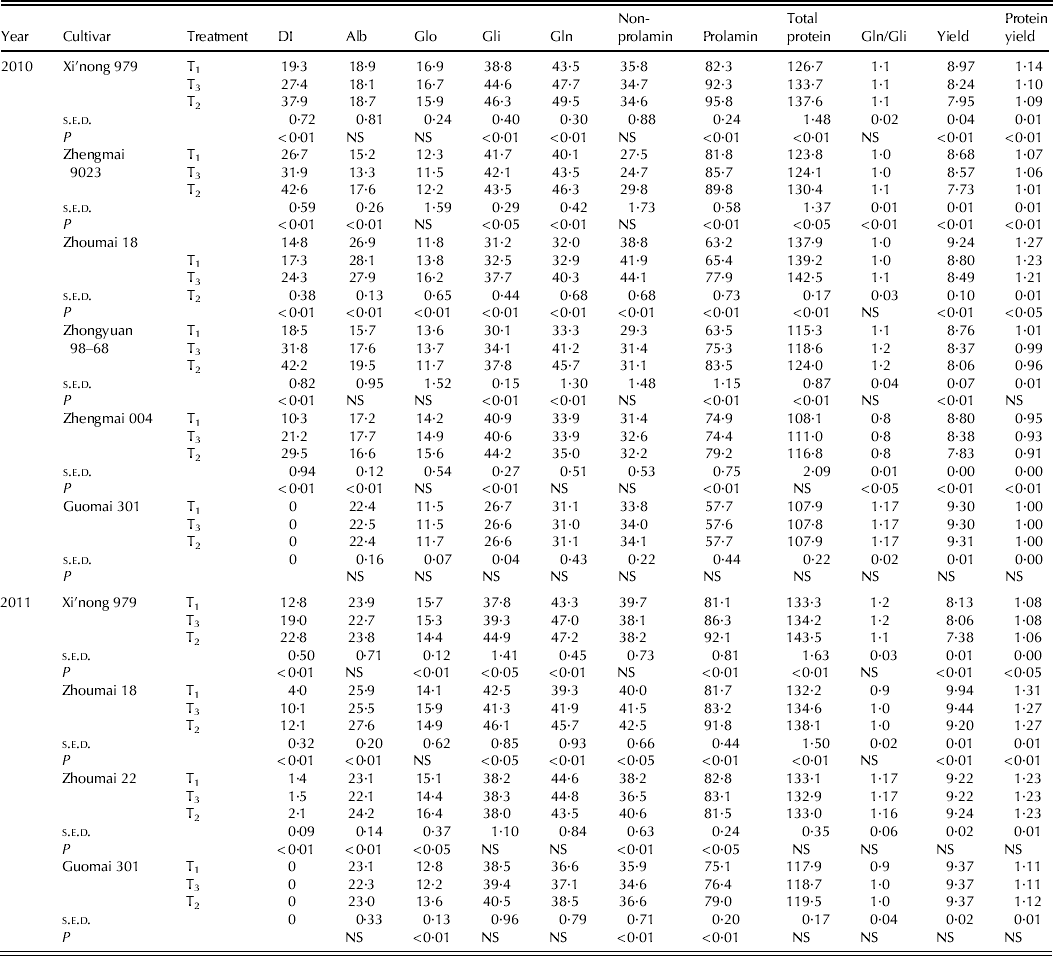
Little evidence of disease was found on the leaves of the resistant cultivars Guomai 301 and Zhoumai 22. Guomai 301 was resistant to powdery mildew, and the small number of white spots found on a few leaves showed signs of local necrosis. The severity index of the susceptible cultivars was significantly different between treatments (P < 0·01) (Table 2). By the end of 2010, no disease had been found on wheat ears. In 2011, only one or two tiller ears in specific plots were found to be infected with the disease, whereas no disease was found on other ears. In 2009/10 and 2010/11, the weather was cold and dry in March and April, and powdery mildew did not break out in the fields. The severities of the three main treatments in the artificially inoculated susceptible cultivars exhibited a significant increase (T2 > T3 > T1) (P<0·01) (Table 2).
Variation in wheat grain protein composition (mg/g) and yield (t/ha) under varying degrees of powdery mildew infection in 2010 and 2011. The s.e.d. are presented ( d.f. = 8) (DI = disease index; Alb = Albumin; Glo = Globulin; Gli = Gliadin; Gln = Glutenin; NS = not significant)
Effects of powdery mildew on wheat grain protein composition and accumulations
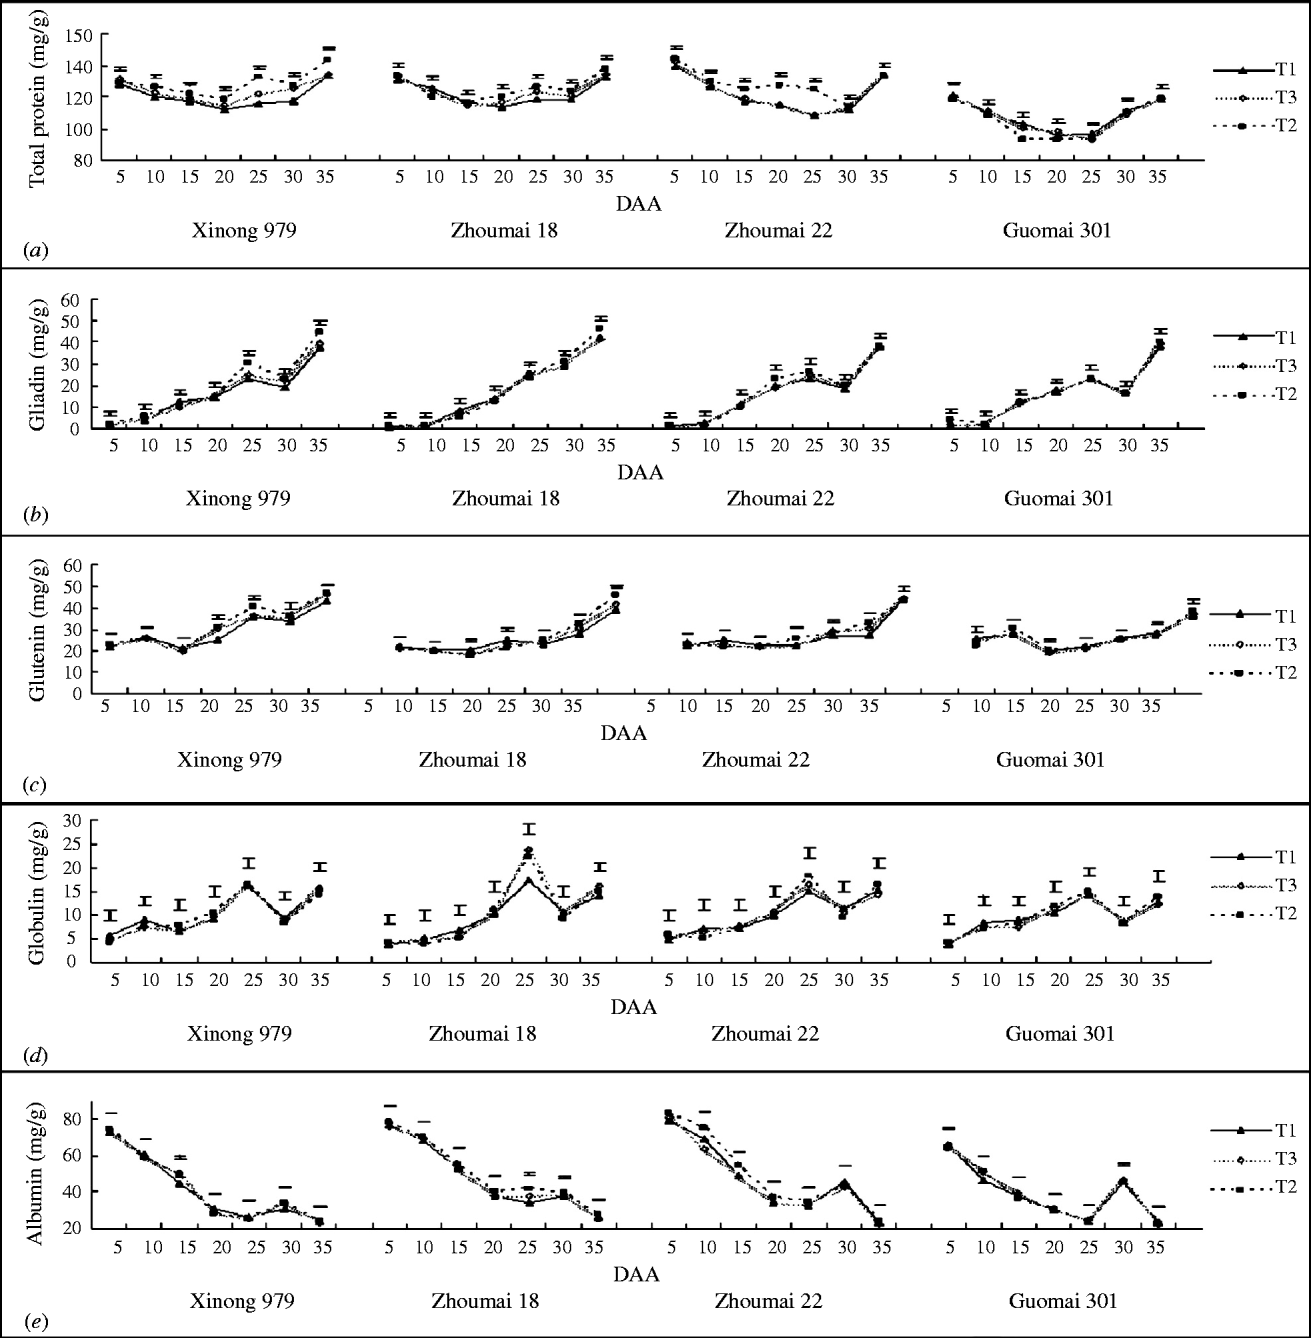
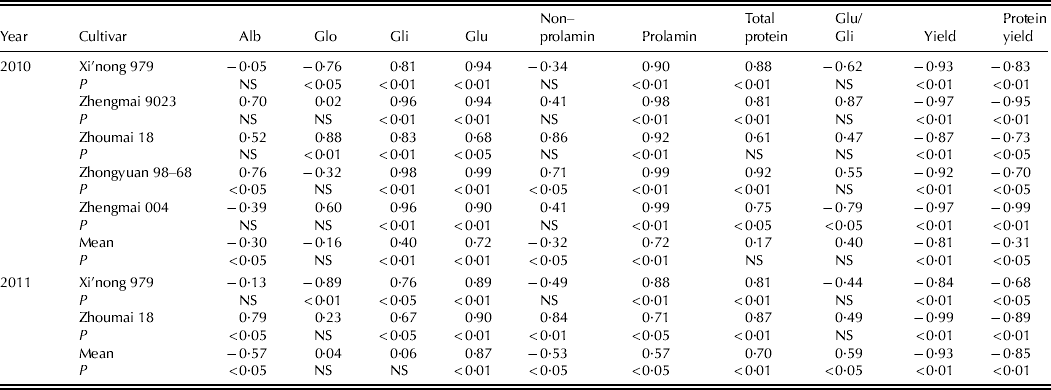
The 2-year results (Tables 2 and 3) showed that total protein and prolamin (gliadin and glutenin) concentration differences between the disease-resistant cultivars Zhoumai 22 and Guomai 301 were not significant. In the disease-susceptible cultivars (Xi'nong 979 and Zhoumai 18 in both years, Zhengmai 9023, Zhongyuan 98–68 and Zhengmai 004 in 2010), the prolamin concentration difference was significant (P < 0·01) and total protein concentration also increased, whereas the difference in non-prolamin (albumin and globulin) concentration was not significant. In the disease-susceptible cultivars mentioned above, prolamin concentration increased with an increase in powdery mildew severity. As shown by correlation analysis (Table 4), the concentration of glutenin correlated positively with disease index (DI) (2010: r = 0·72, P < 0·01; 2011: r = 0·87, P < 0·01); gliadin also demonstrated a positive correlation with DI, and reached a significant level in 2011 (r = 0·40, P < 0·01); prolamin concentration was positively correlated with DI (2010: r = 0·72, P < 0·01; 2011: r = 0·57, P < 0·05), as was the concentration of total protein, which reached a significant level in 2011 (r = 0·70, P < 0·01). Therefore, the correlations of non-prolamin concentration with DI were not significant within cultivars. However, for all cultivars and years, the correlation of yield with DI was strongly negative (2010: r = − 0·81, P < 0·01; 2011: r = − 0·93, P < 0·01) (Table 4). Variations of the protein concentrations in wheat grains under different treatments were basically uniform in a ‘high–low–high’ V-shaped trend (Fig. 2a). The accumulation characteristics of the susceptible cultivars in 2010 (Xi'nong 979 and Zhoumai 18) showed a W-shaped variation trend, i.e. at 20–25 DAA there was a peak, which was significantly higher than the control. Furthermore, the increasing trend continued from 20 to 25 DAA up to maturity. An interesting point was that the resistant cultivar Zhoumai 22 under T2 treatment exhibited an increase in accumulation characteristics at 20–25 DAA similar to the sensitive cultivars, yet a fewer changes were seen from 30 DAA until maturity.
Protein accumulation in different cultivars infected to different degrees with powdery mildew at various growth stages. Error bars indicate s.e.d.
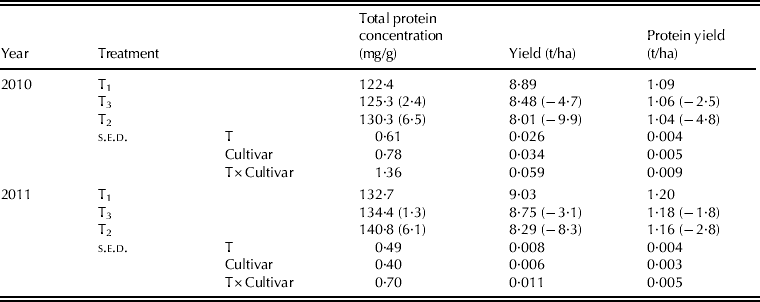
Mean values and s.e.d. of yield and GPC for wheat cultivars grown in response to differing powdery mildew disease infection in 2010 ( d.f. = 44) and 2011 ( d.f. = 17); numbers in parentheses indicate the percentage change with respect to the control (T1).
Correlations of concentrations of wheat grain protein composition in seven wheat cultivars with powdery mildew DIs in both 2010 and 2011.
Effects of powdery mildew on grain gliadin and glutenin accumulation
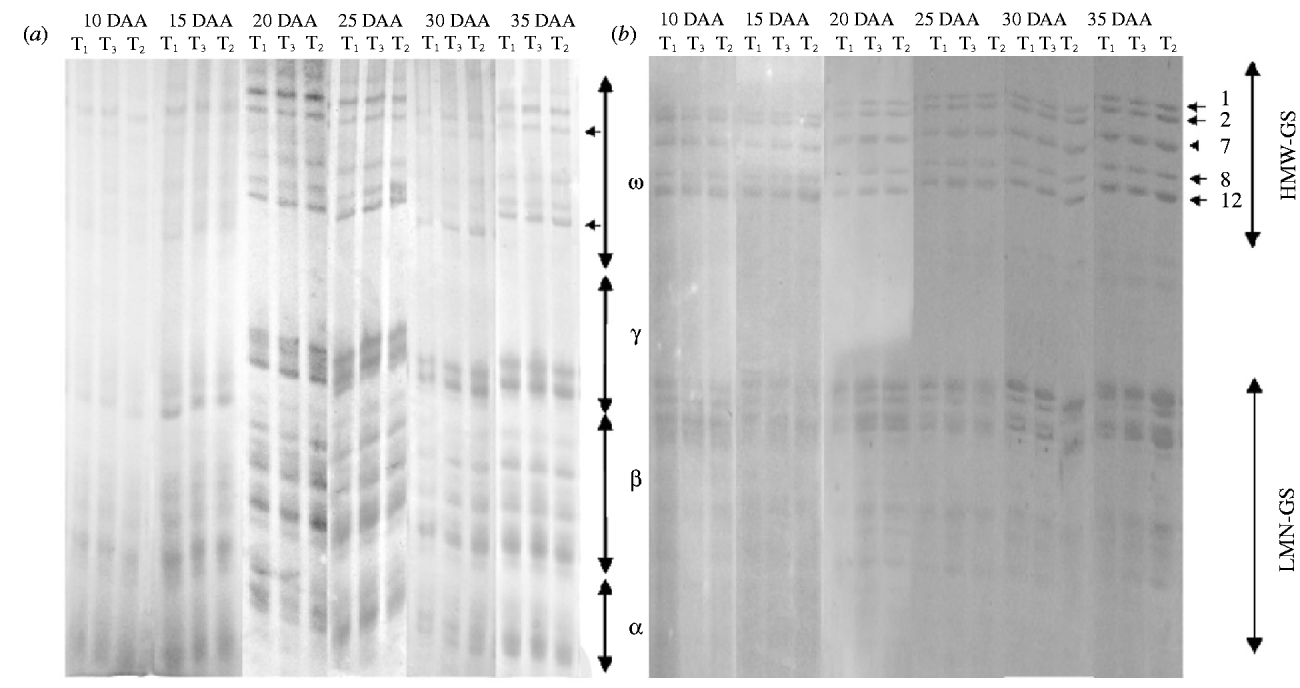
The gliadin and glutenin concentrations were very low during the 15 days post-flowering, but began to increase significantly from 20 DAA (Figs 2b and c). No difference was found between the three treatments in the disease-resistant wheat cultivar Guomai 301. However, in the disease-susceptible cultivars (Xi'nong 979 and Zhoumai 18), the T3 and T2 treatments had significantly higher accumulation of gliadins and glutenins than those found in the control and levels increased with the increase of DI, but the glutenin/gliadin ratio did not change significantly, which revealed that expression of the genes for the gliadins and glutenins was co-ordinately regulated. Further analysis on gliadin and glutenin accumulation yielded from A-PAGE and SDS–PAGE methods showed consistent results in variation trends. Among these results, the ω-gliadins, as a proportion of total gliadin content, increased significantly after 25 DAA when powdery mildew reached the highest severity and the high molecular weight glutenin subunits (HMW-GS), as a proportion of total glutenin content, also increased during 30–35 DAA, and especially at 35 DAA. The difference was most noticeable in Xi'nong 979 (Figs 3a and b), which displayed higher concentrations of gliadin and glutenin in T2 and T3 than in T1 from 20 DAA until maturity. Overall, prolamin concentration increased with the disease worsening after 20 DAA.
A-PAGE and SDS–PAGE analysis of (a) gliadin and (b) glutenin accumulation during grain filling in the cultivar Xi'nong 979.
Effects of powdery mildew on grain albumin and globulin accumulations
No difference was found in the variation of grain albumin accumulation in any treatments with increasing powdery mildew disease (Fig. 2d). Since albumins include enzymes and inhibitors of enzymes (Gao et al. Reference Gao, Wang, Li, Dong, Wang, Appels, Ma and Yan2009; Yang et al. Reference Yang, Jensen, Spliid, Svensson, Jacobsen, Jørgensen, Jørgensen, Collinge and Finnie2010), and the concentration of albumins did not change in the present study, it could therefore be inferred that the concentration of enzymes did not change. The globulin accumulation was different across all cultivars (Fig. 2e). All globulins increased at 20–25 DAA, when the disease became severe. With the development of grain and the dynamic change of severity of the powdery mildew disease, globulin accumulation showed an obvious increase at 20–25 DAA, which was the most severe period of the disease. From 30 DAA through to maturation, as the disease gradually disappeared, globulin concentration was gradually restored to a stable level. Therefore, the increase of GPC in Zhoumai 22 at 20–25 DAA may be attributable to the increase in globulin during the period.
Molecular mechanism of powdery mildew's effect on wheat prolamins
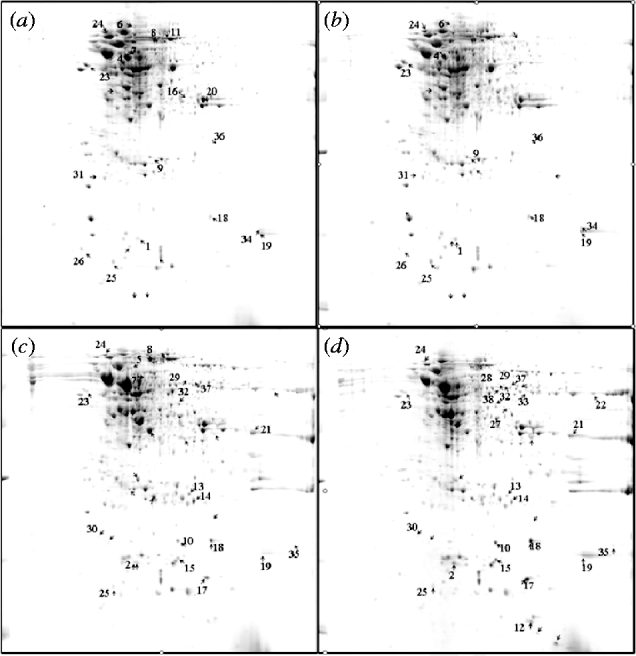
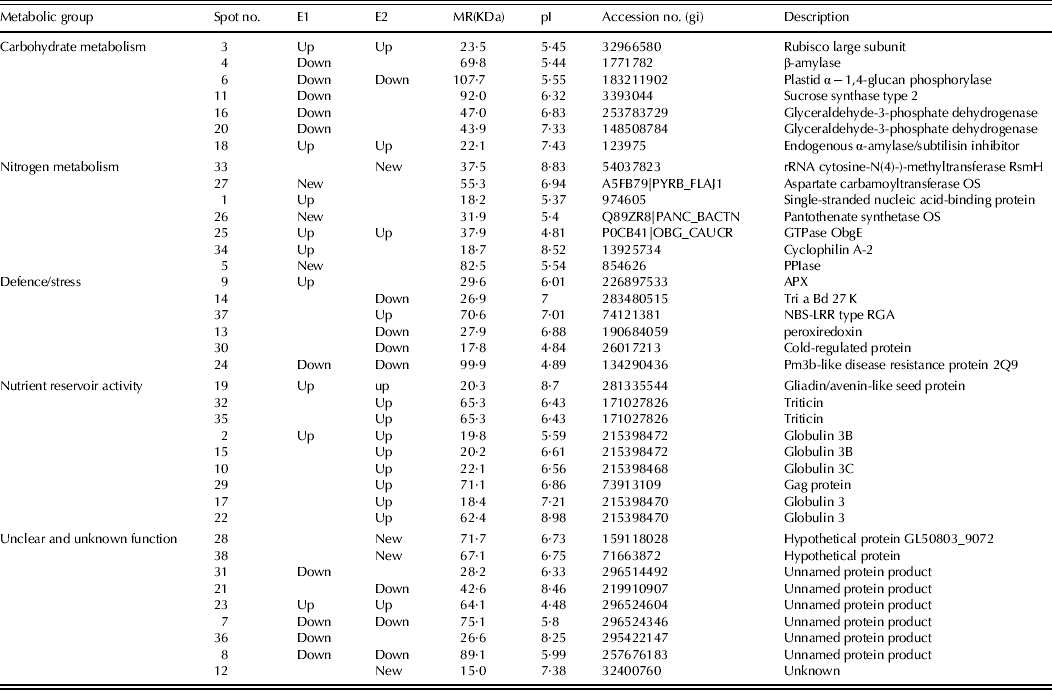
Comparison of the non-prolamin fraction in Xi'nong 979 grains at 10 and 25 DAA with the control and inoculated plants showed that the difference of protein expression was greater at 25 DAA than at 10 DAA (Fig. 4). A tandem mass spectrum analysis on different points detected 38 proteins, which fell into five function-based categories (Table 5): proteins taking part in energy and carbon metabolism (seven spots); proteins for N metabolism (seven spots); proteins related to stress defence (six spots); proteins of nutrient reservoir activity (mainly globulin, nine spots); and proteins of unknown function (nine spots). Among these, proteins taking part in N metabolism either showed up-regulation or were newly emerged. This indicated that the powdery mildew disease had promoted the synthesis of wheat grain proteins, which agreed with the rise in GPC during the same stage (Fig. 2). However, proteins involved with life processes such as glycolysis, starch biosynthesis and the tricarboxylic acid cycle (such as β-amylase (spot 4), plasmid α − 1, 4-glucosan phosphorylase (spot 6), Sucrose synthase type 2 (spot 11) and glyceraldehyde-3-phosphate dehydrogenase (spot 16, 20)), all showed down-regulation. This implied that the synthesis of starch in powdery mildew diseased wheat had been inhibited. Proteins involved in nutrition (avenin-like protein (spot 19), triticin (spot 32, 35) and globulin (spot 17, 22)) displayed up-regulation, showing that the disease infection promoted a huge globulin accumulation in wheat grains, which is consistent with the results from the Kjeldahl determination (Fig. 2).
2-DE analysis of non-prolamins in Xi'nong 979 at two growth stages (10 and 25 DAA) with different powdery mildew disease levels: (a) 10 DAA T1; (b) 10 DAA T2; (c) 25 DAA T1; (d) 25 DAA T2 (sample weight 600 μg). Protein spots highlighted with numbers were identified by secondary mass spectrum.
Proteins separated by 2-DE from grains of the cultivar Xi'nong 979 and identified by MS/MS (E1 = Expression pattern of 10 DAA; E2 = Expression pattern of 25 DAA)
pI, isoelectric point.
DISCUSSION
Little research has been done on the influence of wheat powdery mildew on grain quality. Relevant research has been conducted on the influence of disease stress on wheat leaves (Li et al. Reference Li, Chen, Li, Zhang and Tian2011), yet little information has been found on the wheat grain metabolism under stress conditions, as well as other diseases. Existing research that does focus upon this aspect has been conducted mainly on barley rather than on wheat (Jayasena et al. Reference Jayasena, van Burgel, Tanaka, Majewski and Loughman2007; Yang et al. Reference Yang, Jensen, Spliid, Svensson, Jacobsen, Jørgensen, Jørgensen, Collinge and Finnie2010). Considering this lack of information, the current study investigated differences from the norm shown in the expression and syntheses of non-prolamins in wheat grain under the stress of powdery mildew, aiming to gain an insight into the disease influence on protein synthesis and the mechanisms involved. Two stages (10 and 25 DAA) were selected for analysis and the results indicated that infection of powdery mildew had considerable influence on protein synthesis in wheat grains, and there were changes of protein type, accumulation and production. Further, enzymes that were related to protein synthesis increased or were newly emerged with disease progression. At 10 DAA, six proteins increased, whereas two proteins increased at 25 DAA, which were consistent with the rise in total protein concentration during the same period.
The accumulation of the different protein fractions is highly asynchronous (Triboï et al. Reference Triboï, Martre and Triboï-Blondel2003). In the present study, wheat grain contained predominantly non-prolamins until 20 DAA, and then prolamins accumulated rapidly from then to the end of grain-filling, which was similar to previous studies (Johansson et al. Reference Johansson, Oscarson, Heneen and Lundborg1994; Gupta et al. Reference Gupta, Masci, Lafiandra, Bariana and MacRitchie1996; Panozzo et al. Reference Panozzo, Eagles and Wootton2001). At 20 DAA, when the disease reached greatest severity in the field, prolamin accumulation increased and the concentration of non-prolamin decreased significantly. The prolamin concentration grew as the disease became more severe. A study on gibberellic disease in barley that used 2-DE analysis found no significant prolamin variations (Yang et al. Reference Yang, Jensen, Spliid, Svensson, Jacobsen, Jørgensen, Jørgensen, Collinge and Finnie2010). Due to the molecular weight and isoelectric point (pI) proximity of gliadin and glutenin, it is very difficult to distinguish the two using 2-DE (Altenbach Reference Altenbach2012). For this reason, it was decided to fractionally extract the totality of the two proteins for analysis in the present study. Although the difference between each of the proteins is small, a significant increase was displayed when evaluating the proteins in the concentrations of prolamins. An increase in protein concentration could conceivably be achieved in a number of ways (Bhullar & Jenner Reference Bhullar and Jenner1985), e.g. by increasing protein deposition or by decreasing starch deposition. Analysis of non-prolamin expression demonstrated that protein synthesis-related enzymes increased during Bgt infection. Previous studies have reported that peptidylprolyl isomerase (PPIase) can catalyse the isomerism of Xaa-Pro, whose activity is an important rate-limiting step in the folding of newly formed proteins (Galat Reference Galat1993). A typical regulator of prolamin deposition, cyclophilin A-2 can catalyse the conversion of the Xaa-Pro peptide bond (Johnson et al. Reference Johnson, Clarke and Bhave2001). Thus, the increase of GTPase ObgE, cyclophilin A-2 and PPIase found in the present study can partly confirm the increased protein synthesis. Similar conclusions have been drawn from research on Bgt infection in wheat leaves of the ‘Bainong’ near-isogenic line (Li et al. Reference Li, Chen, Li, Zhang and Tian2011). Wheat α-amylase/subtilisin inhibitor (WASI) can protect the serine protease suppressor protein and inhibit the degradation of prolamins by protease (Altenbach Reference Altenbach2012). In the present study, wheat endogenous α-amylase/subtilisin inhibitor increased as prolamins increased at both stages (10 and 25 DAA) of wheat growth. Studies have confirmed that when the grains were in a reducing state, the synthesis of protein was favoured, and reduction–oxidation factors could regulate the redox state via the conversion between mercaptan and disulphide bond (Wong et al. Reference Wong, Cai, Balmer, Tanaka, Vensel, Hurkman and Buchanan2004). Results of the present study showed that at 25 DAA, sulphiredoxin-related proteins (including peroxiredoxin and Tri a Bd 27 K) decreased. This suggested that redoxin demand decreased in grains of infected wheat, which was favourable for the synthesis and deposition of sulphur-rich proteins (such as low molecular weight gliadins) that contained structural disulphide bonds. These findings were in good agreement with the increase of prolamins found during this period. So it may be postulated that disulphide bonds were involved in the response to powdery mildew stress. Other research has shown that fusarium exerted no significant influence on barley storage proteins (Yang et al. Reference Yang, Jensen, Spliid, Svensson, Jacobsen, Jørgensen, Jørgensen, Collinge and Finnie2010), and that it resulted in grain protein degradation (Champeil et al. Reference Champeil, Doré and Fourbet2004). Research has also shown that Puccinia sp. can reduce N accumulation in wheat grain (Dimmock & Gooding Reference Dimmock and Gooding2002). In contrast, the present study has concluded that powdery mildew could strengthen prolamin synthesis. This suggests that different diseases exert different effects on protein synthesis, probably via different mechanisms.
As shown by other studies, the deposition of starch was more sensitive to stress than that of protein (Bhullar & Jenner Reference Bhullar and Jenner1985; Randall & Moss Reference Randall and Moss1990). The increase of GPC may result from a decrease in starch deposition rather than from an increase in protein deposition (Jenner et al. Reference Jenner, Ugalde and Aspinall1991). In the present study, increased disease severity could increase protein concentration while decreasing protein yield, where the passive increase caused by yield reduction may be one of the factors causing the rise of prolamin concentration. Because the experimental treatments took place at the booting stage, the present study involved changes in the number of grains per ear and mean grain weight (data not presented). The number of grains per ear and the mean grain weight in the susceptible cultivars (Xi'nong 979 and Zhoumai 18 in both years) deceased remarkably in the T2 treatment. The decreasing level of overall yield (9·9 and 8·3% in 2010 and 2011, respectively) in response to powdery mildew was greater than that of the protein (4·8 and 2·8% in 2010 and 2011, respectively) (Table 3). The highly susceptible Xi'nong 979 demonstrated significant changes in mean grain weight (7·5% decrease). The decreasing level of grain yield (9·2%) was much greater than that of protein yield (2·3%). This suggested that the reduction of starch accumulation could cause protein enrichment. Given that starch synthesis-related enzymes decreased in the present study, it can be inferred that the protein increase was not only a result of enrichment caused by the reduction of yield, i.e. the dilution effect, but also a consequence that starch synthesis related enzymes might be degraded and shifted into the synthesis of proteins. This was similar to the hypothesis of Yang et al. (Reference Yang, Jensen, Spliid, Svensson, Jacobsen, Jørgensen, Jørgensen, Collinge and Finnie2010) who reported that down-regulated proteins in response to Fg infection were degraded to produce the fragments for up-regulated ones. Once the protein synthesis enzymes were activated, the protein synthesis progress was promoted. To a certain degree, these two mechanisms (promotion and enrichment) were functioning at the same time. Nevertheless, because the infection of powdery mildew reduced the accumulation and translocation of photosynthetic assimilates, it was unlikely that the promotion of protein synthesis would be embodied in yield. In powdery mildew experiments with the near-isogenic line ‘Chancellor’, wheat powdery mildew investigation showed a 34% yield loss and the protein content decreased 7·1% (Johnson et al. Reference Johnson, Baenziger, Yamazaki and Smith1979), whereas in the present study the yield loss was 9·9% in 2010 and 8·3% in 2011. Hence, the protein content can change dynamically over the course of disease progression and further study on this is required. As shown in previous research, necrotrophic infection, e.g. Septoria, can inhibit starch deposition and promote protein synthesis (Karjalainen & Salovaara Reference Karjalainen and Salovaara1988; Watson et al. Reference Watson, Hare, Kettlewell, Brosnan and Agu2010). However, necrotrophs do not interfere with the translocation of the host. Powdery mildew, a biotroph, can facilitate the uptake of sugar (especially glucose), slow down the uptake of amino acids and become influential in the translocation of its host (Sutton et al. Reference Sutton, Gilbert, Williams and Hall2007). Therefore, it can be inferred that different pathogens increase protein content in wheat grains by mechanisms that are specific to the given pathogen.
The present study also found that NBS-LRR-type RGA (spot 37) and GTPase ObgE increased, revealing that interactions among proteins resulted from disease-resistant proteins. Similar conclusions have been drawn in studies of powdery mildew infection in barley leaves (Newton & Guy Reference Newton and Guy1998). The present study also found ascorbate peroxidase (APX) up-regulated in powdery mildew-infected wheat grains. A relatively higher increase in APX activity was found in barley leaves infected with powdery mildew (Burhenne & Gregersen Reference Burhenne and Gregersen2000). Previous studies have shown that from 10 to 15 DAA non-prolamin storage proteins (mainly α-amylase/trypsin inhibitors, β-amylases and triticins) accumulate in the developing starchy endosperm (Singh et al. Reference Singh, Shepherd, Langridge and Gruen1991; Gupta et al. Reference Gupta, Masci, Lafiandra, Bariana and MacRitchie1996; Triboï et al. Reference Triboï, Martre and Triboï-Blondel2003). The present study has also discovered that some non-prolamin storage proteins, including albumin (mainly endogenous α-amylase/subtilisin inhibitor and β-amylase) and globulin (such as globulin 3, globulin 3B, globulin 3C, gliadin/avenin-like protein, and triticin), participated in the response of wheat against powdery mildew infection. This is the first time that these conclusions have been drawn. All these proteins increased except β-amylase. Among them, gliadin/avenin-like seed protein and endogenous α-amylase/subtilisin inhibitor as well as one of the two spots of globulin 3B increased at both stages. Consequently, it can be inferred that they existed in grains in relatively stable states. Other proteins began to increase only at 25 DAA. In light of the result that total globulin content increased at both stages (10 and 25 DAA) and decreased in the maturation stage, it could be that globulin accumulates significantly in response to powdery mildew infection during specific periods and the accumulation of globulin 3 in this situation was found to be consistent with that found in drought stress (Altenbach Reference Altenbach2012). Globulins and defence/stress-related proteins are found to intensively distribute at 25 DAA, indicating that at this growth stage, wheat grains respond greatly to stress.
In summary, powdery mildew infection can increase protein concentration of wheat grain, and particularly prolamin concentration. Nevertheless, the increase might not merely be caused by a yield reduction, as the rise of enzymes and molecular chaperones could also lead to the increase. Prolamins have a complicated relationship with flour quality and therefore the influence of the disease on this crop is complex and dynamic (Švec & Miklovičová Reference Švec and Miklovičová1998). Further research is needed to better understand the quality changes resulting from powdery mildew when this disease is more prevalent. Research under field conditions approximates well to a commercial production situation and hence, the present field-based study presents practical information about the influence of powdery mildew on wheat grain quality.
The authors are grateful to the Innovation Foundation for Outstanding Scholars of Henan Province, People's Republic of China (grant no. 104200510013) and National High Technology Research and Development Programme (grant no. 2012AA101105).