1. INTRODUCTION
The evolution of marriage over the development path has attracted extensive attention from demographers, historians and, more recently, of economists [Becker (Reference Becker1981), Schoen et al. (Reference Schoen, Urton, Woodrow and Bai1985), Fernández et al. (Reference Fernández, Guner and Knowles2005), Stevenson and Wolfers (Reference Stevenson and Wolfers2007), Regalia et al. (Reference Regalia, Ríos-Rull and Short2011), Chiappori et al. (Reference Chiappori, Salanié and Weiss2017), Greenwood et al. (Reference Greenwood, Guner, Kocharkov and Santos2016) among many others]. As an economy develops, several changes can potentially influence individuals’ marriage behavior. These are, for instance, changes in the living location (e.g., urbanization), in the level and the distribution of income, in employment opportunities for men and women, and in laws and institutions. Some of these changes are specific to a particular country, while others are shared by most countries along the process of economic development.
The purpose of this paper is to investigate how economic factors affect individuals’ marriage behavior over the development path. Due to the fact that some of the determinants of marriage are specific to certain country, this task requires data on multiple countries over time. Our first contribution in this paper is thus to construct a comprehensive, cross-country panel data set on marital statistics, which is suitable for our analysis. The existing data sets, such as the data on marriage and divorce created by the United Nations Statistical Division (UNSD) or the Minnesota Population Center’s IPUMS International, only allow researchers to study marital statistics from 1950 for some countries and from 1970 for others. This creates a serious limitation for the analysis because at these dates, most OECD countries have already experienced a substantial part of their development process. Therefore, we use census records of each country directly collected from the country’s national statistical office, to construct a sample of 16 OECD countries from 1900 to 2000, with data in 10-year intervals.
The second contribution of this paper is to use the constructed data set to analyze the evolution of marriage along the development path. For this purpose, we combine our data set with cross-country data of real GDP per capita, and investigate the relationship between marriage and this economic indicator. To control for countries’ heterogeneity, we run fixed effects regression with the fraction of married population on the left-hand side and a polynomial of real GDP per capita on the right-hand side. Furthermore, for robustness, we employ a non-parametric plot of the fraction of the married over the level of real GDP per capita. Next, by using a similar methodology, we analyze the relationship between the fraction of the married and the value-added shares of broad sectors (agriculture, manufacturing, and services) in GDP.
We highlight two main findings. First, we find that the fraction of the married displays a hump-shaped relationship with the level of GDP per capita. Although the literature has documented this hump shape by using US time series data, the unavailability of long panel data did not allow previous studies to find a general pattern across countries over the development path. With our unique data set, we confirm that the hump-shaped pattern of marriage is a common feature across OECD countries, and that it is driven by economic development, not by factors which are specific to the US society. Second, we find that the fraction of the married correlates positively with the share of manufacturing in GDP. Sectoral shares represent the relative extent of each sector’s economic activities in the whole economy, that evolves as a country develops. Our results suggest that, even controlling for individual countries’ heterogeneity, the stage of development, and in particular the process of industrialization first and de-industrialization later, is a key dimension in determining the fraction of married individuals in the population.
Schoen et al. (Reference Schoen, Urton, Woodrow and Bai1985) is the first paper, which documents the hump-shape pattern of the fraction of married for the US. Recently, two papers, Greenwood and Guner (Reference Greenwood and Guner2008) and Iyigun and Lafortune (Reference Iyigun and Lafortune2016), have explored economic mechanisms behind this pattern. Greenwood and Guner (Reference Greenwood and Guner2008) suggest that, at early stages of development, technological progress in the household sector, together with economies of scale in household consumption and production, fosters an increase in the fraction of young individuals who leave the nest (parents’ home) and marry. At later stages, further technological progress in the household sector allows young people to leave the nest and remain single. Iyigun and Lafortune (Reference Iyigun and Lafortune2016) also examine US data over the twentieth century and document a U-shaped pattern for age at first marriage and an inverted-U pattern for the gender education gap. They propose a two-period frictionless matching model with endogenous education and marriage decisions, and explore the interaction between the timing of marriage and changes in educational attainment.
Our paper also relates to the literature that studies economic growth, structural transformation, and their relationship with the demographic transitions, pioneered by Galor and Weil (Reference Galor and Weil1996, Reference Galor and Weil2000). Through the lenses of economic growth theory, these two papers provide explanations to the reversal of the relationship between income level and fertility rate during the transition to a modern economy observed in many countries. While the literature is successful in accounting for the long-term trends of population growth, few contributions study the fluctuations of the demographic trends in the last century from the perspective of economic growth and structural transformation. One exception is Kimura and Yasui (Reference Kimura and Yasui2010), who extend the framework of Galor and Weil (Reference Galor and Weil1996), and explain the baby boom in the mid twentieth century through the transitions of an economy from a home sector to a male-dominated industry sector, and from a male-dominated industry sector to a female-friendly service sector. However, they limit their scope to fertility and do not investigate marriage. In terms of manufacturing and marriage, our findings also complement the evidence provided by Autor et al. (Reference Autor, Dorn and Hanson2017). These authors exploit variations in trade shocks to the manufacturing sector across commuting zones in the United States, and find that such shocks reduce the marriage “value” of men, thus inducing a decline in the fraction of married in the population. Taken together, the result in Autor et al. (Reference Autor, Dorn and Hanson2017) and the cross-country evidence in this paper suggest that the share of manufacturing is relevant for the prevalence of marriage both in a development perspective, and in a cross-section dimension of a modern economy like the United States.
Furthermore, recent research such as Kongsamut et al. (Reference Kongsamut, Rebelo and Xie2001), Ngai and Pissarides (Reference Ngai and Pissarides2007), and Buera and Kaboski (Reference Buera and Kaboski2012a), among many others, studies the causes of the changes in sectoral shares over the development path, attributing a key role in generating this process to the preferences of the representative consumer. However, no contribution has analyzed whether the demand for the three macro-sectors in the economy is linked to the evolution of a particular demographic group. Here, we partly fill this gap by showing the relative demand of manufacturing correlates with marriage rates, suggesting that the demographic structure of the population might be a determinant of consumption preferences estimated at the aggregate level.Footnote 1
The remainder of the paper is as follows: in Section 2, we discuss the construction of our data set; in Section 3, we provide the analysis of the relationship between marriage and economic development. Section 4 concludes.
2. HISTORICAL CROSS-COUNTRY PANEL DATA
In this section, we describe the construction of our historical panel data for 16 OECD countries. Due to the short length of the time series in the existing data sets on marriage, we directly obtained data from census records for most of the countries in our sample. The population data are then used to create marital statistics, which we combined with per-capita GDP and value-added shares of three sectors (agriculture, manufacturing, and the service sector). Since marital statistics are often affected by changes in the age structure of the population, we also create series that control for these effects. The remainder of the section describes the details of the data set.
2.1. Data
Our panel data consist of 16 OECD countries with 165 country-year observations. The main sources for our marriage data are population and housing census records, which are either (i) directly collected from each country’s national statistical office, or (ii) obtained from the UNSD’s database on marriage and divorce.Footnote 2
Country
Our country selection is based on the availability of a sufficiently long series of marriage data. Our sample consists of Australia, Belgium, Canada, Denmark, Finland, France, Germany, Italy, Japan, the Netherlands, Norway, Spain, Sweden, Switzerland, the United Kingdom, and the United States.
Time period
Marriage data in our sample are largely based on census records, which are in 10-year intervals (i.e., 1900, 1910, . . ., 2000).Footnote 3 We choose the time period 1900–2000 for two reasons. First, most of the OECD countries achieved substantial economic development during that period. Second, data on marital statistics are not available prior to 1900 for the majority of those countries.
Marital statistics
Population data are collected by sex, age group, and marital status. In all countries’ census records, individuals’ marital status falls into one of the following six categories; never-married, married, divorced, widowed, in a consensual union, and separated.Footnote 4 From these population data, we construct four marital statistics (fraction of the married, fraction of the never-married, fraction of the divorced, and fraction of the widowed) for each country for each year. We take the following strategy to construct the marital statistics: (i) if the information on individuals in a consensual union is available, we add these individuals to the married group;Footnote 5 (ii) if the information on the separated is available, we add these individuals to the divorced group. In particular, the latter strategy is motivated by the fact that in some countries divorce was illegal for many years and that there was a non-negligible number of individuals who reported themselves as separated.
GDP per capita
The data for real GDP per capita (in 1993 international dollar) are taken from Maddison (Reference Maddison2005), similar to the approach taken by Buera and Kaboski (Reference Buera and Kaboski2012b). The data cover all the country-year observations in our panel data.
Sectoral share
We use cross-country data of value-added sectoral shares from Buera and Kaboski (Reference Buera and Kaboski2012b). They construct historical time series data for nominal value-added shares of three broad sectors, agriculture, manufacturing, and services, over the twentieth century for all countries in our sample except Finland. For Finland, we collect the data from Herrendorf et al. (Reference Herrendorf, Rogerson and Valentinyi2014). The shares represent the relative extent of each sector’s economic activities in the whole economy.Footnote 6
2.2. Summary Statistics
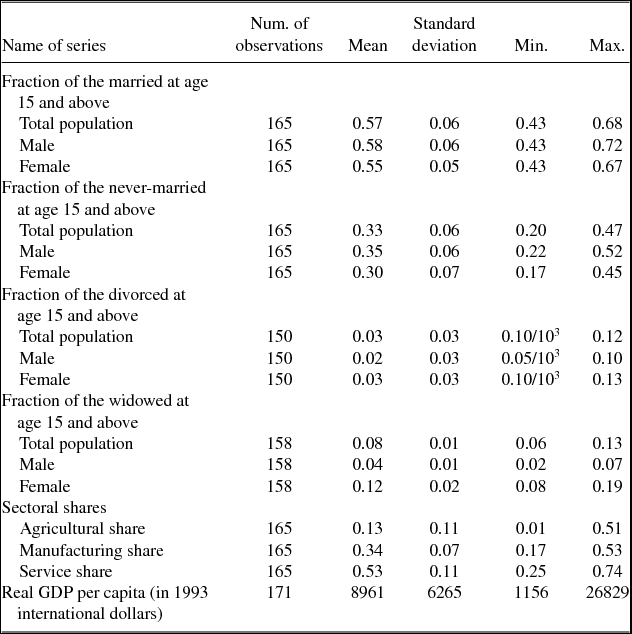
Table 1 describes summary statistics for our data set. The top row shows that the fraction of the married in the total population at age 15 and above varies between 0.43 percent and 0.68% in our sample. If we compare, the fraction of the married across genders, the fraction of married men (0.58%) is somewhat higher than that of married women (0.55%). This difference reflects the biological fact that there are more women in the economy because women tend to live longer than men. In addition to the fraction of the married, we also report the fraction of the never-married, the fraction of the divorced, and the fraction of the widowed in the total population at age 15 and above. Furthermore, there are three value-added share variables that we use in our analysis (agriculture, manufacturing, and services). These variables also exhibit considerable variation: the agricultural share ranges from 0.01% to 0.51% . The manufacturing share ranges from 0.17% to 0.53%, while the service share goes from 0.25% to 0.74%. In the final row, we also report real GDP per capita (1156–26,829). This shows a large variation as well, reflecting the fact that most of the countries in our sample achieved significant economic development over the last century.
Descriptive statistics for the cross-country panel data

Note: In the above table, the number of observations of the fraction of the divorced and that of the fraction of the widowed are both less than that of the fraction of the married. This is because information on the divorced and the widowed is not always available in some countries, and thus we couldn’t construct the numbers.
2.3. Changes in the Age Structure
In the data, older people are more likely to be married than younger people. Therefore, changes in the age structure of the population, which have occurred in most of the countries over the twentieth century, can potentially affect the fraction of the married population over time. The age structure of population has changed due to several reasons. For instance, baby booms occurred in many of the OECD countries in the mid of the century, and life expectancy has improved dramatically during the second half of the century. Moreover, the majority of countries in our sample experienced war(s) at the beginning and/or in the middle of the century.
To analyze the effects of changes in the age structure of the population on marital statistics, we compute two counter-factual time series. In the first, we assume that the age structure of the population in each year is the same as the one in a base year. As a result, this new series only reflects changes in people’s marriage behavior at the various ages. In the second, we assume that the age-specific fraction of the married is the same as the one in the base year. So, the second series only reflects changes driven by changes in the age structure of the population.
More specifically, suppose that the data on marital status is collected by J age groups in each period in a country. Let T t denote the total population of the country, X t (j) the total population of the jth age group, and M t (j) the number of the married in the jth age group in period t. Then, the country’s fraction of the married in year t with the age structure fixed at that in the base year t*, is obtained by
 $$\begin{equation}
F_{t}^{1}=\sum _{j=1}^{J}\left[\left(\frac{M_{t}\left(j\right)}{X_{t}\left(j\right)}\right)\left(\frac{X_{t^{*}}\left(j\right)}{T_{t^{*}}}\right)\right].
\end{equation}$$
Similarly, the country’s fraction of the married in year t with the age-specific marriage rates fixed at those in the base year t*, is obtained by
 $$\begin{equation}
F_{t}^{2}=\sum _{j=1}^{J}\left[\left(\frac{M_{t^{*}}\left(j\right)}{X_{t^{*}}\left(j\right)}\right)\left(\frac{X_{t}\left(j\right)}{T_{t}}\right)\right].
\end{equation}$$
The two counter-factual series (1) and (2) are used for robustness checks on our results in the following sections. Similar methods are applied for the fraction of the never-married and for the fraction of the divorced.
3. EMPIRICAL ANALYSIS
This section is devoted to analyzing the relationship between marriages and economic development. We first discuss the evolution of the married, the never married and the divorced in the 16 OECD countries. Then, we investigate the relationship between marriage and economic development.
3.1. Evolution of Marriage in OECD Countries, 1900–2000
Fraction of the married
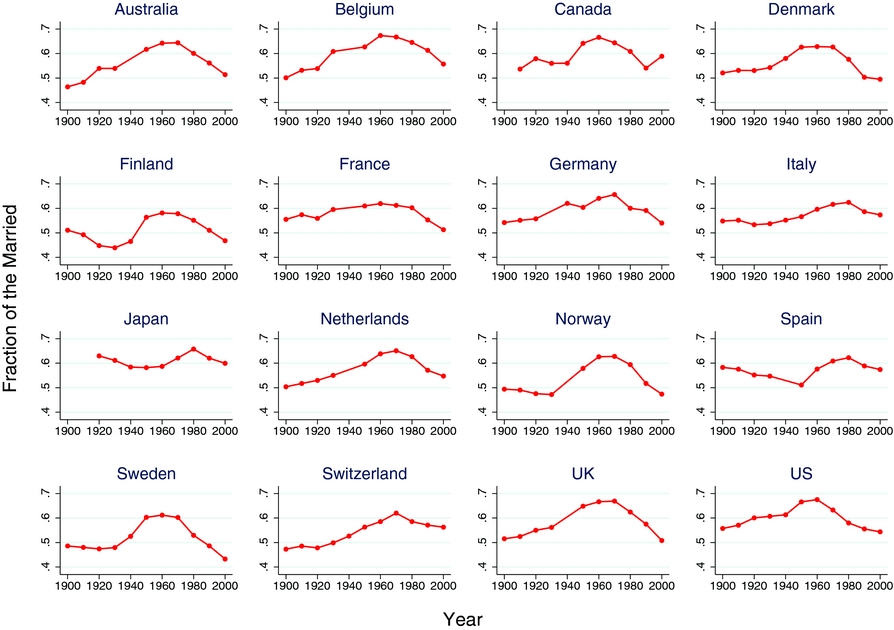
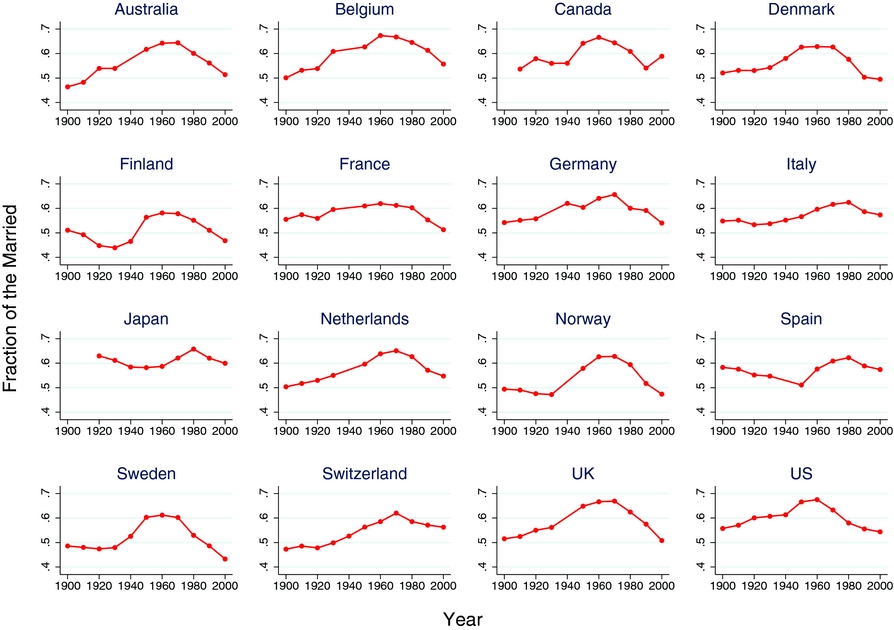
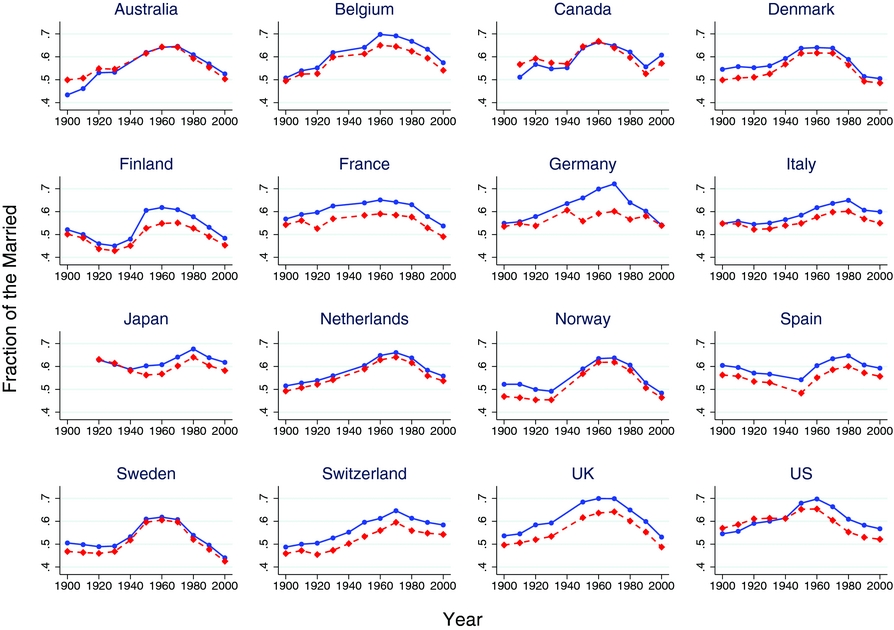
Figure 1 shows the fraction of the married in total population at age 15 and above for the 16 OECD countries in our sample. In the majority of countries, the fraction of the married rises in the early and mid-twentieth century, peaks between 1960 and 1980, and decreases thereafter. This pattern is robust for males and females, and to changes in the age structure. We document those robustness results in Appendices B and C.Footnote 7
Fraction of the married, age 15+, OECD countries, 1900–2000.
Changes in the married
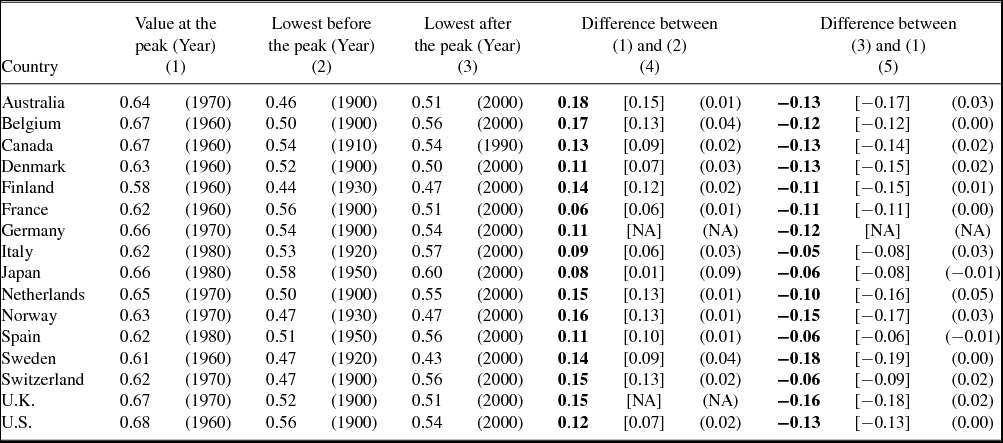
Table 2 summarizes the information on the changes in the fraction of the married for each country over the last century. The table reports the peak value of the fraction of the married and, the year of the peak (Column (1)), the lowest values before and after the peak and the years they are observed (Columns (2) and (3)), as well as the change in the fraction of the married between those years (Columns (4) and (5)).
Changes in fraction of the married at age 15+
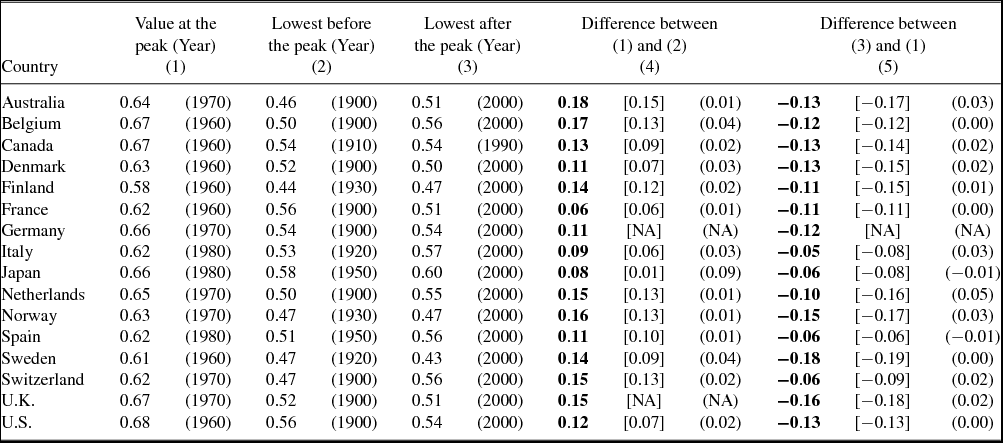
Note: In Columns (4) and (5), the numbers in the bracket [·] are the changes in the fraction of the married, when we keep the age structure same as that in the peak year. The numbers in the bracket (·) are those when we keep the age-specific marriage rates same as those in the peak year. Due to the lack of age-specific data, we cannot perform the decomposition for Germany and some years in United Kingdom.
In Column (4) and (5), we construct the counter-factual time series discussed in Section 2.3, and report the results in addition to the raw value of the changes from the one trough to the peak and from the peak to the another trough. The numbers in the first bracket [·] are those obtained by keeping the age structure as in the peak year.Footnote 8 Thus, these numbers show changes in people’s marriage behavior purely driven by changes in the fraction of the married in each age group. On the other hand, the numbers in the second bracket (·) are those obtained by keeping the age-specific marriage rates fixed to their values in the peak year. These numbers then show changes driven by the evolution of the age structure of the population over time. Due to the lack of age-specific data, the decomposition results are not available for Germany and some years in U.K.
As reported in Columns (4) and (5), there is some variation across countries in terms of the magnitude of the changes in the fraction of the married. Countries like Australia, Belgium, and Norway witnessed the largest increase in the fraction of the married up to the peak (more than 16 percentage points). Other countries experienced an increase of 6–15 percentage points. In France, Italy, and Japan, the increase in the fraction of the married was less than 9 percentage points. Regarding the decline from the peak, in countries such as Norway, Sweden, and the United Kingdom, the fraction of the married decreased by more than 15 percentage points after the peak. Other countries experienced a decline of 5–13 percentage points.
The numbers in brackets in Columns (4) and (5) confirm the idea that the rise and fall of the fraction of the married is driven by changes in marriage behavior within age groups. Changes in the age structure of the population play a small role in accounting for the long-term marriage trends, except for Japan. For this country, the change in the age distribution largely contributed to the rise of the fraction of the married between 1950 and 1980.
Fraction of the never-married
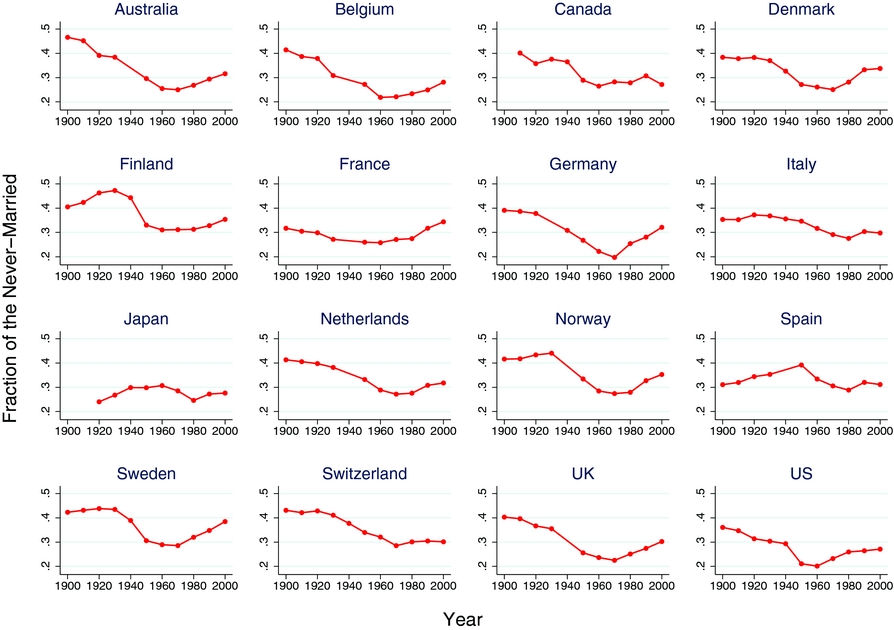
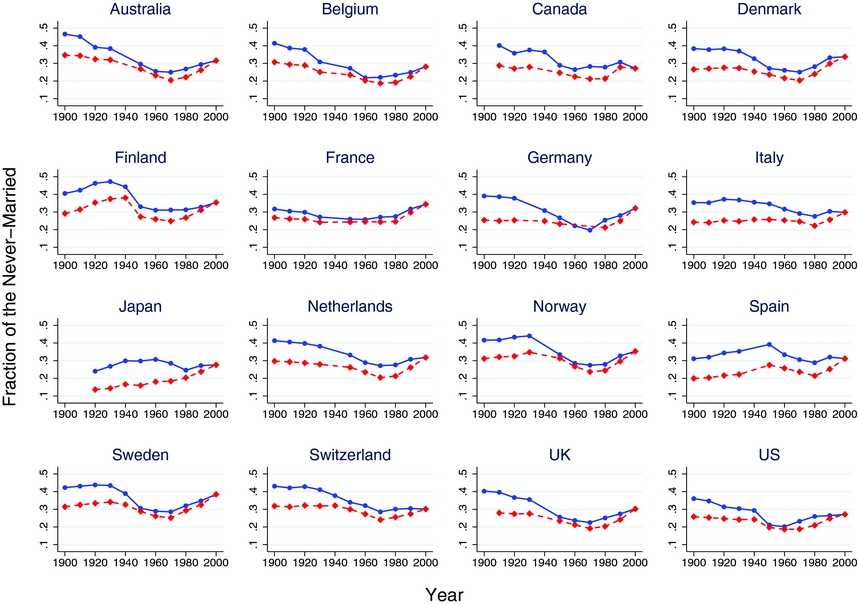
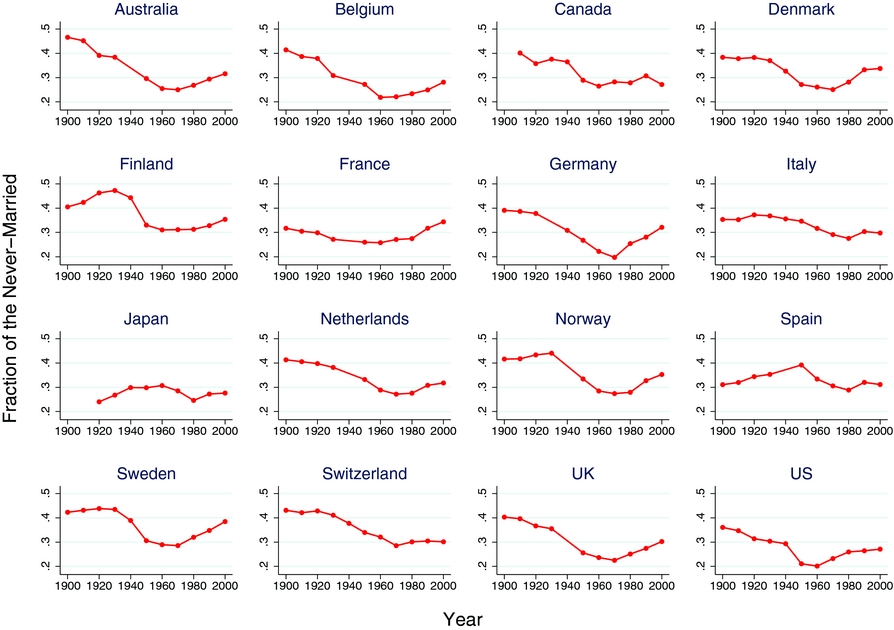
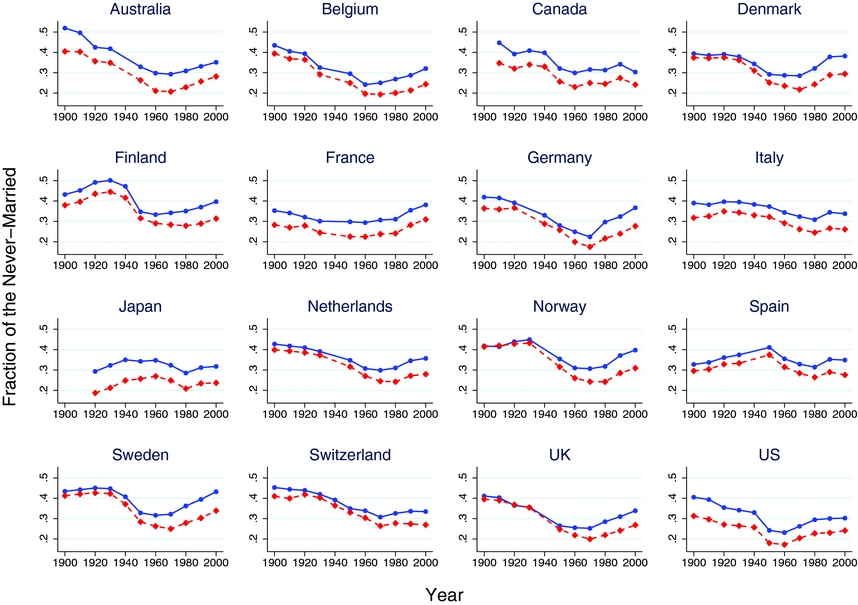
Figure 2 reports the fraction of the never married in total population at age 15 and above. For most countries a weakly U-shaped pattern is observed. Loosely speaking, for most countries the pattern of the fraction of the never married looks like the mirror image of the fraction of the married, although the magnitude of the changes is different.
Fraction of the never-married, age 15+, OECD countries, 1900–2000.
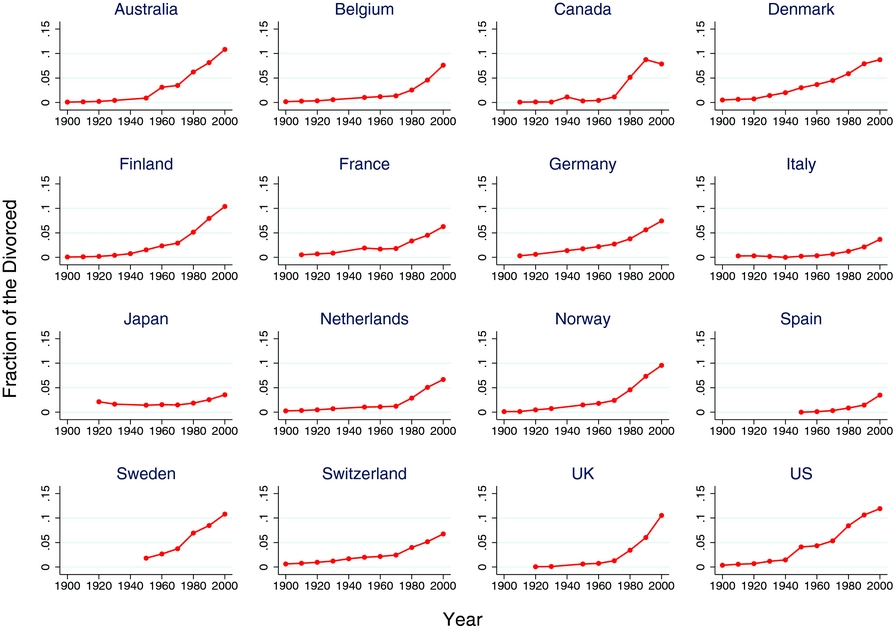
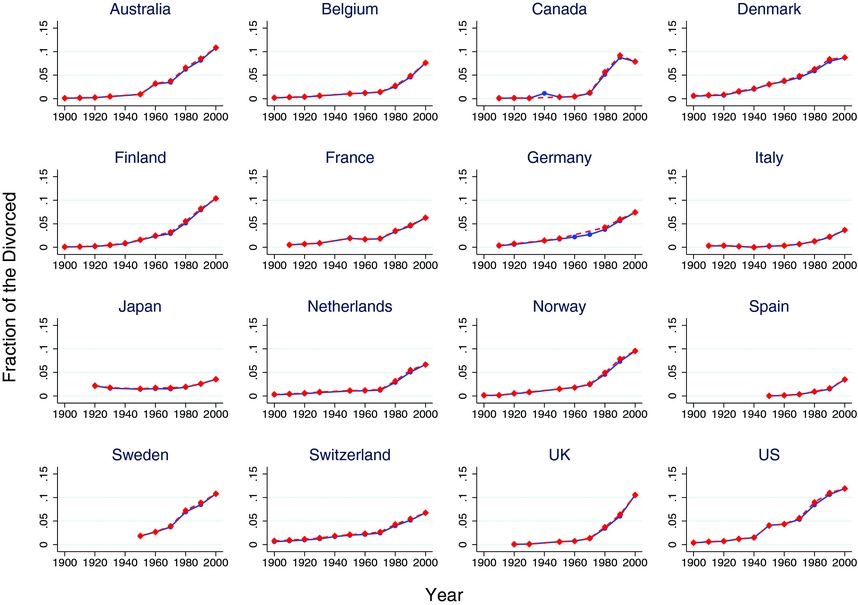
Fraction of the divorced
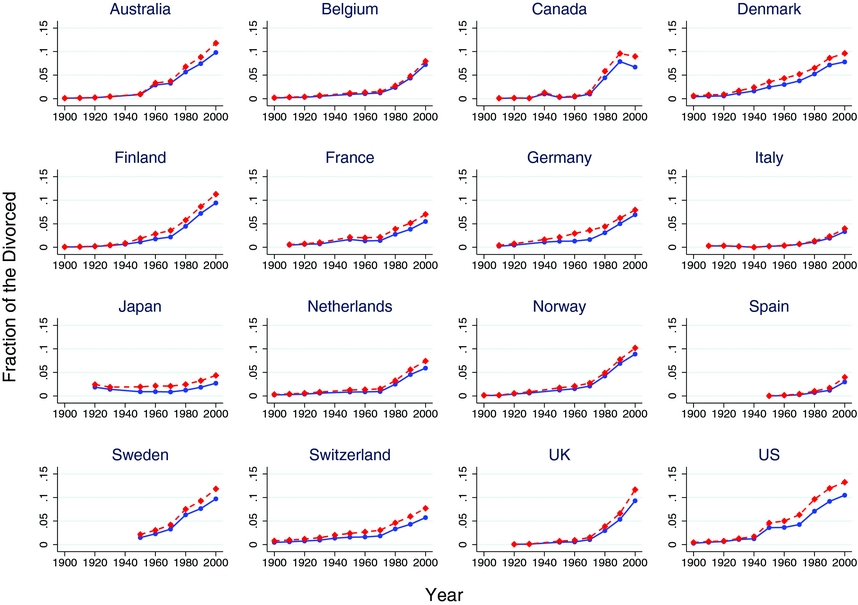
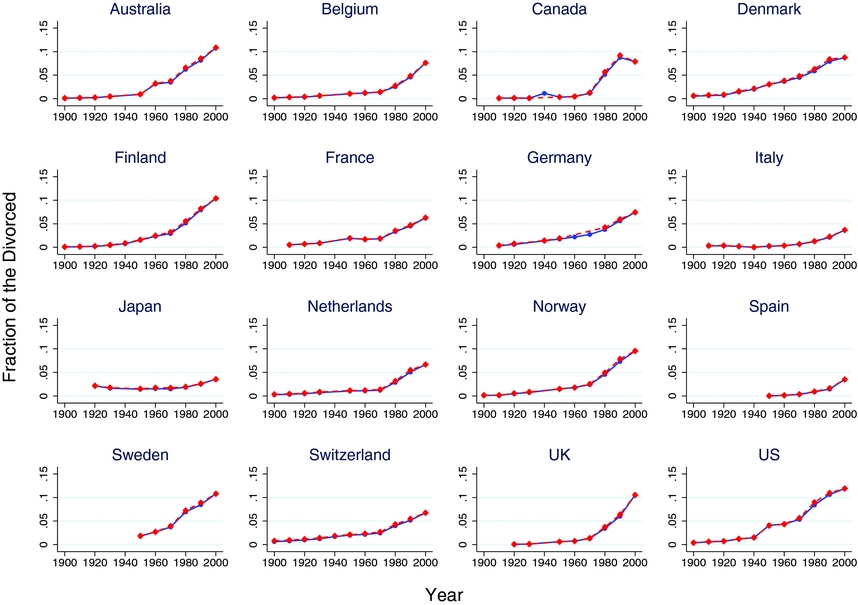
Figure 3 reports the fraction of the divorced (plus the separated) in total population at age 15 and above. For all countries, except for Japan, the number of divorces increases significantly in the second half of the last century, while before 1950 the increase is modest. Some countries display almost no variation in divorces for most of the twentieth century. For instance, the data show no trend in Australia until 1950, in Canada until 1960, and in Italy and in the United Kingdom until 1970. Japan displays a slightly pronounced U-shape, but this country shows almost no variation over the century.
Fraction of the divorced, Age 15+, OECD countries, 1900–2000.
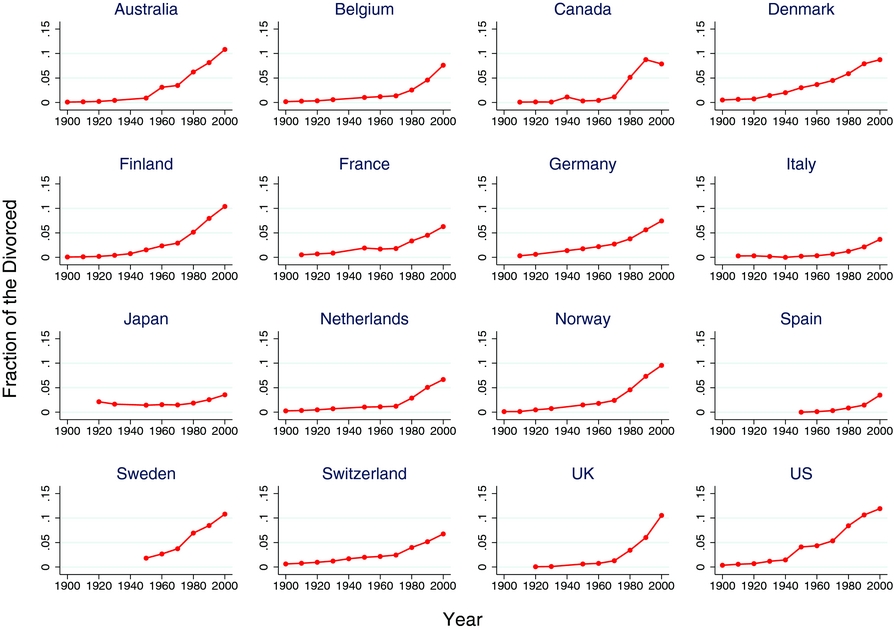
By taking together the information in Figures 2 and 3, it appears that the increasing part of the hump of the fraction of the married is mainly driven by the decline in the fraction of the never married. On the other hand, the decreasing part of the hump is due to the combination of the decline in the fraction of the never-married and the increase in that of the divorced.
3.2. Marriage and Economic Development
Methodology
To study the relationship between marriage and economic development, we first follow the approach in Buera and Kaboski (Reference Buera and Kaboski2012b) to control for country-specific effects in each data series. That is, we regress each data series (the fraction of the married in the total population at age 15 and above, and the value-added share of each sector) on a cubic function of log of real GDP per capita with country dummies:
 $$\begin{equation}
s_{i,t}=\Phi \left(\log \left[real\_GDP\_per\_capita\right]\right)+D_{i}+\epsilon _{i,t},
\end{equation}$$
where Φ(·) is a cubic polynomial, s i, t denotes the value of each data series for country i in period t, D i is country i’s dummy to capture the country-specific effect, and ε i, t is an error term. Then, we subtract the estimated country-fixed effects from the raw data.
In order to confirm that our results do not depend on the choice of the specific functional form in (3), we also use a non-parametric plot. Specifically, we apply a kernel smoothed local linear regression with a rule of thumb bandwidth.Footnote 9
Evolution of marriage on the economic growth path
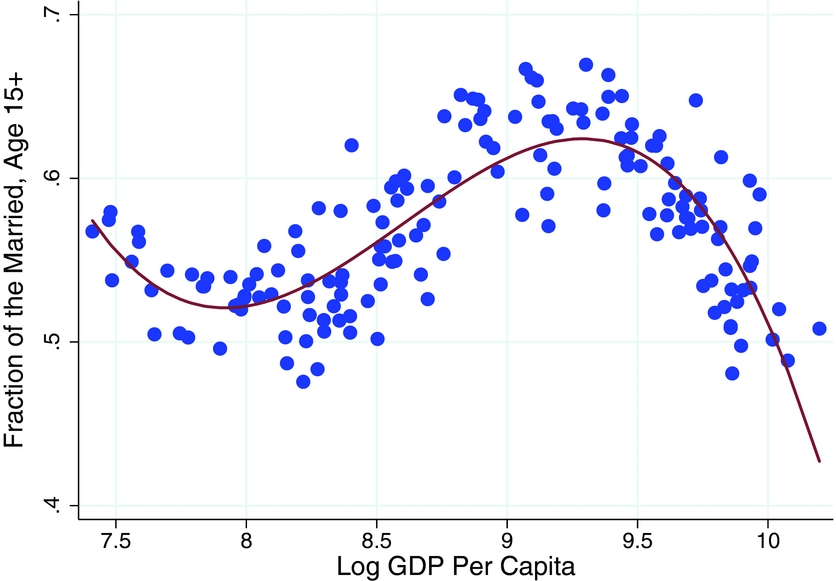
Figure 4 reports the relationship between the fraction of the married and log real GDP per capita, controlling for country-fixed effects. The evolution of marriage displays a clear hump-shaped pattern as the income level increases. From the level of log real GDP per capita of around 8–9.25, there is an increase in the fraction of married population, followed by a steep decline. At the level of log real GDP per capita of around 10, the fraction of the married is at a similar level as it is for a log real GDP per capita of around 8. While the decline in the fraction of the married in the last decades is a well-documented fact, the evidence on the systematic increase in marriages occurring at lower levels of income as GDP grows, is novel.
Fraction of the married, age 15+, by GDP per capita, OECD countries, 1900–2000.
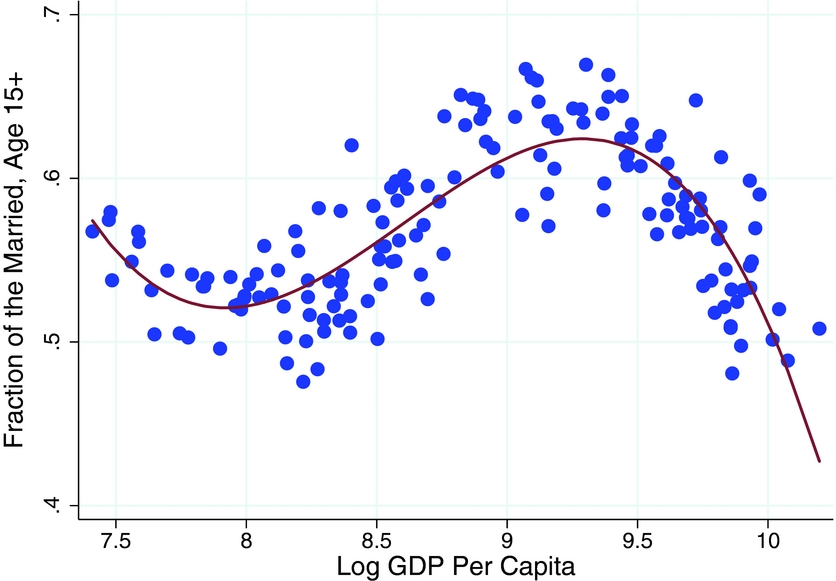
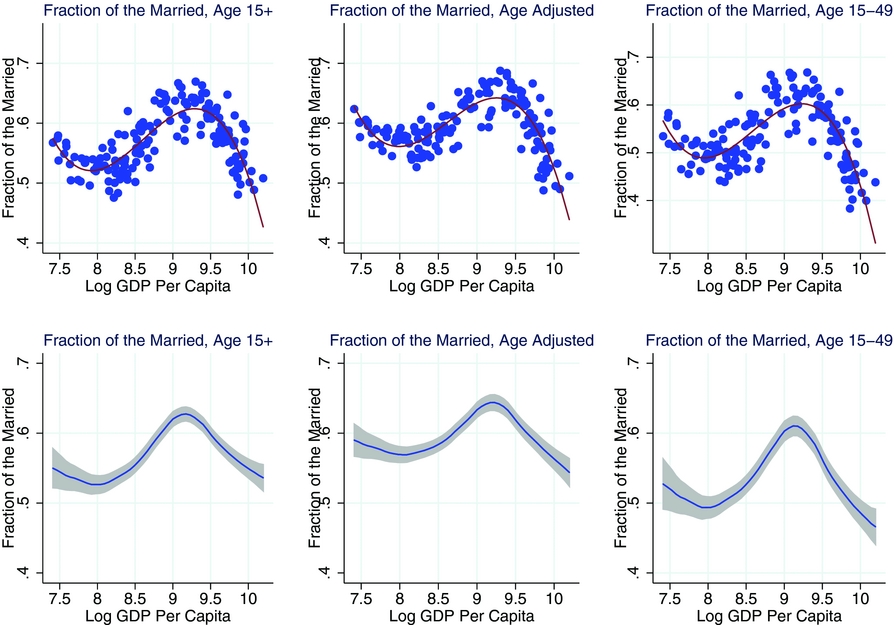
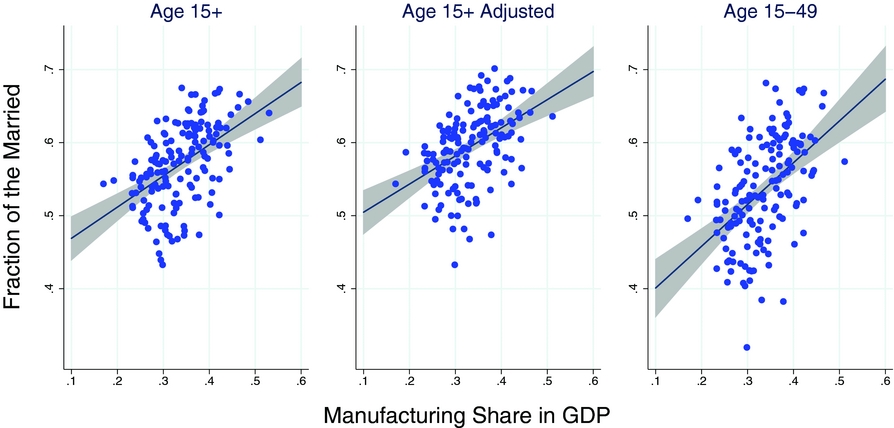
Although Figure 4 shows a clear hump-shaped pattern of the fraction of the married, such a pattern can be due to the fact that we are using raw marriage data, which are exposed to changes in the age structure, or that we are employing a particular econometric methodology. Therefore, we check that our finding is robust to various treatments. In Figure 5, we first consider the age-adjusted measure of the fraction of the married, because a change in the structure of the population can, per-se, affect the fraction of the married. We apply the method of Equation (1) in Section 2.3 by setting the year 2000 as the base year. Thus, the computed age-adjusted series fixes the population structure to the one in the year 2000.Footnote 10 The top-middle panel reports the relationship of the age-adjusted fraction of the married with log real GDP per capita. The resulting pattern is very close to the one shown from the raw data, displayed in the top-left panel for comparison. Next, we consider the population between 15 and 49 years old, in order to shut down the effect of the changes in life expectancy. This is reported in the top-right panel of Figure 5. Again, the resulting relationship is very close to the one in the top-left panel. It is important to note that, in all three figures, the top of the hump-shape coincides with a level of log real GDP per capita of 9.25.
Fraction of the married by GDP per capita, OECD countries, 1900–2000. In the bottom 3 panels, gray areas indicate 95 percent confidence intervals.
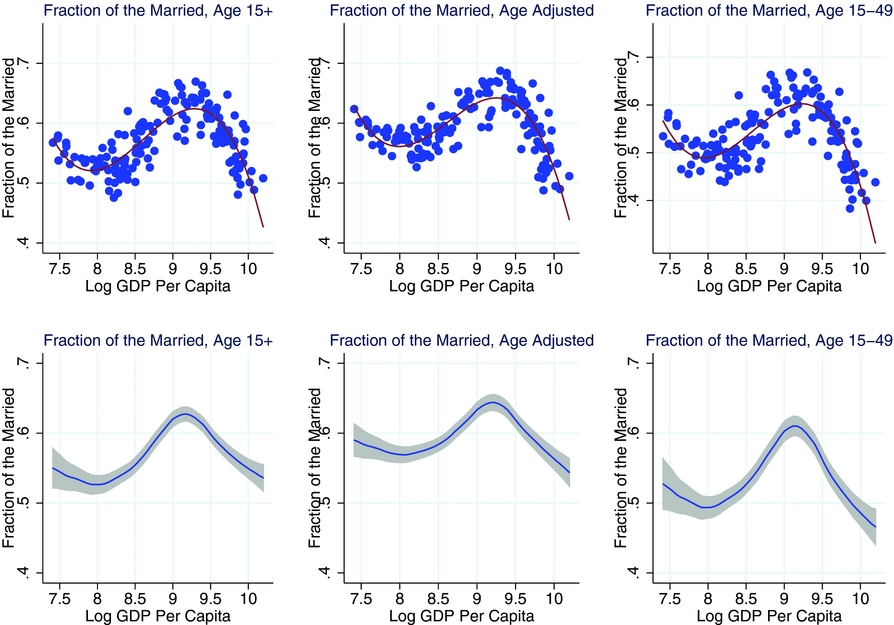
Finally, we address a potential methodological issue. It is possible that the hump-shaped pattern of the fraction of the married is due to the particular cubic relationship that we assume when we control for fixed effects. In the bottom panels of Figure 5, we report the results of non-parametric plots of the fraction of the married against log real GDP per capita. For the three different measures of the fraction of the married, raw, age-adjusted, and aged 15–49, the estimation provides a clear hump-shaped relationship. Also, the top of the hump again coincides with a level of log real GDP of 9.25.
Marriage and industrial structure
In the previous subsection, we showed how the fraction of the married evolves as GDP per capita grows. However, GDP growth is a synthetic measure of economic activities, and does not provide information on distributional changes of income over the development path, especially between men and women.Footnote 11 If economic opportunities for the two sexes improve in different ways as GDP grows, marital incentives of individuals might also be affected, as many previous studies pointed out.Footnote 12 Indeed, Goldin (Reference Goldin1995) argues that, relative to men, women appear to be historically barred from the manufacturing sector, due to social norms or employer preferences. Thus, with a rise of manufacturing as a share of GDP, women might work more at home and less in the market, experiencing a decline in the average wage relative to men.Footnote 13 On the other hand, with the modern rise of the services sectors, the female labor force participation rate and wages soar, as described in Ngai and Petrongolo (Reference Ngai and Petrongolo2017).Footnote 14 Therefore, it seems natural to analyze how marriage relates to changes in sectoral shares in GDP (structural transformation) that occur as GDP grows.Footnote 15
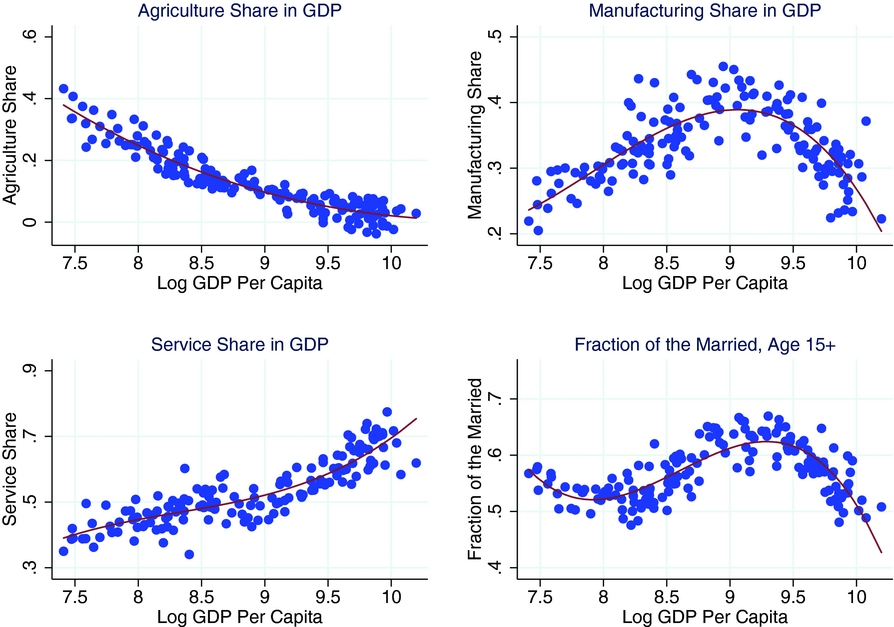
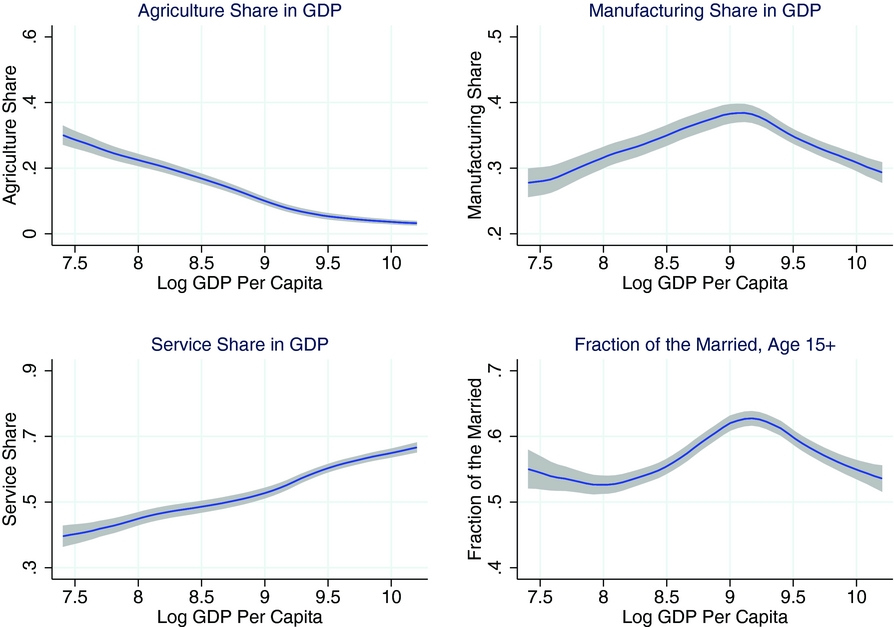
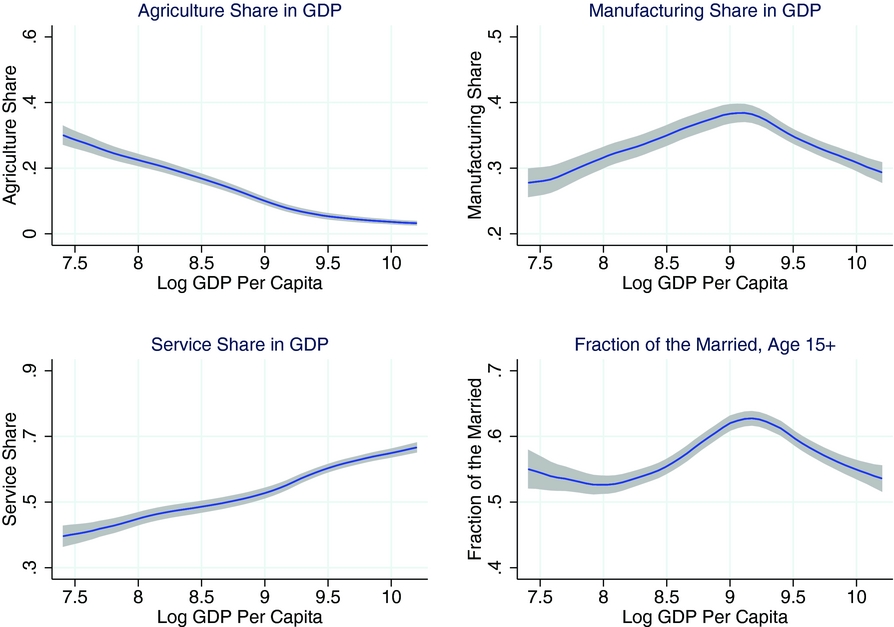
To investigate if there is a relationship between structural transformation and marriage, in Figure 6, we report the evolution of the GDP share of the three broad sectors (agriculture, manufacturing, and services) against log real GDP per capita, controlling for country-specific fixed effects.Footnote 16 The figure shows that, as countries become richer, the importance of agriculture in the economy shrinks, while that of services increases. The manufacturing sector instead, displays a hump-shaped pattern.
Scatter plots of fraction of the married and sectoral shares by GDP per capita (fixed effects controlled), OECD countries, 1900–2000.
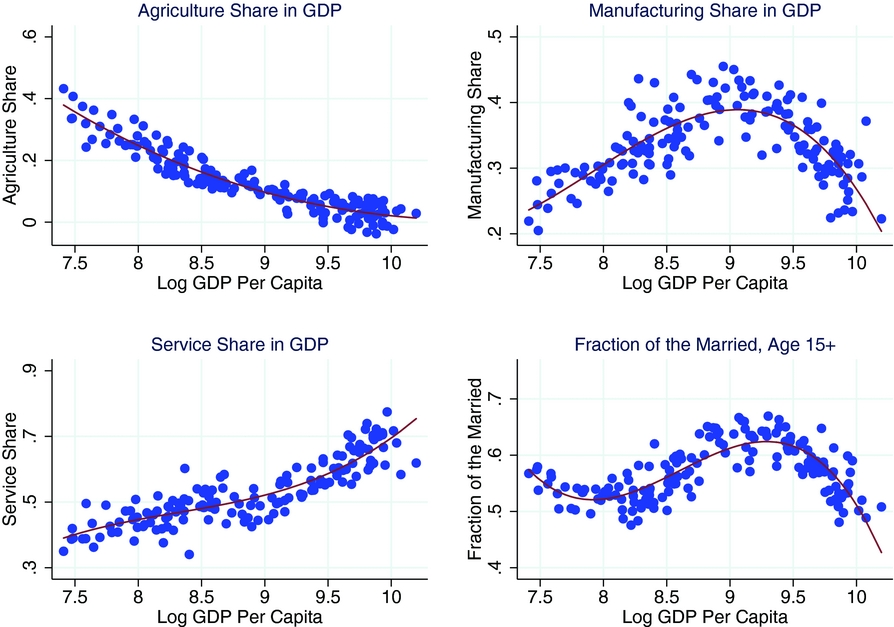
In the bottom-right panel of Figure 6, we report the fraction of the married in the population at age 15 and above. Notably, the graph displays a behavior that is similar to that of the manufacturing sector. In particular, the peak of the estimated curve is found at the same level of log real GDP per capita both for marriage and for manufacturing. The pattern is more evident by looking at the results of the non-parametric plot shown in Figure 7.
Non-parametric plots of fraction of the married and sectoral shares by GDP per capita, OECD countries, 1900–2000. Gray areas indicate 95 percent confidence intervals.
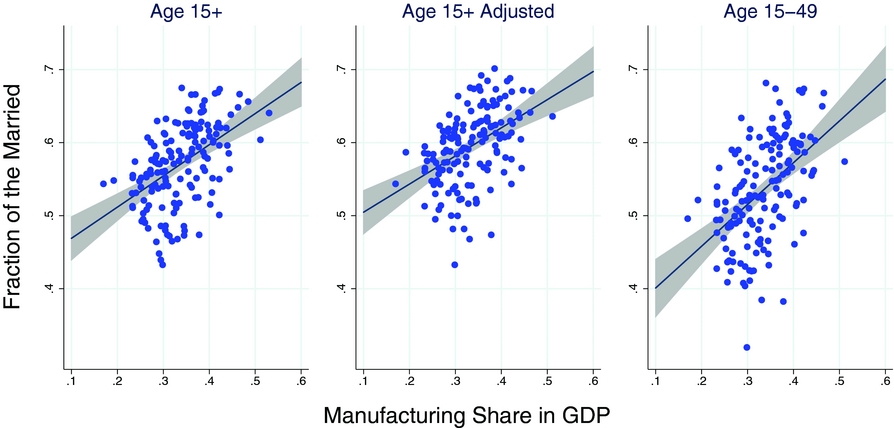
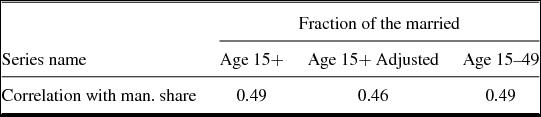
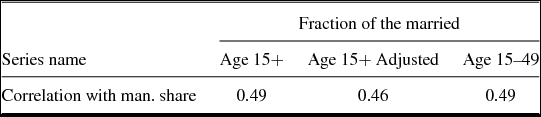
To confirm the positive correlation between the fraction of the married and the manufacturing share in GDP, Figure 8 shows the scatter plots of the fraction of the married on the manufacturing share for three different definitions. The left panel shows the plot of the married in the population at age 15 and above, the middle panel shows the age-adjusted series, while the right panel shows those of the married in the population between 15 and 49 years old. All figures report a positive correlation between the manufacturing share and the fraction of the married in our sample of OECD countries during the period 1900–2000. Table 3 reports the correlation coefficients with the manufacturing share for the three series, which are 0.49, 0.46, and 0.49, respectively.
Scatter plots of the fraction of the married on the manufacturing share in GDP, OECD Countries, 1900–2000. The straight lines are the fitted values and the gray areas indicate 95 percent confidence intervals.
Correlation between fraction of the married and manufacturing share
Our results on marriage appear to be consistent with the theory described in Goldin (Reference Goldin1995). As income grows, the industrial structure of the economy benefits men and women in different ways. Manufacturing sectors provide more employment opportunities and increase relative wages of men, while service sectors do the same thing for women. This, in turn, affects the incentives to marry. The mechanism is also highlighted in Autor et al. (Reference Autor, Dorn and Hanson2017). They exploit trade shocks from China across commuting zones in the United States, and find that a decline in the manufacturing share reduces prevalence of marriage among young women. They also document that such a shock has a large negative impact on men’ s relative annual earnings, arguing that it reduces the number of “marriageable” males, which supports the theory of Goldin (Reference Goldin1995). Consistent with their finding, our cross-country evidence suggests that, the sectoral share of manufacturing is related to the rise and fall of prevalence of marriage observed in the OECD countries over the last century.
4. CONCLUSION
In this paper, we provided a newly constructed data set on marital statistics across countries and over time that is suitable for quantitative analysis. To our knowledge, this is the most comprehensive data set on marriage available for OECD countries. Our data span the entire twentieth century, during which several social, technological, economic, institutional, and demographic changes took place, including world shocks such as the two great wars. Thus, our data set is potentially suitable to analyze the relationship between marriage and several social changes, allowing researchers to control for individual countries’ idiosyncratic conditions. We used this data set to analyze the relationship between marriage and economic development. Although there is a large body of literature that discusses the role of economic conditions to account for changes in marriage over the development path, no study could provide a quantitative assessment of this relationship. Our quantitative results shed light on the effect of sectoral composition in the economy on family formation.
We have shown that the fractions of the married displays a clear hump-shaped pattern as income grows. One interpretation of such a non-monotonic relationship is that, as GDP grows, the distribution of income becomes more even or uneven between the two genders. As the economic status of men and women is a key factor in marital decisions, the fraction of the married can move following a change in the gender distribution of income. A well known factor that can affect such distribution is the process of structural transformation. The idea is that some sectors of the economy (namely the manufacturing sector) favor male labor relative to female labor, so a rise of the value-added share of these sectors in the economy can affect the distribution of income between men and women. This being the case, a relationship between structural transformation and marriage should be clearly observable.
To investigate the above possibility, we use our cross-country data set together with the data on value-added shares of agriculture, manufacturing, and services of our 16 OECD countries. We find a positive relationship between marriage and the manufacturing share. Thus, our results indicate that the industrial structure of the economy is related to the pattern of marriage observed in OECD countries over the last century. Finally, it is due noting here that we limit our analysis to the period 1900–2000 because this is when most OECD countries have experienced significant changes in their manufacturing share.Footnote 17 However, as many countries had their demographic transition under way in the late nineteenth century, it is possible that there is a more pronounced decline in marriage rates preceding the twentieth century hump in those countries.Footnote 18 We leave this investigation for future research.
DATA SOURCE
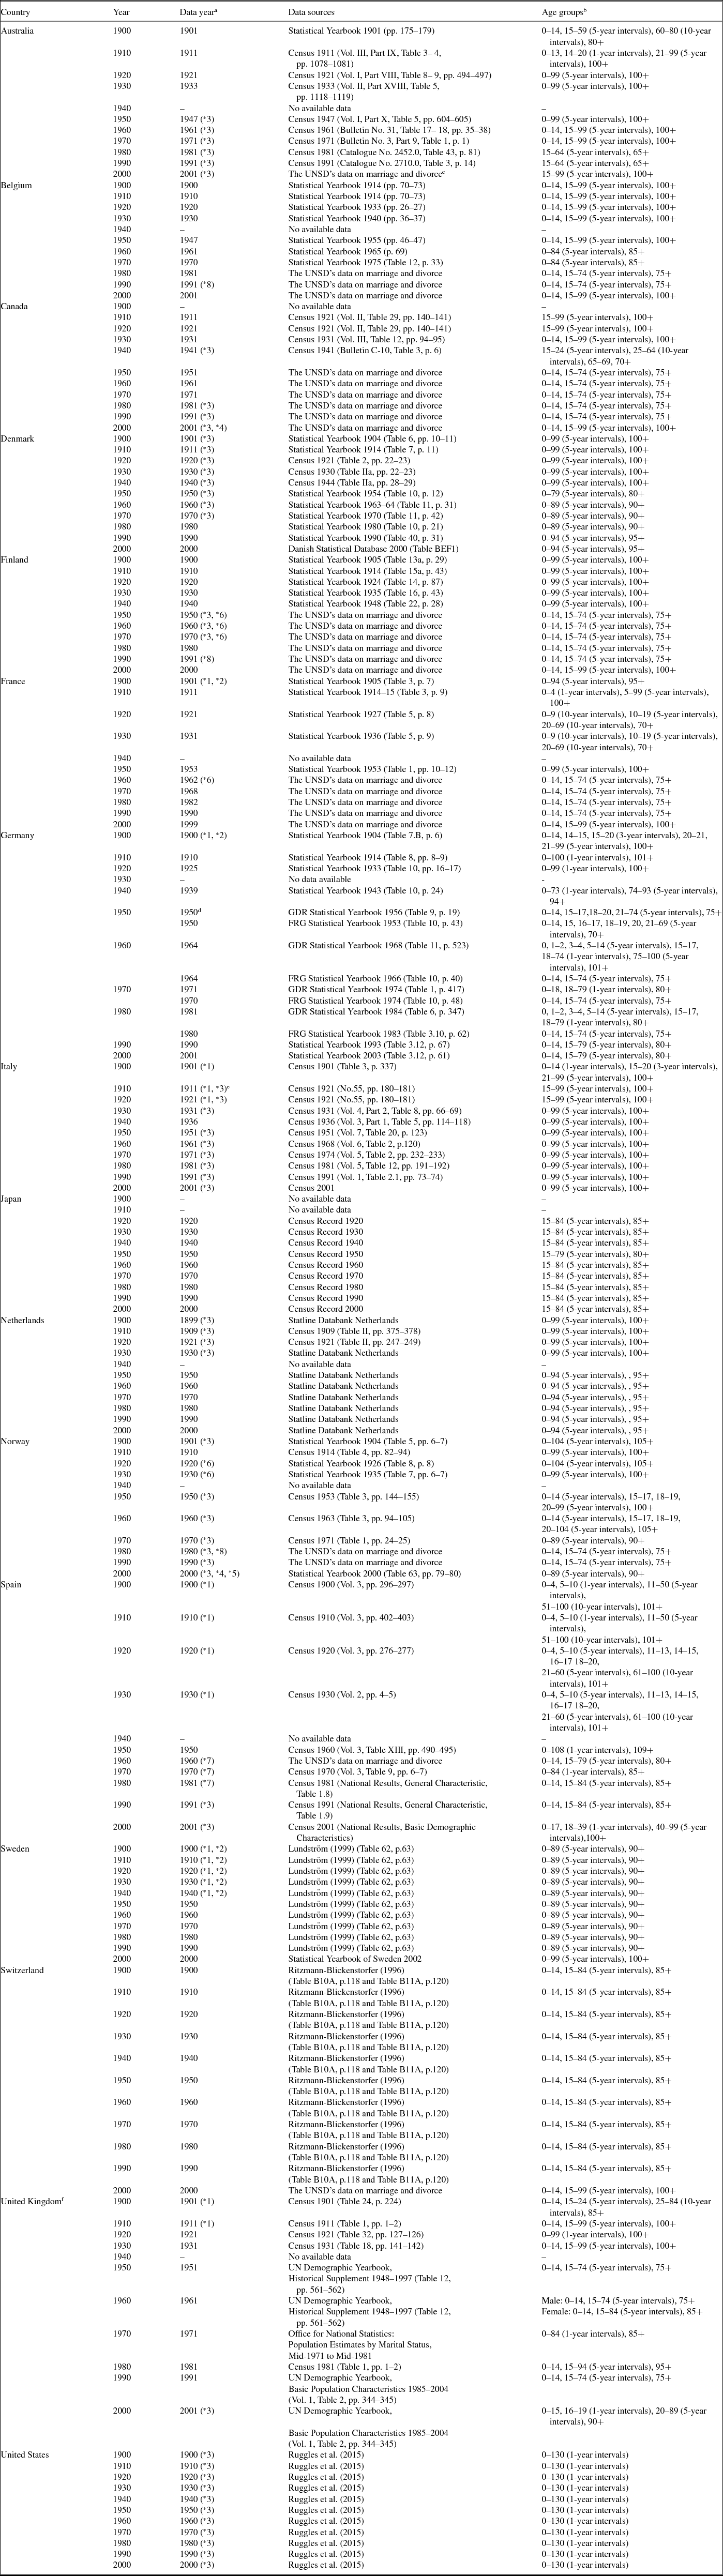
This Appendix reports the data sources for each of the OECD countries in our sample. There are eight special cases, which could apply for a country-year observation in Table A.1. These eight cases are as follows.
-
(*1) Information on the number of divorced individuals is not available.
-
• France (1900), Germany (1900), and Sweden (1900–1950) report the number of divorced individuals and that of widowed individuals together. Therefore, we cannot obtain each number.
-
• Spain (1900–1930), Italy (1900), and the United Kingdom (1900–1910) do not even have a category of divorced individuals or that of separated individuals.
-
-
(*2) Information on the number of widowed individuals is not available.
-
(*3) Data have information on the number of individuals who are separated.
-
(*4) Data have information on the number of individuals who are in a consensual union.
-
(*5) Data have information on the number of individuals who are previously in a consensual union.
-
• Norway (2000) reports this number. However, the category does not provide information on the reason of the separation from a consensual union. Therefore, we could not determine whether we should consider these individuals as the divorced or the widowed. Thus, we did n’t use this information in the analysis.
-
-
(*6) The married category includes individuals who are in a consensual union.
-
(*7) The divorced category includes individuals who areseparated.
-
(*8) Data are based on the UNSD’s estimates.
Summary of data sources
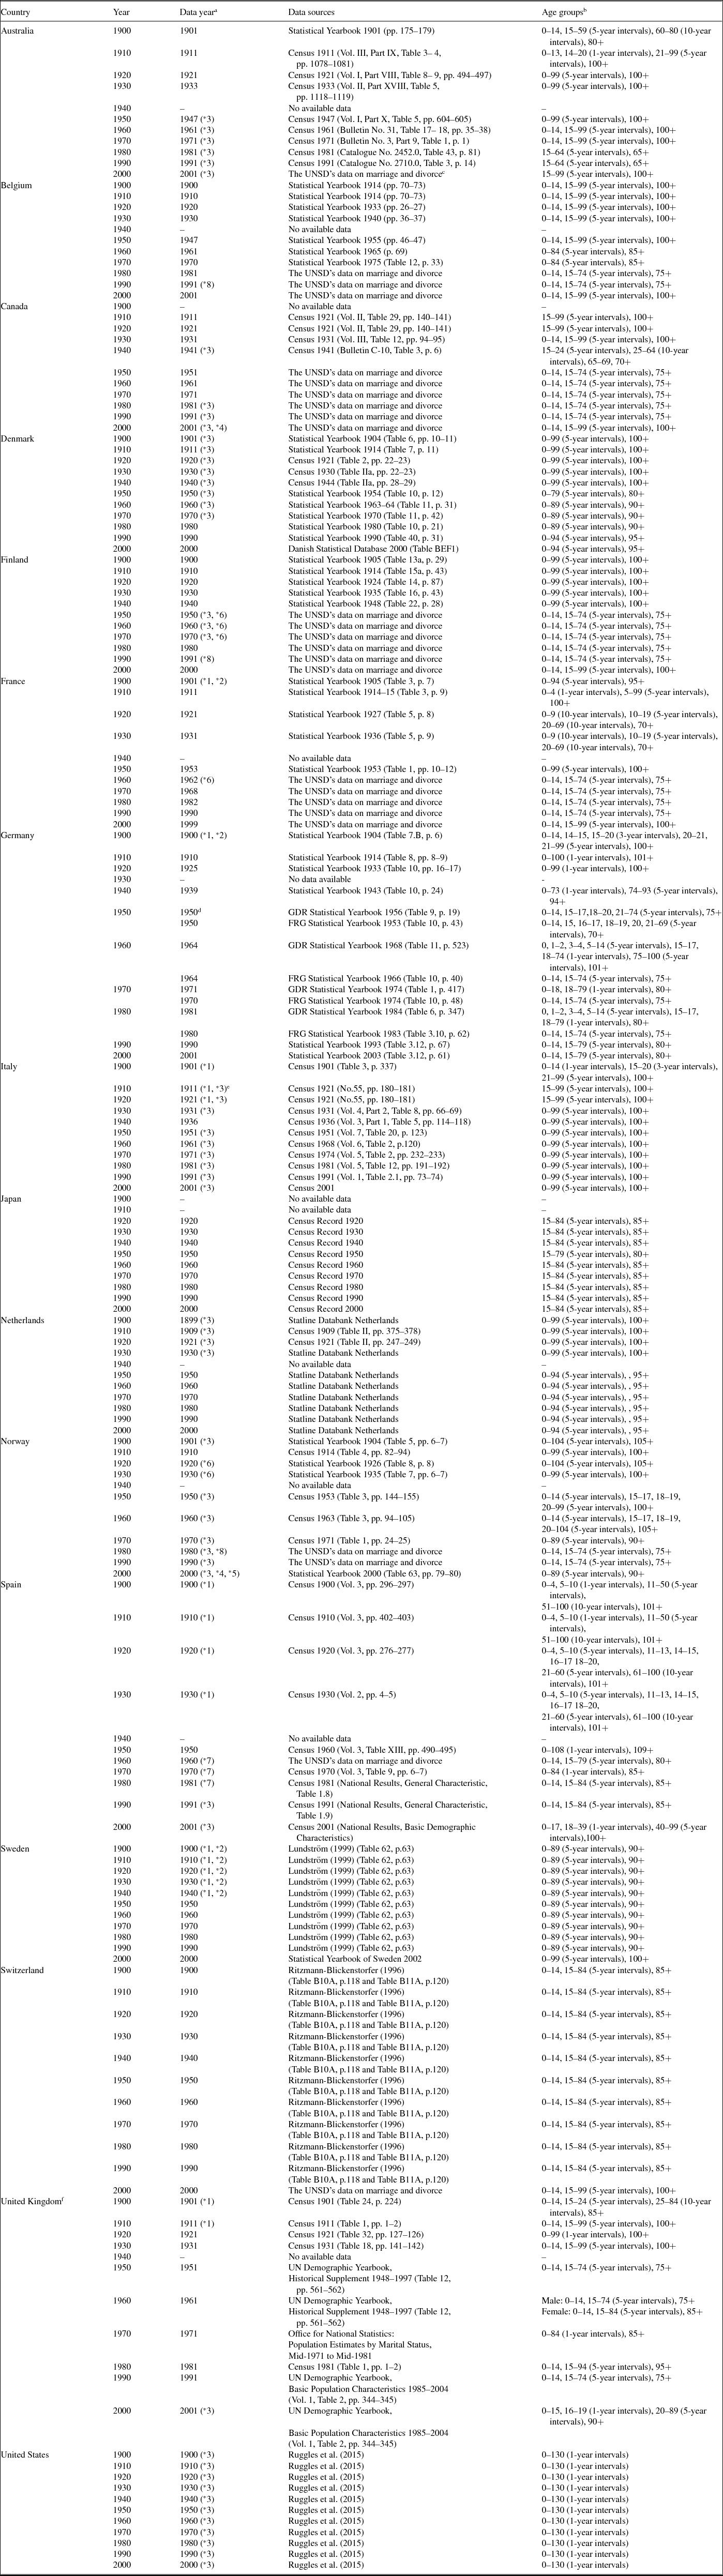
In Table A.1, we put remarks (*1 − 8) to indicate whether each case applies for a country-year observation.
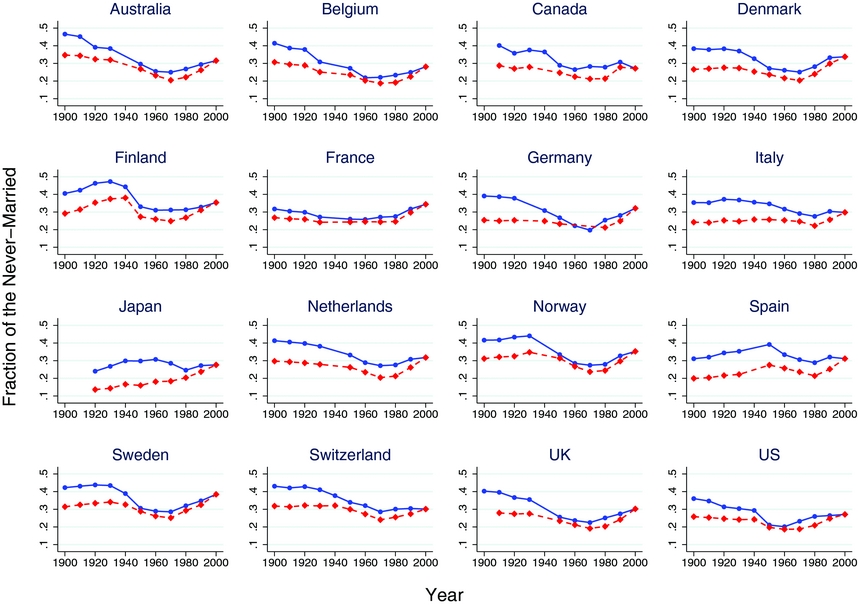
APPENDIX B: MARRIAGE PATTERN BY SEX
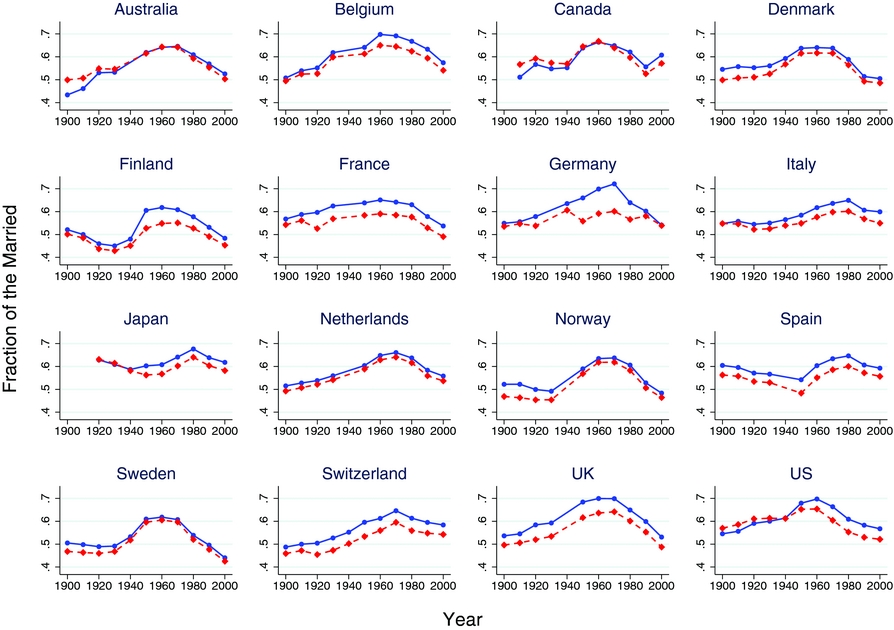
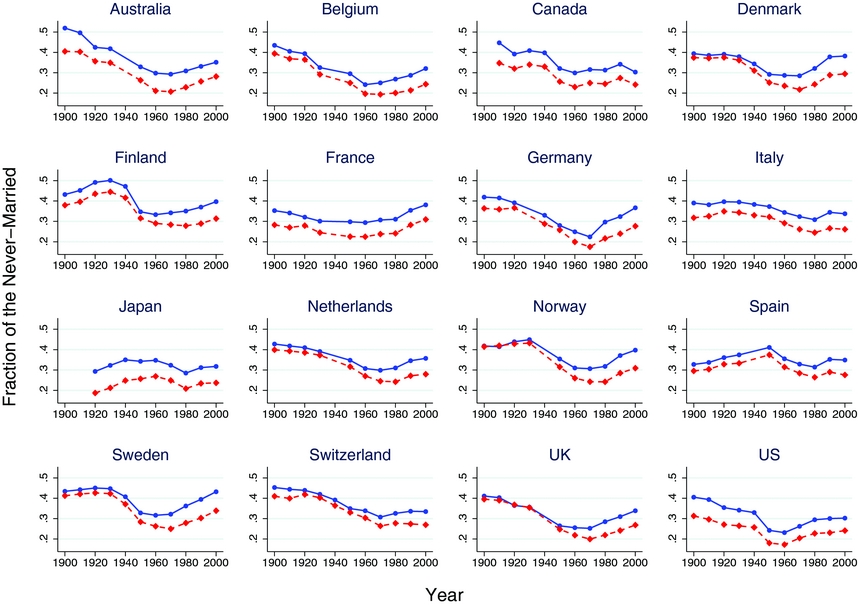
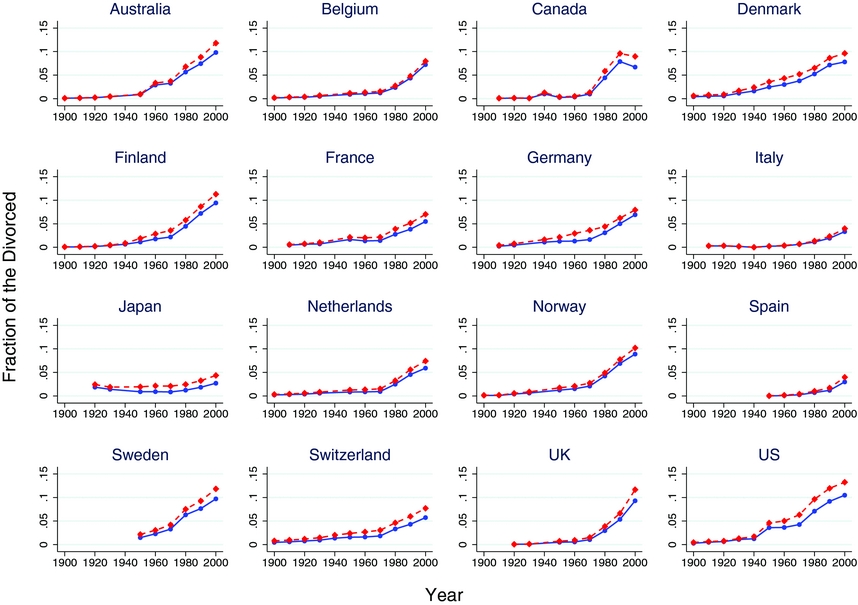
In Figures B.1–B.3, we show the fraction of the married, the never-married, and the divorced for males and females separately.
Fraction of the married by sex, age 15+, OECD countries, 1900–2000. The blue and solid line is the one for males. The red and dashed line is the one for females.
Fraction of the never-married by sex, age 15+, OECD countries, 1900–2000. The blue and solid line is the one for males. The red and dashed line is the one for females.
Fraction of the divorced by sex, age 15+, OECD countries, 1900–2000 Note: The blue and solid line is the one for males. The red and dashed line is the one for females.
APPENDIX C: ADJUSTMENT OF THE AGE STRUCTURE
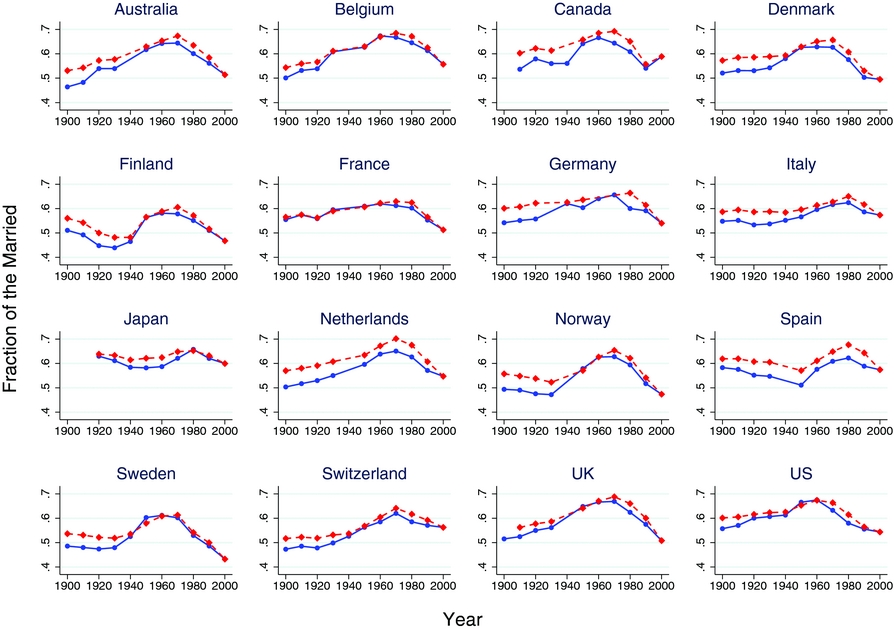
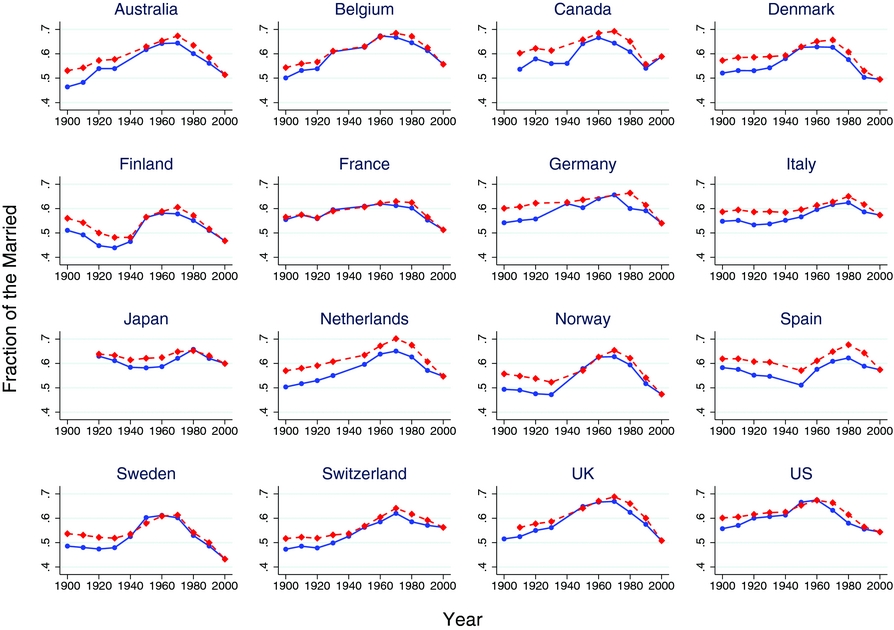
In Figures C.1–C.3, we plot the age-adjusted series of the fraction of the married, the never-married, and the divorced together with the original series, respectively. For the age-adjusted series, we apply the method of Equation (1) in Section 2.3 setting the year 2000 as the base year.
Age-adjusted fraction of the married, age 15+, OECD countries, 1900–2000. The blue and solid line is the original series. The red and dashed line is for the age-adjusted one.
Age-adjusted fraction of the never-married, Age 15+, OECD countries, 1900–2000 Note: The blue and solid line is the original series. The red and dashed line is for the age-adjusted one.
Age-adjusted fraction of the divorced, age 15+, OECD countries, 1900–2000. The blue and solid line is the original series. The red and dashed line is for the age-adjusted one.
APPENDIX D: MARITAL STATISTICS BY AGE GROUP
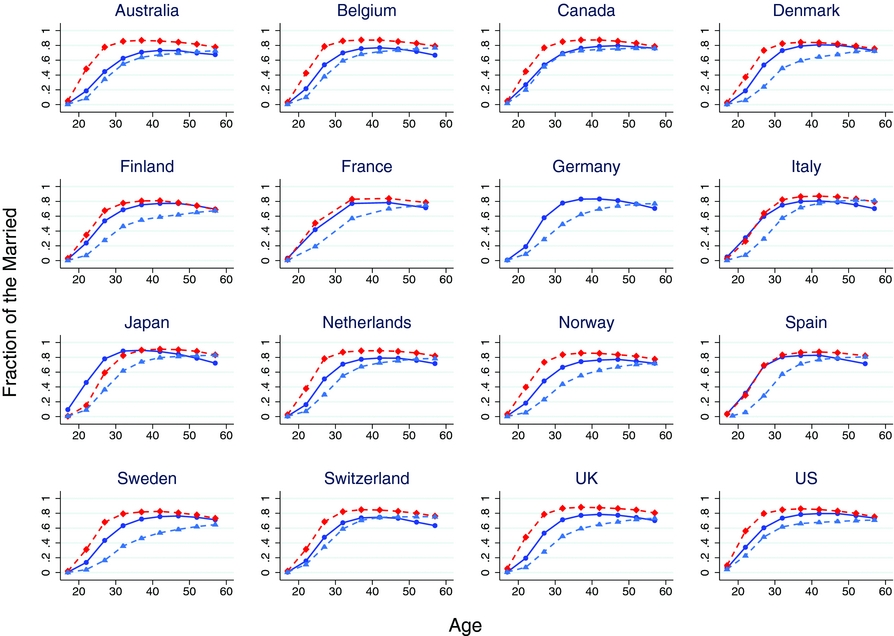
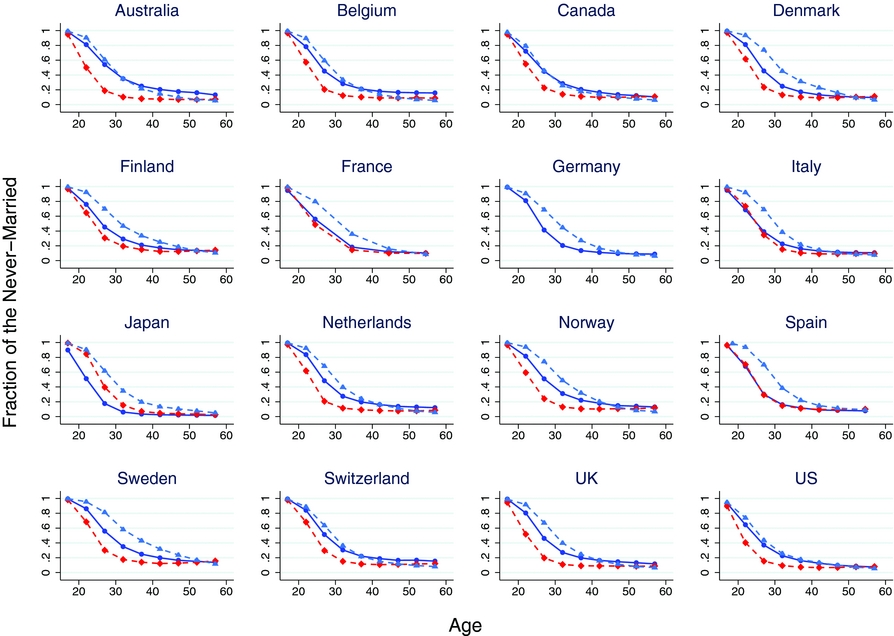
In this Appendix, we report the evolution of the age distribution of the married, the never-married, and the divorced over time. We report the age distribution for the initial, the final and the peak year (of the fraction of married) for each country.
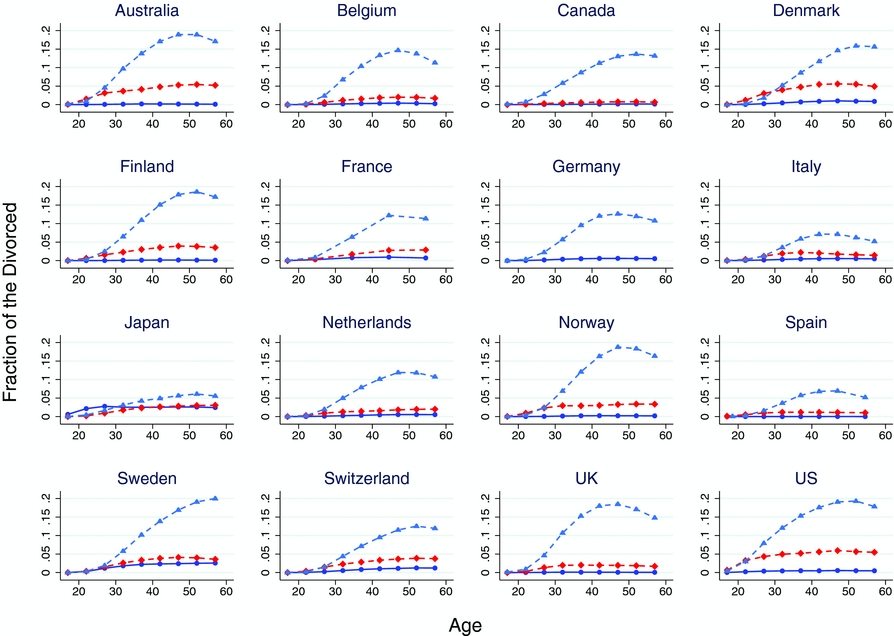
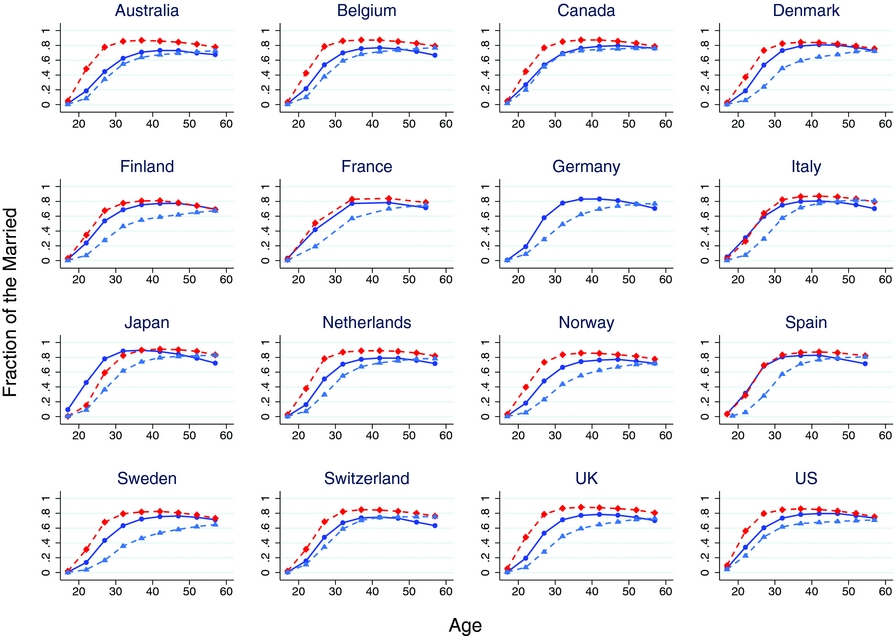
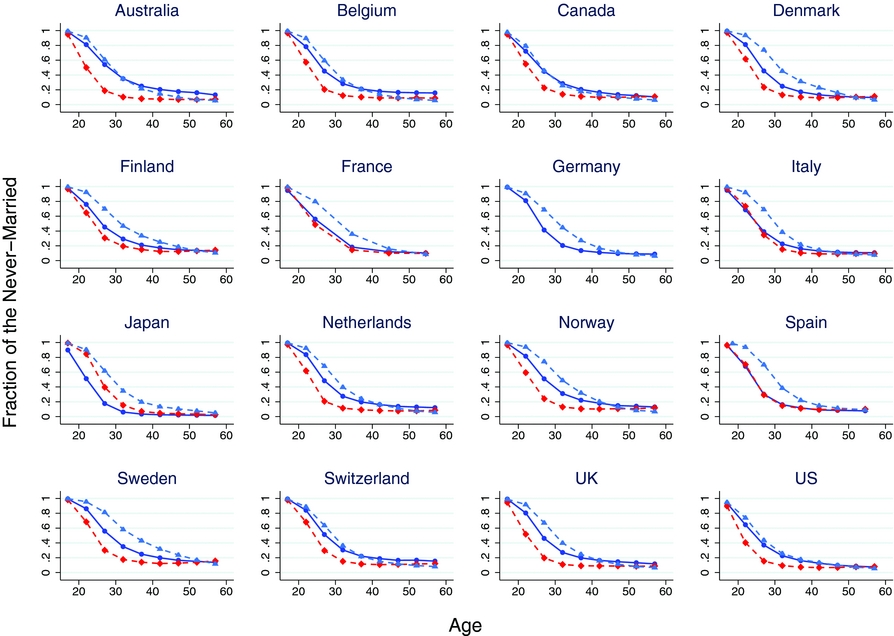
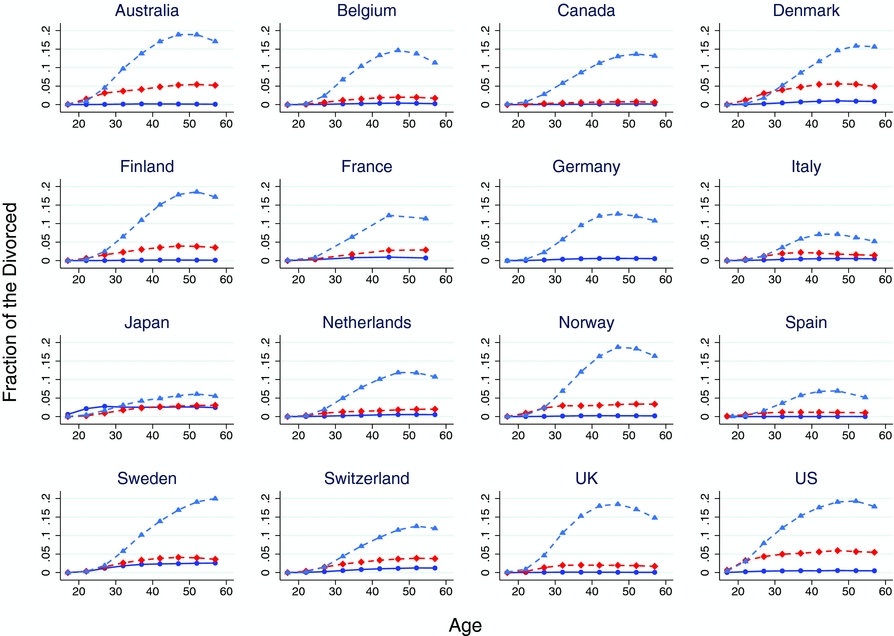
Figure D.1 reports the fraction of the married by 5-year age group.Footnote 19 In a large group of countries (Australia, Belgium, Canada, Denmark, Finland, Netherlands, Norway, Sweden, Switzerland, the United Kingdom and the United States), the increase in the fraction of married in the peak year is largely due to younger generations (20–40 years old) rather than older generations. In other countries like France, Italy, Japan, and Spain, this increase of the fraction of the married among younger generations at the peak year did not emerge. For Germany, data availability prevents the calculation of the age distribution at the peak year. The pattern for the fraction of the never-married, reported in Figure D.2, mirrors that for the fraction of the married. In the first group of countries, in which marriage increases more for younger generations, the fraction of the never-married decreases more for such a group than for the rest of the population. Instead, in France, Italy, Japan, and Spain, younger generations display a similar behavior as the rest of the population in terms of the never-married as well. Finally, Figure D.3 shows how the fraction of the divorced has increased over time. It increased especially among middle-age groups (around 50 years old). As a result, the fraction of divorced displays a notable hump-shaped pattern across age groups in the end year.
Fraction of the married by age group, OECD countries. The blue-solid line is for the initial year, the red-dashed line is for the peak year, and the light-blue-dashed line is for the end year. The initial year is set to 1900 for all countries except for Canada and Japan. For Canada, the initial year is 1910, while for Japan the initial year is 1920 due to availability of the data. The peak year for each country is defined as the peak year of the fraction of the married in Column (1) in Table 2. The end year is 2000 for all countries. For Germany, the data points at the peak year are missing due to the lack of data discussed in Section 3.1. For France, the marital statistics are available only by 10-year age group.
Fraction of the never-married by age group, OECD countries. The blue-solid line is for the initial year, the red-dashed line is for the peak year, and the light-blue-dashed line is for the end year. The initial year is set to 1900 for all countries except for Canada and Japan. For Canada, the initial year is 1910, while for Japan the initial year is 1920 due to availability of the data. The peak year for each country is defined as the peak year of the fraction of the married in Column (1) in Table 2. The end year is 2000 for all countries. For Germany, the data points at the peak year are missing due to the lack of data discussed in Section 3.1. For France, the marital statistics are available only by 10-year age group.
Fraction of the divorced by age group, OECD countries. The blue-solid line is for the initial year, the red-dashed line is for the peak year, and the light-blue-dashed line is for the end year. The initial year is set to 1900 for Australia, Belgium, Denmark, Finland, Netherlands, Norway, Switzerland, and the United States. For Canada, France, Germany, and Italy, the initial year is 1910 due to the availability of the divorce data. For Japan and the United Kingdom, the initial year is 1920. For Spain and Sweden, the initial year is 1950. The end year is 2000 for all countries. For Germany, the data points at the peak year are missing due to the lack of data discussed in Section 3.1. For France, the marital statistics are available only by 10-year age group.
APPENDIX E: FLOW RATE OF MARRIAGE
In this Appendix, we calculate the flow rate of marriage by age group for each country. We infer the flow rate from the cross-sectional age distribution of the number of the never-married in each census year t. For a given country, denote the number of never-married females in the jth age group in 5-year intervals as Sf t (j). Denote the probability that a single female in the jth age group will marry within a year as mf t (j). Then, the number of never-married females evolves according to
 $$\begin{eqnarray}
S_{t}^{f}\left(j+1\right) & =S_{t}^{f}\left(j\right)\left[1-m_{t}^{f}\left(j\right)\right]^{5}\left[1-\pi _{t}^{f}\left(j\right)\right]^{5},
\end{eqnarray}$$
where π f t (j) is the mortality rate for a female in the jth age group. Then, from Equation (4), we can derive
 $$\begin{eqnarray}
m_{t}^{f}\left(j\right) & =1-\left[\left(\frac{S_{t}^{f}\left(j+1\right)}{S_{t}^{f}\left(j\right)}\right)\left(\frac{1}{\left(1-\pi _{t}^{f}\left(j\right)\right)^{5}}\right)\right]^{\frac{1}{5}}.
\end{eqnarray}$$
We infer the mortality rate π f t (j) from the cross-sectional age distribution of the population in each census year. Namely, the mortality rate π f t (j) is given by
 $$\begin{equation*}
\pi _{t}^{f}\left(j\right)=1-\left[\left(\frac{T_{t}^{f}\left(j+1\right)}{T_{t}^{f}\left(j\right)}\right)\right]^{\frac{1}{5}},
\end{equation*}$$
where Tf t (j) is the total number of females in the jth age group in year t. Given the number of the never-married and the mortality rate for each age group, Equation (5) gives the annual likelihood of marriage by age group for a specific year.
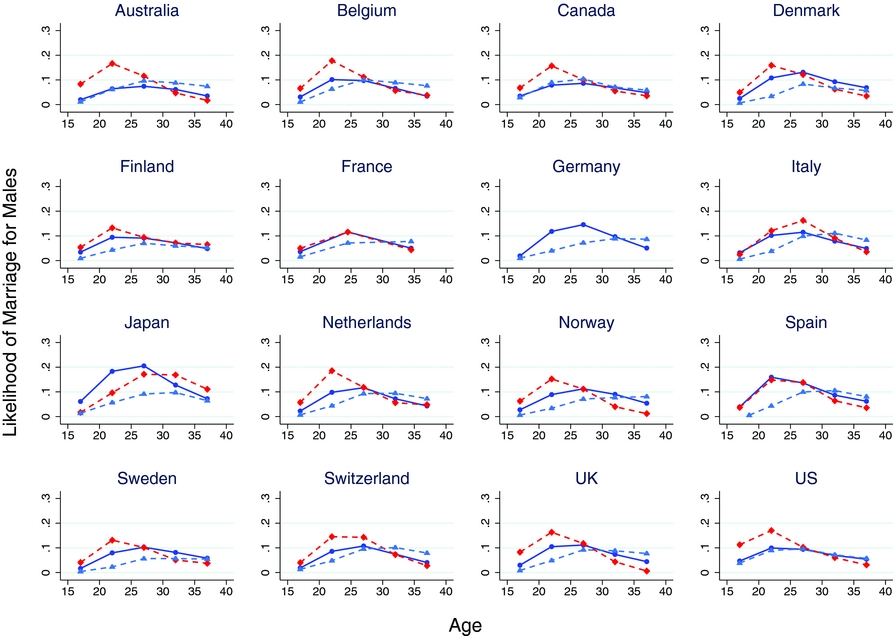
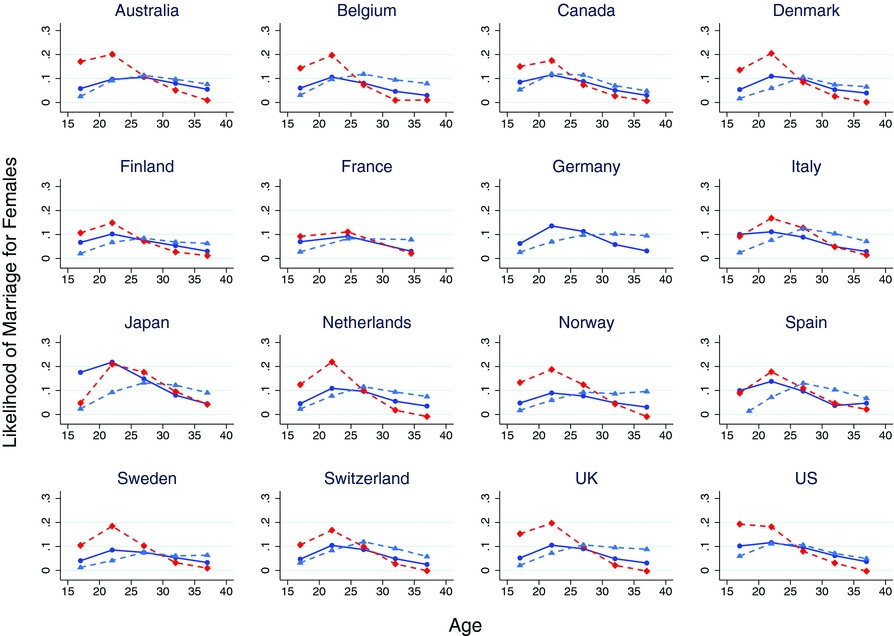
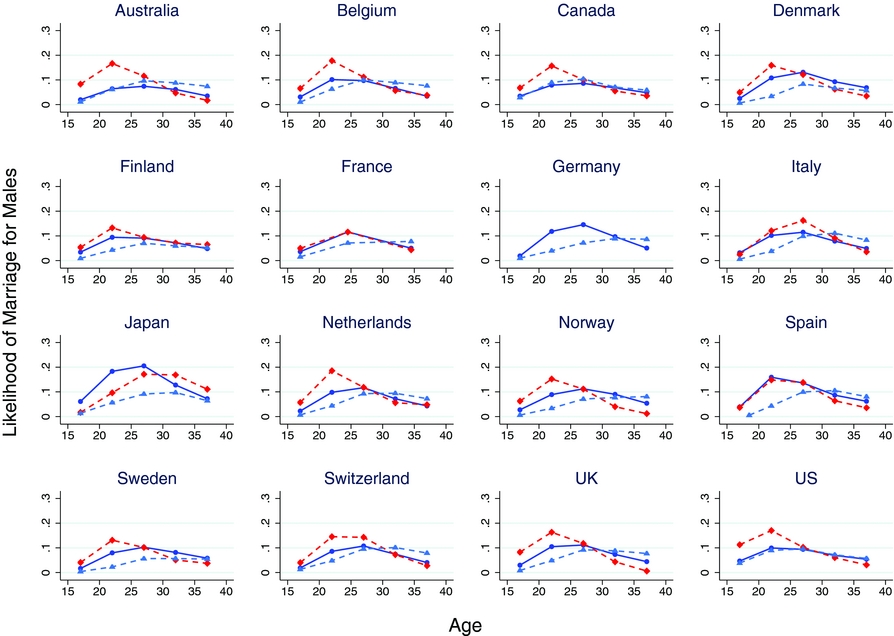
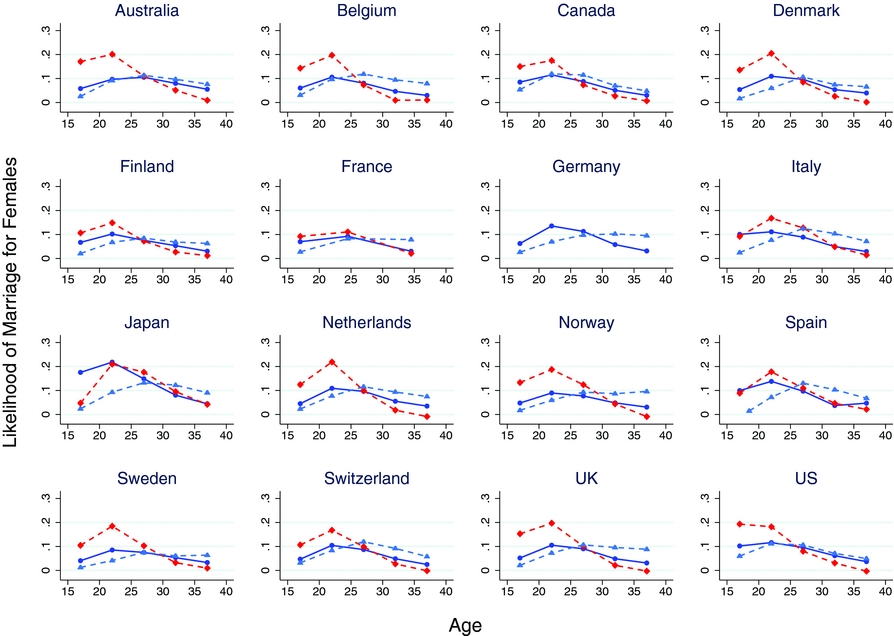
Figures E.1 and E.2 plot the calculated flow rate by age group for males and females, respectively. We report the flow rate for the initial, the final and the peak year for each country.Footnote 20 In these figures, the X-axis shows the middle point of age for each age group starting from the 15–19 years old group. The Y-axis labels the annual likelihood of marriage. The figures show that the annual likelihood of marriage increases for the younger age groups during the peak year. This pattern is observed both for males and females for most of the countries except for France, Italy, Japan, and Spain. For males, the largest increase is found especially in the 20–24 years old group, while for females it is in the 15–19 years old group.
Male’s annual likelihood of marriage by age group, OECD countries. The blue-solid line is for the initial year, the red-dashed line is for the peak year, and the light-blue-dashed line is for the end year. The initial year is set to 1900 for all countries except for Canada and Japan. For Canada, the initial year is 1910, while for Japan the initial year is 1920 due to availability of the data. The peak year for each country is defined as the peak year of the fraction of the married in Column (1) in Table 2. The end year is 2000 for all countries. For Germany, the data points at the peak year are missing due to the lack of data discussed in Section 3.1. For France, since the marital statistics are available only by 10-year age group, we calculate the flow rate also by 10-year age group.
Female’s annual likelihood of marriage by age group, OECD countries. The blue-solid line is for the initial year, the red-dashed line is for the peak year, and the light-blue-dashed line is for the end year. The initial year is set to 1900 for all countries except for Canada and Japan. For Canada, the initial year is 1910, while for Japan the initial year is 1920 due to availability of the data. The peak year for each country is defined as the peak year of the fraction of the married in Column (1) in Table 2. The end year is 2000 for all countries. For Germany, the data points at the peak year are missing due to the lack of data discussed in Section 3.1. For France, since the marital statistics are available only by 10-year age group, we calculate the flow rate also by 10-year age group.
APPENDIX F: REGRESSION ANALYSIS
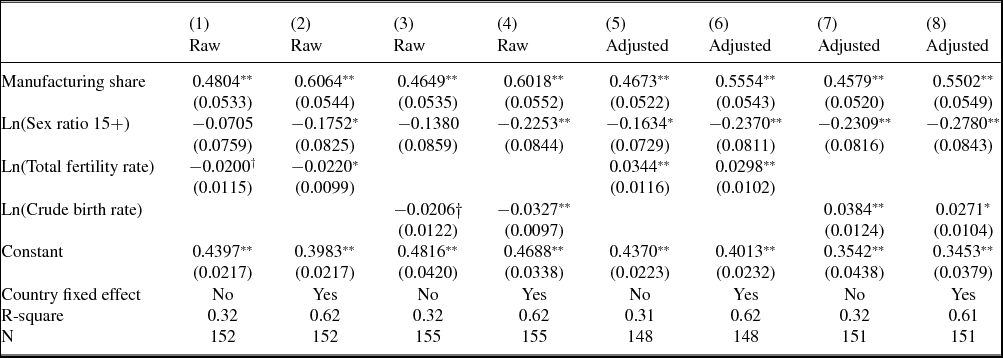
In this Appendix, we investigate whether the positive correlation between the fraction of the married and the manufacturing share is robust after controlling for other variables in the regression analysis. In the analysis, the dependent variable is the nominal value added share in manufacturing. Similar to the existing literature in this field, we employ several control variables: the sex ratio (the ratio of the number of males to the number of females), the total fertility rate, and the crude birth rate.Footnote 21 We control for the sex ratio because sex ratio imbalances can cause an increase or an decrease of marriages as documented in Angrist (Reference Angrist2002) and Abramitzky et al. (Reference Abramitzky, Delavande and Vasconcelos2011). The fertility rate and the crude birth rate are included in our regression analysis as Greenwood et al. (Reference Greenwood, Guner and Knowles2003) argue that the decision to get married and to have children are tightly linked.
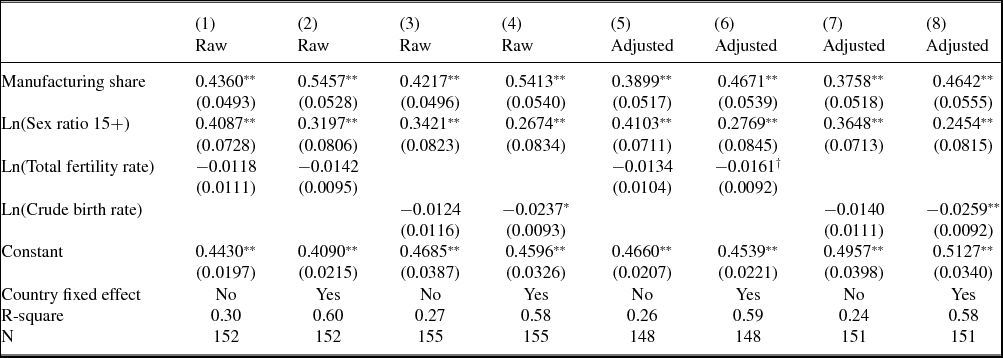
Table F.1 reports the regression results for the fraction of married men at age 15 and above for the raw data (Columns 1 through 4) and the age-adjusted data with the year 2000 as the base year (Columns 5 through 8), respectively, with or without country fixed effects. Similarly, Table F.2 reports the results of the same regressions for women. The coefficient on the manufacturing share is significant and positive for both men and women in all specifications; for men it ranges between 0.46 and 0.61, while for women it ranges between 0.38 and 0.55. If we consider the specification in Column (1) in both Tables, the results imply that one percentage point increase in manufacturing share raises the fraction of married men, by 0.48 percentage points, and fraction of married women by 0.44 percentage points. The results for the sex ratio are consistent with Angrist (Reference Angrist2002) and Abramitzky et al. (Reference Abramitzky, Delavande and Vasconcelos2011). The coefficient of the sex ratio for male’s regression is negative for all the specifications and significant at 5% level for the six out of all the eight specifications. For women, it is positively significant at 1% level for all specifications. Again, if we take the specification in Column (1) in the both tables, the results imply that 1% increase in the sex ratio decreases the fraction of married men by 0.07 percentage points, while it increases the fraction of married women by 0.41 percentage points. Finally, note that the coefficients of the total fertility rate and the crude birth rate often change their signs, and seem to have only negligible effects on the fraction of the married. These results confirm that the positive correlation between the fraction of the married and the nominal value added share of manufacturing is robust after controlling for other things that could possibly affect marriage.
Regression results for men at age 15 and above

Regression results for women at age 15 and above