



%20--%3e%3c!DOCTYPE%20svg%20PUBLIC%20'-//W3C//DTD%20SVG%201.0//EN'%20'http://www.w3.org/TR/2001/REC-SVG-20010904/DTD/svg10.dtd'%3e%3csvg%20version='1.0'%20id='Layer_1'%20xmlns='http://www.w3.org/2000/svg'%20xmlns:xlink='http://www.w3.org/1999/xlink'%20x='0px'%20y='0px'%20width='64px'%20height='64px'%20viewBox='5.5%20-3.5%2064%2064'%20enable-background='new%205.5%20-3.5%2064%2064'%20xml:space='preserve'%3e%3cg%3e%3ccircle%20fill='%23FFFFFF'%20fill-opacity='0'%20cx='37.785'%20cy='28.501'%20r='28.836'/%3e%3cpath%20fill='%23595959'%20d='M37.441-3.5c8.951,0,16.572,3.125,22.857,9.372c3.008,3.009,5.295,6.448,6.857,10.314%20c1.561,3.867,2.344,7.971,2.344,12.314c0,4.381-0.773,8.486-2.314,12.313c-1.543,3.828-3.82,7.21-6.828,10.143%20c-3.123,3.085-6.666,5.448-10.629,7.086c-3.961,1.638-8.057,2.457-12.285,2.457s-8.276-0.808-12.143-2.429%20c-3.866-1.618-7.333-3.961-10.4-7.027c-3.067-3.066-5.4-6.524-7-10.372S5.5,32.767,5.5,28.5c0-4.229,0.809-8.295,2.428-12.2%20c1.619-3.905,3.972-7.4,7.057-10.486C21.08-0.394,28.565-3.5,37.441-3.5z%20M37.557,2.272c-7.314,0-13.467,2.553-18.458,7.657%20c-2.515,2.553-4.448,5.419-5.8,8.6c-1.354,3.181-2.029,6.505-2.029,9.972c0,3.429,0.675,6.734,2.029,9.913%20c1.353,3.183,3.285,6.021,5.8,8.516c2.514,2.496,5.351,4.399,8.515,5.715c3.161,1.314,6.476,1.971,9.943,1.971%20c3.428,0,6.75-0.665,9.973-1.999c3.219-1.335,6.121-3.257,8.713-5.771c4.99-4.876,7.484-10.99,7.484-18.344%20c0-3.543-0.648-6.895-1.943-10.057c-1.293-3.162-3.18-5.98-5.654-8.458C50.984,4.844,44.795,2.272,37.557,2.272z%20M37.156,23.187%20l-4.287,2.229c-0.458-0.951-1.019-1.619-1.685-2c-0.667-0.38-1.286-0.571-1.858-0.571c-2.856,0-4.286,1.885-4.286,5.657%20c0,1.714,0.362,3.084,1.085,4.113c0.724,1.029,1.791,1.544,3.201,1.544c1.867,0,3.181-0.915,3.944-2.743l3.942,2%20c-0.838,1.563-2,2.791-3.486,3.686c-1.484,0.896-3.123,1.343-4.914,1.343c-2.857,0-5.163-0.875-6.915-2.629%20c-1.752-1.752-2.628-4.19-2.628-7.313c0-3.048,0.886-5.466,2.657-7.257c1.771-1.79,4.009-2.686,6.715-2.686%20C32.604,18.558,35.441,20.101,37.156,23.187z%20M55.613,23.187l-4.229,2.229c-0.457-0.951-1.02-1.619-1.686-2%20c-0.668-0.38-1.307-0.571-1.914-0.571c-2.857,0-4.287,1.885-4.287,5.657c0,1.714,0.363,3.084,1.086,4.113%20c0.723,1.029,1.789,1.544,3.201,1.544c1.865,0,3.18-0.915,3.941-2.743l4,2c-0.875,1.563-2.057,2.791-3.541,3.686%20c-1.486,0.896-3.105,1.343-4.857,1.343c-2.896,0-5.209-0.875-6.941-2.629c-1.736-1.752-2.602-4.19-2.602-7.313%20c0-3.048,0.885-5.466,2.658-7.257c1.77-1.79,4.008-2.686,6.713-2.686C51.117,18.558,53.938,20.101,55.613,23.187z'/%3e%3c/g%3e%3c/svg%3e)
%20--%3e%3c!DOCTYPE%20svg%20PUBLIC%20'-//W3C//DTD%20SVG%201.0//EN'%20'http://www.w3.org/TR/2001/REC-SVG-20010904/DTD/svg10.dtd'%3e%3csvg%20version='1.0'%20id='Layer_1'%20xmlns='http://www.w3.org/2000/svg'%20xmlns:xlink='http://www.w3.org/1999/xlink'%20x='0px'%20y='0px'%20width='64px'%20height='64px'%20viewBox='5.5%20-3.5%2064%2064'%20enable-background='new%205.5%20-3.5%2064%2064'%20xml:space='preserve'%3e%3cg%3e%3ccircle%20fill='%23FFFFFF'%20fill-opacity='0'%20cx='37.637'%20cy='28.806'%20r='28.276'/%3e%3cg%3e%3cpath%20fill='%23595959'%20d='M37.443-3.5c8.988,0,16.57,3.085,22.742,9.257C66.393,11.967,69.5,19.548,69.5,28.5c0,8.991-3.049,16.476-9.145,22.456%20C53.879,57.319,46.242,60.5,37.443,60.5c-8.649,0-16.153-3.144-22.514-9.43C8.644,44.784,5.5,37.262,5.5,28.5%20c0-8.761,3.144-16.342,9.429-22.742C21.101-0.415,28.604-3.5,37.443-3.5z%20M37.557,2.272c-7.276,0-13.428,2.553-18.457,7.657%20c-5.22,5.334-7.829,11.525-7.829,18.572c0,7.086,2.59,13.22,7.77,18.398c5.181,5.182,11.352,7.771,18.514,7.771%20c7.123,0,13.334-2.607,18.629-7.828c5.029-4.838,7.543-10.952,7.543-18.343c0-7.276-2.553-13.465-7.656-18.571%20C50.967,4.824,44.795,2.272,37.557,2.272z%20M46.129,20.557v13.085h-3.656v15.542h-9.944V33.643h-3.656V20.557%20c0-0.572,0.2-1.057,0.599-1.457c0.401-0.399,0.887-0.6,1.457-0.6h13.144c0.533,0,1.01,0.2,1.428,0.6%20C45.918,19.5,46.129,19.986,46.129,20.557z%20M33.042,12.329c0-3.008,1.485-4.514,4.458-4.514s4.457,1.504,4.457,4.514%20c0,2.971-1.486,4.457-4.457,4.457S33.042,15.3,33.042,12.329z'/%3e%3c/g%3e%3c/g%3e%3c/svg%3e)
1. Introduction
Stable density stratification is a key control on the dynamics of a wide range of natural and industrial settings, including: zonal winds (Dunkerton Reference Dunkerton1997) and atmospheric boundary layer flows (Mahrt Reference Mahrt2014); oceanic exchange flows (Káse, Girton & Sanford Reference Káse, Girton and Sanford2003) and gravity currents (Wells & Dorrell Reference Wells and Dorrell2021); and in manufacturing processes, bioreactors and heating. Stratification provides a restorative buoyancy force which suppresses internal mixing and has a profound impact on shear flows by introducing, for example, anisotropy, intermittency, layering and internal waves (Caulfield Reference Caulfield2021). Understanding these processes is vital for predictions of scalar transport (e.g. temperature, salinity, particulates), entrainment of ambient fluids and energy transport Winters et al. Reference Winters, Lombard, Riley and D'Asaro1995; Wells, Cenedese & Caulfield Reference Wells, Cenedese and Caulfield2010; Garaud Reference Garaud2018; Hung, Niu & Chou Reference Hung, Niu and Chou2020. Due to their importance and complexity, many decades have been spent attempting to understand stratified turbulence in canonical flows.
Here we focus on the idealised case of turbulent, stratified, plane Poiseuille (or channel) flow. The (unstratified) plane Poiseuille flow has received considerable interest over the last few decades, simulated with a doubly periodic domain bounded by no-slip walls in the vertical direction (here the  $y$ direction) and driven by a constant negative streamwise pressure gradient to achieve a fully developed and statistically steady state. Studies of turbulent channel flows have made key contributions to our understanding of wall-bounded turbulence (Kim, Moin & Moser Reference Kim, Moin and Moser1987; Moser, Kim & Mansour Reference Moser, Kim and Mansour1999; Del Alamo & Jiménez Reference Del Alamo and Jiménez2003; Vreman & Kuerten Reference Vreman and Kuerten2014; Jiménez Reference Jiménez2022). Yet its stratified counterpart has received comparatively little interest, despite being deeply rich in dynamics (Armenio & Sarkar Reference Armenio and Sarkar2002; Garcia-Villalba & Del Alamo Reference Garcia-Villalba and Del Alamo2011; Lloyd, Dorrell & Caulfield Reference Lloyd, Dorrell and Caulfield2022; Zonta, Sichani & Soldati Reference Zonta, Sichani and Soldati2022). In this case, stratification is imposed through a fixed density difference between upper and lower walls. A key feature of the stratified channel flow is that there is zero shear at the channel centreline, intersecting a region of strong buoyancy gradient. In natural flows such buoyancy and shear profiles can occur in gravity currents and jets, both of which are prolific in oceanic, atmospheric and Earth surface systems (Dorrell et al. Reference Dorrell, Peakall, Darby, Parsons, Johnson, Sumner, Wynn, Özsoy and Tezcan2019). Further, such natural flows are crucial for transporting sediment, salinity, heat, carbon, oxygen, nutrients and pollutants throughout the world's oceans, and are crucial for regulating global climate, influencing weather patterns and supporting marine ecosystems (Baines Reference Baines1998; Simpson Reference Simpson1999; Talling et al. Reference Talling, Masson, Sumner and Malgesini2012; Azpiroz-Zabala et al. Reference Azpiroz-Zabala, Cartigny, Talling, Parsons, Sumner, Clare, Simmons, Cooper and Pope2017). A deeper comprehension of such systems in idealised settings is essential to advance our understanding of complex real-world flows. This motivates our present study which aims to quantify the nature of coherent structures that emerge in stratified channel flow, and their dependence on shear and buoyancy.
The stratified channel flow is characterised by a Reynolds number, a Richardson number and a Prandtl number:
 \begin{equation} Re_\tau = \frac{u_\tau \delta}{\nu},\quad Ri_\tau = \frac{\delta g \Delta\rho}{\rho_0 u_\tau^2} \quad \text{and} \quad Pr = \frac{\nu}{\kappa}, \end{equation}
where  $u_\tau$ is the friction velocity,
 $\delta$ the channel half-height,
 $\nu$ represents the kinematic viscosity,
 $g$ is acceleration due to gravity (acting normal to the walls),
 $\Delta \rho$ is the density difference between the upper and lower walls,
 $\rho _0$ is a reference density and
 $\kappa$ represents mass diffusivity. Under suitably high Reynolds and Richardson numbers (although not so high that buoyancy forces globally suppress turbulence) a regime arises where turbulent processes dominate near the walls and buoyancy forces dominate near the centreline of the channel, dampening turbulence, restricting vertical mixing and sustaining large-scale coherent waves (Armenio & Sarkar Reference Armenio and Sarkar2002; Garcia-Villalba & Del Alamo Reference Garcia-Villalba and Del Alamo2011; Lloyd et al. Reference Lloyd, Dorrell and Caulfield2022; Zonta et al. Reference Zonta, Sichani and Soldati2022). Lloyd et al. (Reference Lloyd, Dorrell and Caulfield2022), through simulations at
 $Re_\tau = 550$ and
 $Ri_\tau = 480$, classified these regions as the inner region (
 $y \leq 0.2$ and
 $y \geq 1.8$) comprising the viscosity-affected boundary layer, the intermediate outer region (
 $0.2 < y \leq 0.8$ and
 $1.2 \leq y < 1.8$) and the buoyancy-dominated channel core (
 $0.8 < y < 1.2$). Here, the vertical coordinate
 $y$ has been made dimensionless by the channel half-height,
 $\delta$. Despite near-wall activity comprising strongly nonlinear dynamics, Lloyd et al. (Reference Lloyd, Dorrell and Caulfield2022) showed that the channel core was well described a series of linear waves. Analysis of the dispersion relation for these waves revealed two modes: ‘backward’-travelling waves (BWs) and ‘forward’-travelling waves (FWs), relative to the mean flow (i.e respectively with negative and positive intrinsic frequencies). The BWs were found to dominate the channel core with spectral energies several orders of magnitude higher than those of the FWs. Despite the strong spatial variance in the background shear and buoyancy profiles, the dispersion relation for the most dominant waves agreed reasonably well with the idealised dispersion relations for internal waves with constant convective velocity
 $U_0$ and buoyancy frequency
 $N_0$,
 \begin{equation} \omega \approx U_0 k_x \pm N_0, \end{equation}
where  $\omega$ represents temporal frequency and
 $k_x$ represents the streamwise wavenumber. The appropriate values of
 $U_0$ and
 $N_0$ were shown to be the vertically averaged values of
 $U$ and
 $N$ in the channel core (
 $0.8 < y < 1.2$), where
 $U$ and
 $N$ respectively represent the vertically varying temporally and planar-averaged streamwise velocity and buoyancy (Brunt–Väisälä) frequency. It remains unclear why such an idealised linear dispersion is appropriate for describing channel core dynamics. Lloyd et al. (Reference Lloyd, Dorrell and Caulfield2022) investigated generation of these waves by analysing the system of equations, linearised about the temporally and planar-averaged flow profiles, formulated as both a differential eigenvalue problem (the viscous Taylor–Goldstein (vTG) equations) and a stochastically forced initial-value problem. Through investigation of systems linearised about the temporally and planar-averaged flow profiles Lloyd et al. (Reference Lloyd, Dorrell and Caulfield2022) found that BWs were generated due to a sensitive response of the mean flow profiles to turbulent perturbations, originating in the outer regions of the flow, at the edge of the channel core. The continuous turbulent forcing in the outer regions of the flow excited stable coherent structures in the channel core.
Critically the two-dimensional (2-D) linearised framework used was unable to adequately explain the presence of the FWs observed in fully resolved simulations. Here the higher-frequency, forward-propagating, modes of the linearised system collapsed on  $\omega \approx U_{max} k_x$, indicative of centreline flow structures Doppler-shifted by the local flow velocity with an intrinsic frequency of zero. It remains unclear why backward modes are well predicted by linear theory while forward modes are not, unless the structures or mechanisms generating such waves are different. There are also open questions regarding how background shear and buoyancy forces affect the dominant modes, and why backward modes should dominate over forward modes in fully nonlinear simulations. Better understanding of such processes is essential to provide a more complete understanding of mixing in turbulent flows (Fukuda et al. Reference Fukuda, de Vet, Skevington, Bastianon, Fernández, Wu, McCaffrey, Naruse, Parsons and Dorrell2023).
The present study is focused on characterising both sets of waves in the stratified channel flow, regarding their dispersion relation and their dependence on the background flow profiles and forcing mechanisms, providing clear insight into where such structures could be expected to emerge in natural flows. This is achieved using a suite of linear models with solutions compared against those of nonlinear simulations. Our methodology is detailed in § 2. We first introduce the nonlinear simulations in § 2.1 which are an extension of those of Lloyd et al. (Reference Lloyd, Dorrell and Caulfield2022), integrated further in time to enable convergence of high-dimensional energy spectra, and then the linear framework and associated numerical methodology based upon the three-dimensional (3-D) vTG equations in § 2.2. Our findings are presented in § 3. In § 3.1 we compare nonlinear simulation spectra with solutions obtained using the vTG framework subject to background flow profiles obtained from the simulations, finding that both the BWs and FWs are well predicted by the linearised framework once spanwise structure has been taken into account. The sensitivity of solutions to the background shear and buoyancy profiles is explored in § 3.2. In addition, solutions are obtained for a simple piecewise inviscid system in § 3.3 to complement the vTG results. The linear models all show that there is an imbalance between the role of shear on the BWs when compared to the FWs, where the BWs are strongly dependent on shear at low wavenumbers. In § 3.4 we investigate the dependence of coherent structures on different forcing mechanisms, potentially providing an explanation to the dominance of the BWs, arising as a result of the precise nature of the forcing, where crucially low-momentum fluid is ejected into the channel core from the outer regions of the flow, preferentially generating BWs, relative to the local high-velocity flow. Finally, we discuss our findings in the wider context of stratified flows in § 4, concluding this study.
2. Methodology
In this section we provide an overview of the nonlinear model in § 2.1 and the linear framework in § 2.2.
2.1. Simulation details
We integrate the nonlinear model of Lloyd et al. (Reference Lloyd, Dorrell and Caulfield2022) further in time sampling data over a period  $T=75$, increased from
 $T=40$, to enable calculation of high-dimensional energy spectra, without requiring spatial averaging. The simulation solves the dimensionless momentum and continuity equations with a scalar transport equation for density:
 $$\begin{gather} \frac{\partial{\boldsymbol{u}}}{\partial{t}} + (\boldsymbol{u} \boldsymbol{\cdot} \boldsymbol{\nabla}) \boldsymbol{u} =- \boldsymbol{\nabla} p - Ri_\tau \rho' \boldsymbol{e}_y + \frac{1}{Re_\tau} \nabla^2 \boldsymbol{u} + \boldsymbol{f}, \end{gather}$$
 $$\begin{gather}\boldsymbol{\nabla} \boldsymbol{\cdot} \boldsymbol{u} = 0 \end{gather}$$
and
 \begin{equation} \frac{\partial{\rho}}{\partial{t}} + (\boldsymbol{u} \boldsymbol{\cdot} \boldsymbol{\nabla} ) \rho = \frac{1}{Pr \,Re_\tau}\nabla^2 \rho. \end{equation}
Here,  $\boldsymbol {u}=(u,v,w)$ represents the three-component velocity field,
 $p$ the pressure,
 $\rho$ the density field and
 $\boldsymbol {e}_y = (0,1,0)$ the vertical unit vector. The coordinate system
 $(x,y,z)$ corresponds to streamwise, vertical and spanwise directions, respectively. The density field
 $\rho$ is related to the buoyancy
 $b$ by
 $b = - Ri_\tau \rho$ and primes denote fluctuating components of a variable away from its planar and temporally averaged mean (
 $\rho = \bar {\rho } + \rho '$). The forcing term
 $\boldsymbol {f} = (1,0,0)$ is a (negative) streamwise constant pressure gradient. The dimensionless parameters are the Reynolds number with
 $Re_\tau = 550$, the Richardson number with
 $Ri_\tau = 480$ and the Prandtl number with
 $Pr = 1$. Equations are solved on an
 $L_x \times L_y \times L_z = 8{\rm \pi} \times 2 \times 3{\rm \pi}$ domain, with periodic boundary conditions applied in the streamwise (
 $x$) and spanwise (
 $z$) directions and no-slip conditions on the
 $y$-normal boundaries,
 $\boldsymbol {u} = 0$ at
 $y=0$ and
 $y=2$. Stratification is imposed using Dirichlet boundary conditions for the density field with
 $\rho = -\tfrac {1}{2}$ at
 $y=0$ and
 $\rho = \tfrac {1}{2}$ at
 $y=2$. Equations are discretised using
 $N_x \times N_y \times N_z = 80 \times 44 \times 40$ spectral elements, vertically distributed with a hyperbolic stretching function to refine near-wall elements. Each element is further discretised by
 $8^3$ Gauss–Lobatto–Legendre nodes, and solved using NEK5000 (Version 19.0, Argonne National Laboratory, IL, USA). Equations are integrated in time using third-order backward differencing with a time step
 $\Delta t = 1\times 10^{-4}$. This grid resolution is sufficient to fully resolve flow dynamics in the vertical direction, but insufficient in the horizontal directions. Subsequently we adopt modal-based explicit filtering to account for unresolved dissipation. Further simulation details and validation are reported in Lloyd et al. (Reference Lloyd, Dorrell and Caulfield2022). Pseudo-steady data are collected over an integration time of
 $T=75$, sampled on a
 $y$-normal slice at
 $y=1.0$ and a
 $z$-normal slice at
 $z=L_z/2$ every 20 time steps. For clarity we describe the notation used in regard to spectra throughout this paper. We present either 2-D or 3-D spectra in this paper, with the dimensions relating to those that have been Fourier-transformed. With temporal windowing,
 $z$-normal snapshots enable calculation of 2-D spectra,
 $E^{2D}(k_x,y,\omega )$ at
 $z=L_z/2$, while
 $y$-normal snapshots enable 3-D spectra calculations,
 $E^{3D}(k_x,k_z,\omega )$ at
 $y=1$.
While  $u_\tau$ is the obvious velocity scale for numerical simulation, we find that the planar and temporally averaged velocity maximum,
 $u_c/u_\tau = \bar {u}_{max} = 40.49$, is the more appropriate velocity scale for characterising waves in the channel core (note that the overbar represents a planar and temporally averaged variable). For this reason, all data presented in the following sections, unless otherwise stated, are rescaled by the centreline (maximum) velocity,
 $u_c$. This is particularly useful for comparison against idealised systems in §§ 3.2 and 3.3. We therefore define
 $U = \bar {u} u_\tau / u_c$ with
 $U_{max} = 1$, and
 $B = - Ri_c \bar {\rho }$, where
 $Ri_c = Ri_\tau u_\tau ^2 / u_c^2 = 0.293$. The Reynolds number based on the centreline velocity is
 $Re_c = Re_\tau u_c / u_\tau = 22\,270$.
2.2. Formulation of the linear framework
Following Liu, Thorpe & Smyth (Reference Liu, Thorpe and Smyth2012) and Lloyd et al. (Reference Lloyd, Dorrell and Caulfield2022), the dimensionless governing momentum transport equation (2.1) is reformulated such that turbulence is assumed small scale, acting through vertically varying coefficients of effective viscosity:
 \begin{equation} \frac{\partial{\boldsymbol{u}^*}}{\partial{t}} + (\boldsymbol{u}^* \boldsymbol{\cdot} \boldsymbol{\nabla} ) \boldsymbol{u}^* =- \boldsymbol{\nabla} p^* + b^* \boldsymbol{e}_y + \boldsymbol{\nabla}_H \boldsymbol{\cdot} ( A_H \boldsymbol{\nabla}_H \boldsymbol{u}^* ) + \frac{\partial{}}{\partial{y}} \left( A_V \frac{\partial{\boldsymbol{u}^*}}{\partial{y}} \right). \end{equation}
Here the superscript  $*$ represents a field once its small-scale turbulent component has been subtracted and the velocity scale for non-dimensionalisation is taken as the centreline velocity,
 $u_c$. All remaining scalings are as per § 2.1. Terms
 $A_H$ and
 $A_V$ represent the resultant vertically varying horizontal and vertical eddy coefficients of effective viscosity, respectively. These effective viscosities comprise turbulent and viscous components, and are assumed to be independent of the horizontal (
 $x$,
 $z$) directions. The gradient operators are defined as
 $\boldsymbol {\nabla } = (\partial /\partial x, \partial /\partial y, \partial /\partial z)$ and
 $\boldsymbol {\nabla }_H = (\partial /\partial x, 0, \partial /\partial z)$. Mass continuity is imposed with a divergence-free velocity field,
 \begin{equation} \boldsymbol{\nabla} \boldsymbol{\cdot} \boldsymbol{u}^* = 0, \end{equation}
and buoyancy transport is governed by
 \begin{equation} \frac{\partial{b^*}}{\partial{t}} + (\boldsymbol{u}^* \boldsymbol{\cdot} \boldsymbol{\nabla} ) b^* = \boldsymbol{\nabla}_H \boldsymbol{\cdot} ( K_H \boldsymbol{\nabla}_H b^* ) + \frac{\partial{}}{\partial{y}} \left( K_V \frac{\partial{b^*}}{\partial{y}} \right), \end{equation}
where  $K_H$ and
 $K_V$ are horizontal and vertical eddy coefficients of effective diffusivity, respectively. Like
 $A_H$ and
 $A_V$ these are assumed independent of horizontal directions.
Equations are linearised about steady background vertically varying velocity, kinematic pressure and buoyancy profiles,  $\boldsymbol {U} = (U(y),0,0)$,
 $P(y)$ and
 $B(y)$, with perturbations from these profiles given by
 $\boldsymbol {u}''$,
 $p''$ and
 $b''$. Neglecting nonlinearity, and assuming mean flow terms are in balance, allows transport equations for the vertical velocity and buoyancy perturbations to be decoupled from spanwise and streamwise velocity perturbations:
 \begin{equation} \frac{\partial{}}{\partial{t}}\nabla^2 v'' + U \frac{\partial{}}{\partial{x}} \nabla^2 v'' - \frac{\text{d}^2 U}{\text{d} y^2} \frac{\partial{v''}}{\partial{x}} = \nabla_H^2 b'' + D_v v'' \end{equation}
and
 \begin{equation} \frac{\partial{b''}}{\partial{t}} + v''\frac{\text{d} B}{\text{d} y} + U \frac{\partial{b''}}{\partial{x}} = D_b b''. \end{equation}
The diffusive operators  $D_v$ and
 $D_b$ are defined as
 \begin{equation} D_v = A_H \nabla_H^4 + \nabla_H^2 \frac{\partial{}}{\partial{y}} \left( (A_H + A_V) \frac{\partial{}}{\partial{y}} \right) + \frac{\partial^2 }{\partial y^2} \left( A_V \frac{\partial^2 }{\partial y^2} \right) \end{equation}
and
 \begin{equation} D_b = \boldsymbol{\nabla}_H \boldsymbol{\cdot} ( K_H \boldsymbol{\nabla}_H ) + \frac{\partial{}}{\partial{y}} \left( K_V \frac{\partial{}}{\partial{y}}\right). \end{equation}
General normal mode solutions are are sought of the form  $v'' = \hat {v}(y) \exp ({\rm i}k_x x + {\rm i}k_z z + \lambda t)$ and
 $b'' = \hat {b}(y) \exp ({\rm i}k_x x + {\rm i}k_z z + \lambda t)$, allowing for general vertical dependence of the complex amplitudes or eigenfunctions
 $\hat {v}$ and
 $\hat {b}$. Here
 $k_x$ and
 $k_z$ represent streamwise and spanwise wavenumbers, and
 $\lambda = \sigma - {\rm i}\omega$ represents a complex growth rate or eigenvalue related to the real growth rate
 $\sigma$ and the temporal frequency
 $\omega$. Substitution into the linear equations leads to
 $$\begin{gather} \lambda \Delta \hat{v} = \left(- {\rm i} k_x U \varDelta + {\rm i} k_x \frac{\text{d}^2 U}{\text{d} y^2} + \hat{D}_v \right)\hat{v} - \tilde{k}^2 \hat{b}, \end{gather}$$
 $$\begin{gather}\lambda \hat{b} =-\frac{\text{d} B}{\text{d} y}\hat{v} + ( - {\rm i} k_x U + \hat{D}_b) \hat{b}, \end{gather}$$
where  $\varDelta = {\rm d}^2/{{\rm d}\kern 0.05em y}^2 - \tilde {k}^2$,
 $\tilde {k} = \sqrt {k_x^2 + k_z^2}$ represents the wavenumber magnitude and the diffusive operators are defined as
 \begin{equation} \hat{D}_v = \tilde{k}^4 A_H - \tilde{k}^2 \frac{\text{d} }{\text{d} y} \left( (A_H + A_V) \frac{\text{d} }{\text{d} y} \right) + \frac{\text{d}^2 }{\text{d} y^2} \left( A_V \frac{\text{d}^2 }{\text{d} y^2} \right) \end{equation}
and
 \begin{equation} \hat{D}_b = \tilde{k}^2 K_H + \frac{\text{d} }{\text{d} y} \left( K_V \frac{\text{d} }{\text{d} y} \right). \end{equation}
These equations can subsequently be reformulated as an eigenvalue problem:
 \begin{equation} \lambda \begin{bmatrix} \varDelta & 0 \\ 0 & I \end{bmatrix} \begin{bmatrix} \hat{v} \\ \hat{b} \end{bmatrix} = \begin{bmatrix} \displaystyle- {\rm i} k_x U \varDelta + {\rm i} k_x \frac{\text{d}^2 U}{\text{d} y^2} + \hat{D}_v & - \tilde{k}^2 \\ \displaystyle- \frac{\text{d} B}{\text{d} y} & - {\rm i} k_x U + \hat{D}_b \end{bmatrix} \begin{bmatrix} \hat{v} \\ \hat{b} \end{bmatrix}, \end{equation}
where  $I$ represents the identity matrix. This form of the eigenvalue problem advances on previous work (Lloyd et al. Reference Lloyd, Dorrell and Caulfield2022) by including dependence on a spanwise wavenumber. Assuming diffusive operators take contributions only from molecular viscous/diffusive processes reduces the eigenvalue problem (2.15) to that derived in Smyth & Carpenter (Reference Smyth and Carpenter2019), equations (6.14) and (6.15).
For given  $k_x$ and
 $k_z$ (or wavenumber magnitude
 $\tilde {k}$ and angle of obliquity
 $\theta = {\rm arctan}\,k_z/k_x$), and specified vertically varying profiles of background velocity
 $U$, buoyancy
 $B$ and effective viscosities/diffusivities
 $A_H$,
 $A_V$,
 $K_H$ and
 $K_V$, the differential eigenvalue problem (2.15) can be (numerically) solved to obtain the complex growth rates (eigenvalues)
 $\lambda$ and associated structure functions (eigenvectors)
 $\hat {v}$ and
 $\hat {b}$. The background velocity and buoyancy profiles are taken as the temporally and planar-averaged simulation profiles. To ensure the background flow profiles satisfy the leading-order balance of (2.4) to (2.6), the effective viscosity and diffusivities are taken as
 $A_H = A_V = 1/Re_c + \nu _t$ and
 $K_H = K_V = 1/Pr \,Re_c + \kappa _t$, where
 $\nu _t = - \overline {u'v'}/\bar {u}_y$ and
 $\kappa _t = - \overline {b'v'}/\bar {b}_y$ represent turbulent contributions. It should be noted, however, that solutions are insensitive to this particular choice of coefficients. The inclusion of viscosity is primarily for numerical regularisation, particularly in regions of critical layers which are singular in the inviscid TG equations. As we show in §§ 3.1 and 3.2, inclusion of
 $\nu _t$ and
 $\kappa _t$ has a minimal influence on the dominant modes, since they arise in the channel core where turbulence is suppressed. In addition, the sensitivity of solutions to
 $Re_c$ is explored in this study, finding that its influence on the dispersion relation is negligible for the large
 $Re_c$ investigated herein.
We should also comment on the appropriateness of linearisation over the entire channel height despite nonlinear dynamics dominating the flow near the walls. We justify this by noting that the dominant modes that arise are limited to the channel core region where turbulence is suppressed by strong buoyancy gradients. While this region is coupled to the outer regions of the flow, the nature of the channel core dynamics has been shown to be insensitive to the precise form of this coupling, where stochastic excitement leads to structures consistent with those of nonlinear simulations (Lloyd et al. Reference Lloyd, Dorrell and Caulfield2022).
The eigenvalue problem (2.15) is numerically solved, with discrete operators derived using Chebyshev polynomials with a  $y$-directional resolution of
 $N=401$ grid points. Six boundary conditions are required to close the system. Consistent with the nonlinear simulation boundary conditions we specify
 $\hat {v} = 0$,
 $\hat {v}_y = 0$ and
 $\hat {b} = 0$ at the lower and upper boundaries (
 $y = 0$ and
 $y=2$, with
 $y$ made dimensionless by the channel half-height
 $\delta$), implemented using a ‘give-back’ matrix, following the procedure outlined by Lian, Smyth & Liu (Reference Lian, Smyth and Liu2020). Solutions to the eigenvalue problem (2.15) for a given
 $k_x$ and
 $k_z$ are the growth rates
 $\sigma$ and the frequencies
 $\omega$ with associated structure functions
 $\hat {v}$ and
 $\hat {b}$.
3. Results
To provide context for the analysis of the linear models in this paper, we first reproduce some of the key findings of Lloyd et al. (Reference Lloyd, Dorrell and Caulfield2022) in figure 1, which presents time- and planar-averaged statistics as a function of vertical coordinate  $y$, and 2-D spectra
 $E^{2D}(k_x,\omega )$ at the channel centreline
 $y=1$, obtained from the nonlinear simulations. Consistent with previous findings (Armenio & Sarkar Reference Armenio and Sarkar2002; Garcia-Villalba & Del Alamo Reference Garcia-Villalba and Del Alamo2011; Lloyd et al. Reference Lloyd, Dorrell and Caulfield2022; Zonta et al. Reference Zonta, Sichani and Soldati2022), the flow is characterised by the steep buoyancy gradient in the core of the channel, the high velocity gradients at the walls and the velocity maximum at the centreline which corresponds to a negative minimum in
 $U_{yy}$. While the motivation for the choice of bounds for the channel core
 $(0.8 < y < 1.2)$ in Lloyd et al. (Reference Lloyd, Dorrell and Caulfield2022) was qualitative, figure 1(b) shows that the core of the channel, characterised by the strong negative peak in
 $U_{yy}$, is bounded by positive maxima in
 $U_{yy}$ at
 $y \approx 0.8$ and
 $y \approx 1.2$. These local maxima arise due to the jet-like sharpening of the velocity profile in the core, a result of the strong buoyancy gradients and therefore suppressed turbulent viscosity. Indeed, the eddy viscosity and diffusivities shown in figure 1(c) are smaller than those of corresponding molecular processes (
 $\nu _t/\nu \approx \kappa _t/\kappa \lesssim 1$) in the channel core, by at least an order of magnitude near the centreline.
Time- and planar-averaged profiles of (a) velocity and buoyancy, (b) buoyancy derivative and second velocity derivative and (c) eddy viscosity/diffusivity. Shaded regions represent approximate bounds of the inner region ( $y \leq 0.2$ and
 $y \geq 1.8$), the outer region (
 $0.2 < y \leq 0.8$ and
 $1.2 \leq y < 1.8$) and the channel core (
 $0.8 < y < 1.2$). (d) Spanwise-averaged 2-D energy spectra of buoyancy perturbations at
 $y=1$, as a function of streamwise wavenumber
 $k_x$ and intrinsic temporal frequency
 $\omega -U_{max} k_x$. The lines represent different dispersion relations. Subscript ‘max’ denotes maximum values and subscript ‘mean’ denotes the average value in the channel core region.

Spanwise ( $z$)-averaged 2-D spectra
 $E_{b b}^{2D}(k_x,\omega )$ are presented in figure 1(d), calculated using
 $y$-normal snapshots at the channel centreline,
 $y=1$. Spectra are calculated using the method of Welch (Reference Welch1967) with a 50 % overlap Hamming window of length 4096 snapshots in time. Here the dispersion relation is shown as a function of the intrinsic frequency,
 $\omega - U_{max} k_x$; positive values indicate structures propagating faster than the local (maximum) flow speed, while negative values indicate structures propagating backwards relative to the local flow. Backward-propagating structures dominate dynamics in the core, although note that relative to the strong local streamwise velocity, vertical perturbations are reasonably small, with
 $\text {rms}(v)/U_{max} \lesssim 0.02$ (Lloyd et al. Reference Lloyd, Dorrell and Caulfield2022). Following Lloyd et al. (Reference Lloyd, Dorrell and Caulfield2022), three linear dispersion relations are also plotted in figure 1(d), with
 $N^2 = B_y$:
 $\omega = U_{max} k_x$,
 $\omega = U_{max} k_x \pm N_{max}$ and
 $\omega = U_{mean} k_x \pm N_{mean}$, where subscript ‘max’ represents the maximum value of a variable (for
 $N$ and
 $U$ this corresponds to their values at
 $y=1$) and subscript ‘mean’ represents variables spatially averaged in the channel core region,
 $0.8 < y < 1.2$. The dispersion relations
 $\omega = U_{max} k_x \pm N_{max}$ and
 $\omega = U_{mean} k_x \pm N_{mean}$ correspond to highly idealised linear internal waves derived assuming the system has a constant buoyancy frequency and velocity. While these are sweeping assumptions, the simulation spectra show reasonable agreement with the dispersion relation
 $\omega = U_{mean} k_x - N_{mean}$ where the spectral energy is largest, corresponding to a ‘backward’-travelling essentially linear internal wave, relative to the mean flow. ‘Forward’-travelling waves are also present in the flow, although their peak in spectral energy is at least an order of magnitude lower than that of the BWs. In this paper, we show that while the idealised linear dispersion relation based upon the maximum values in the channel is a good approximation to the limiting behaviour of the dominant modes, the dispersion relation at low
 $\tilde {k}$ is strongly dependent on the background shear profile rather than mean values across the channel core. We therefore omit the dispersion relation
 $\omega = U_{mean} k_x \pm N_{mean}$ from the remaining figures in the rest of the paper.
3.1. Linear model predictions
Dispersion relations obtained using the 3-D vTG framework subject to the nonlinear simulation base profiles are presented in figure 2. Solutions are obtained for four spanwise wavenumbers  $k_z$ over a wide range of streamwise wavenumbers
 $k_x$, and visualised using the log-scaled growth rate,
 $\sigma$. Note that all modes are stable (
 $\sigma < 0$), and while the logarithmic scaling on the growth rate of figure 2 emphasises the differences in growth rates between the dominant modes, both are reasonably close to marginally stable, particularly when
 $k_x$ and
 $k_z$ are small.
Dispersion relation predictions for 3-D vTG solutions, visualised using the growth rate  $\sigma$, with background profiles and parameters taken from simulation data. Solutions obtained with spanwise wavenumbers of (a)
 $k_z = 0$, (b)
 $k_z = 2$, (c)
 $k_z = 8$ and (d)
 $k_z = 40$. Dash-dotted lines are marked in each panel representing the dominant modes: FW and BW. Horizontal lines are as per figure 1(c).

Solving the 3-D vTG equations with increasing values of  $k_z$ (figure 2) leads to a significant deviation from the
 $k_z=0$ solutions, particularly for the forward-propagating modes. As
 $k_z$ increases, the two dominant modes migrate towards the idealised dispersion relation,
 $\omega = U_{max} k_x \pm N_{max}$. This limiting behaviour is explained when investigating idealised systems in § 3.2. Interestingly the forward modes maintain their near-zero (marginally stable) growth rates as
 $k_z$ increases, while the backward modes weaken.
The solution with  $k_z=0$ (figure 2a) is a reproduction of the 2-D vTG predictions adopted by Lloyd et al. (Reference Lloyd, Dorrell and Caulfield2022). When compared against the 2-D spanwise-averaged spectra of figure 1 it is clear that while the form of the BW dispersion relation is well predicted, that of the FW is not. This poor prediction is entirely due to the spanwise-averaging performed on the spectra. To directly compare with nonlinear simulations we have calculated 3-D spectra
 $E_{b b}^{3D}(k_x,k_z,\omega )$ at
 $y=1$. To improve convergence, the temporal Hamming window has been halved to 2048 snapshots with respect to the 2-D spectra calculations of figure 1. Spectra are shown in figure 3 for the same four
 $k_z$ values as in figure 2 and directly compared against the dominant vTG modes, marked by the dash-dotted lines. The 3-D energy spectra indicate excellent agreement between the simulations and the vTG solutions, with both the FWs and BWs migrating towards
 $\omega = U_{max} k_x \pm N_{max}$ as
 $k_z$ increases. In addition, the FWs are detected over the full frequency axis limits in figure 3, unlike figure 1 where spectral energies decay significantly as
 $k_x$ increases. The backward waves are largely 2-D, demonstrated by their substantial decrease in energy content as
 $k_z$ increases. In contrast, the spectral energy content of the forward waves is considerably less sensitive to
 $k_z$, even for
 $k_z=8$ (figure 3c). In agreement with vTG solutions, the spectral energy of the forward waves grows in amplitude relative to that of the backward waves as
 $k_z$ increases; while they never dominate over the backward waves, they do become an important feature.
The 3-D energy spectra of buoyancy perturbations at  $y=1$, as a function of streamwise wavenumber
 $k_x$, spanwise wavenumber
 $k_z$ and temporal frequency
 $\omega$. Spectra obtained for spanwise wavenumbers of (a)
 $k_z = 0$, (b)
 $k_z = 2$, (c)
 $k_z = 8$ and (d)
 $k_z = 40$. Dash-dotted lines represent the dominant modes obtained from the vTG solutions of figure 2. Lines are as per figure 1(c).

Clearly, spanwise structure is a vital component for both the nonlinear simulations and the vTG solutions; accounting for  $k_z$ leads to excellent agreement between linear stability analysis and fully nonlinear simulations, for both sets of waves. When neglecting spanwise information by averaging in
 $z$ (as per figure 1) the FWs are smeared out due to their presence over a wider range of
 $k_z$, and the dependence of their dispersion relation on
 $k_z$.
While fixing  $k_z$ for each panel of figures 2 and 3 is a natural choice for the nonlinear simulation data, interpretation of the dispersion relations is difficult due to the changing angle of obliquity
 $\theta$ as
 $k_x$ increases, where
 $\tan \theta = k_z / k_x$ or
 $\cos \theta = k_x / \tilde {k}$. At low
 $k_x$ the modes of figures 2 and 3 are more oblique (higher
 $\theta$) than at high
 $k_x$. To resolve this we present the dispersion relations for the vTG solutions with constant angles of obliquity in figure 4:
 $\tan \theta = 0$, 1, 2 and 4, as a function of the wavenumber magnitude,
 $\tilde {k}$. First note that the dispersion relations of all modes intersect the origin with
 $\tilde {k}=0$ and
 $\omega = 0$, unlike figures 2 and 3. In addition,
 $\theta$ has a smaller influence on the dispersion relation than
 $\tilde {k}$; its influence is restricted primarily to the BW in the region
 $\tilde {k} \lesssim 25$. The (negative) intrinsic frequency of the BW reduces as
 $\tilde {k}$ increases from zero until it reaches its maximum growth rate, at which point its intrinsic frequency starts increasing with increasing
 $\tilde {k}$. This turning point is not present in the FW dispersion relation. As we show in § 3.2, the turning point in the BW dispersion relation at low
 $\tilde {k}$ is strongly dependent on the background shear.
Dispersion relation predictions for vTG solutions, visualised using the growth rate  $\sigma$, with background profiles and parameters taken from simulation data. Solutions obtained with increasing angles of obliquity: (a)
 $\tan \theta = 0$, (b)
 $\tan \theta = 1$, (c)
 $\tan \theta = 2$ and (d)
 $\tan \theta = 4$. Lines are as per figure 2.

At high  $\tilde {k}$ the BWs and FWs very clearly tend towards
 $\omega = U_{max} k_x \pm N_{max}$, demonstrating that the wavenumber magnitude
 $\tilde {k}$ is the key control on limiting behaviour. As
 $\tilde {k}$ and
 $\theta$ increase, the growth rate of the FW monotonically decreases. In contrast, the BW has a maximum growth rate at
 $\tilde {k} \approx 4$ which decays as
 $\tilde {k}$ increases further. Both the BW and FW become more stable as
 $\tilde {k}$ increases, and are therefore likely to quickly decay when compared with the near marginally stable modes at low
 $\tilde {k}$. These features are consistent with the simulation spectra of figure 3. A clear discrepancy between the linear stability analysis and the simulations is the dominance of the FW over the BW in the linear solutions; this is revisited in § 3.4.
The vertical structure of the dominant modes is assessed by calculating  $E_{v v}^{2D}(k_x,y,\omega )$ and
 $E_{b b}^{2D}(k_x,y,\omega )$ using
 $z$-normal snapshots. These spectra are reported as a function of frequency
 $\omega$ and height
 $y$ for a given wavenumber
 $k_x$ in figure 5, and compared against the vertically varying dispersion relations
 $U k_x$ and
 $U k_x \pm N$. It is important to note, however, that spanwise structure cannot be assessed using the
 $z$-normal slice data. Nevertheless, the vertical dependence of
 $E^{2D}$ does reveal some additional insights. The BWs appear to have a near-constant frequency for a given
 $k_x$, with its main spectral energy bound by the channel core
 $0.8 < y < 1.2$ before reducing in magnitude in the outer regions. The backward wave has a frequency a little less than the average of
 $U k_x - N$, for these values of
 $k_x$. The FWs are less well defined, due to the lack of spanwise structure information. Like the backward waves, the forward waves have wave speeds a little less than
 $U k_x + N$, for these values of
 $k_x$. The vertical bounds of the forward waves are also less clear, but appear narrower in form than those of the backward waves, particularly at
 $k_x=4$, with most energy concentrated near
 $y=1$. In addition to the channel core waves two peaks are revealed near the bounds of the core with wave speeds matching the mean flow velocity,
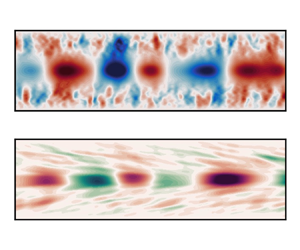
 $U$, particularly in the buoyancy spectra. We speculate that these peaks are associated with the hairpin vortices that are ejected into the core from the outer region of the flow (Lloyd et al. Reference Lloyd, Dorrell and Caulfield2022). In penetrating the strongly stratified core they generate large-scale waves whilst being accelerated to the local mean flow velocity before dissipating their kinetic energy.
The 2-D energy spectra obtained on a spanwise normal slice at  $z=L_z/2$. For a given
 $k_x$, spectra are shown as a function of height
 $y$ and frequency
 $\omega$. (a,c) Spectra for
 $k_x = 2$; (b,d) energy spectra for
 $k_x = 4$. (a,b) Spectra based on vertical velocity fluctuations; (c,d) spectra based on buoyancy fluctuations. Labels of (c) indicate signals arising from BWs, FWs and hairpin vortex ejection events (HP). Horizontal lines represent bounds of the channel core region:
 $y=0.8$ and
 $y=1.2$.

The vertically varying simulation spectra of figure 5 can be compared against vTG solutions by slicing through the dataset at the frequencies associated with the BW and FW, for a given  $k_x$, observed in figure 6. The vTG solution growth rates are directly compared against energy spectra at
 $y=1$ with
 $k_x=2$ and
 $k_x=4$. The BWs and FWs are marked with crosses for the vTG solutions and stars for the spectra. The energy contained in the vertically varying structure functions of the identified FW and BW vTG modes,
 $\hat {v}^{\dagger} \hat {v}$ for vertical velocity and
 $\hat {b}^{\dagger} \hat {b}$ for buoyancy, are reported in figure 6(b,d,f,h), and compared against
 $E_{vv}^{2D}(k_x,y,\omega )$ and
 $E_{bb}^{2D}(k_x,y,\omega )$ at the identified
 $\omega$ and
 $k_x$. Direct comparisons are limited by the lack of spanwise structure in the simulation spectra, yet there is reasonable agreement between vTG solutions and simulations when observing their vertical modal structure for the marked modes (figure 6), which peak in the channel core and reduce to zero in the outer regions of the flow. Despite the lack of spanwise structure in the spectra, we see reasonable agreement between linear stability solutions and the spectra for most modes. The BWs are well reproduced aside from buoyancy structure at
 $(k_x,k_z)=(4,8)$, where we see instability in the outer regions of the flow. This arises due to critical levels, where the local wave speed of the modes matches the background velocity. This behaviour was also reported by Lloyd et al. (Reference Lloyd, Dorrell and Caulfield2022). The majority of the FWs are reasonably well predicted, particularly for the buoyancy structure, although less so than the BWs. We expect that the poorer agreement between vertical velocity spectra and vTG solutions for the FWs is due to the lack of spanwise structure in the spectra, which, as previously discussed, significantly smears the dispersion relation of the FWs. This smearing of the modes could also explain the broader peaks in spectra when compared with vTG solutions, although this could also be due to nonlinear processes at the edge of the core, where interactions with turbulent structures diffuse the sharp peaks.
Comparison between simulation energy spectra and vTG structure functions for BW and FW (see figure 5). (a,c,e,g) The vTG eigenvalue solutions, growth rate  $\sigma$ as a function of temporal frequency
 $\omega$, for given wavenumbers
 $k_x$ and
 $k_z$. Lines represent simulation 2-D energy spectra
 $E_{vv}^{2D}(k_x,y,\omega )$ at
 $y=1$ and the same
 $k_x$ as the vTG solutions. (b,d,f,h) Comparison of the vertical velocity (i) and buoyancy (ii) structure function energies (
 $\hat {v}^{\dagger} \hat {v}$ and
 $\hat {b}^{\dagger} \hat {b}$) as a function of height
 $y$, for the FW and BW modes marked by a cross (
 $\boldsymbol {\times }$) in (a,c,e,g), respectively. The BW and FW frequencies obtained from the 2-D spanwise-averaged energy spectra of figure 5 for the given
 $k_x$ are marked as stars (
 $\star$) in (a,c,e,g). Panels (b,d,f,h) compare their corresponding vertically varying energy spectra
 $E^{2D}_{vv}$ (i) and
 $E^{2D}_{bb}$ (ii) at the marked frequency
 $\omega$ with vTG solutions. In (b,d,f,h), simulation data are marked with solid lines, while vTG solutions are marked with dashed lines.

The linear stability analysis gives a good prediction of channel core dynamics (particularly the dispersion relations of figures 2 and 3), for both the BWs and FWs, once spanwise structure has been taken into account. There are, however, several key open questions regarding the nature of these waves. What are the key processes governing the dispersion and structure of these waves? What are the key parameters and features of the background flow profiles that lead to such a dispersion relation? And what governs the limiting behaviour of the modes,  $\omega = U_{max} k_x \pm N_{max}$?
The first of these questions can be answered by assessing the balance between diffusive processes, shear and buoyancy on the vTG solutions. This is achieved by computing the balance of their corresponding terms in the vTG eigenvalue problem (2.15):
 \begin{equation} \underbrace{-(\lambda + {\rm i} k_x U ) \Delta \hat{v}}_{\mathcal{C}_v} + \underbrace{- \tilde{k}^2 \hat{b}}_{\mathcal{B}_v} + \underbrace{\hat{D}_v \hat{v}}_{\mathcal{D}_v} + \underbrace{{\rm i} k_x \frac{\text{d}^2 U}{\text{d} y^2} \hat{v}}_{\mathcal{S}_v}= 0 \end{equation}
and
 \begin{equation} \underbrace{-(\lambda + {\rm i} k_x U ) \hat{b}}_{\mathcal{C}_b} + \underbrace{-\frac{\text{d} B}{\text{d} y}\hat{v} }_{\mathcal{B}_b} + \underbrace{\hat{D}_b \hat{b}}_{\mathcal{D}_b}= 0, \end{equation}
where  $\mathcal {C}$ represents convective terms,
 $\mathcal {B}$ represents buoyancy terms,
 $\mathcal {S}$ represents shear terms,
 $\mathcal {D}$ represents diffusive terms and the subscripts represent budgets for either the vertical velocity equation (
 $\hat {v}$) or the buoyancy equation (
 $\hat {b}$). The balance of these terms at two different values of
 $\tilde {k}$ and
 $\tan \theta$ can be observed in figures 7 and 8. The spatial structures of the eigenfunctions for the marked eigenvalues in panels (a) and (b) are reported in panels (c) and (d) for the BW and (e) and (f) for the FW. Here we only report the streamwise and vertical spatial structure of the modes for brevity. The particular values of
 $\tilde {k}$ and
 $\tan \theta$ in figures 7 and 8 are chosen as representative of two different regimes. The FW for both small and large
 $\tilde {k}$ is vertically narrow, particularly for the buoyancy structure, peaking at
 $y=1$. The vertical structure of the BW appears much wider, and experiences some shearing across the critical levels. When comparing the modal structure of the FW between figures 7 and 8 it is clear that increasing
 $\tilde {k}$ and
 $\tan \theta$ leads to a narrower structure. As
 $\tilde {k}$ grows further and the dispersion relations of both dominant modes tend towards the idealised dispersion relation, their spatial structure narrows and focuses more tightly around the centreline (not shown).
Modal structure and budgets for the vTG solutions of figure 4 with  $\tan \theta = 0$. (a) As per figure 4(a). (b) The growth rate as a function of intrinsic frequency for
 $\tilde {k} = 4$. The horizontal lines added to (a,b) are as per figure 4. The BWs and FWs are marked with crosses in (a,b), and have their spatial structure and associated budgets reported in (c–j). (c,d,g,h) Associated with BW and (e,f,i,j) associated with FW. (c,e) The vertical velocity spatial structure
 $v''(x,y) = {\rm Re} (\hat {v}\exp ({\rm i} k_x x))$ and (d,f) the buoyancy spatial structure
 $b''(x,y) = {\rm Re} (\hat {b}(\exp {\rm i} k_x x))$. (g,i) Vertical velocity budgets in the channel core with labels corresponding to (3.1). (h,j) Buoyancy budgets in the channel core with labels corresponding to (3.2). Line styles in (g–j) represent real components (solid) and imaginary components (dashed). Horizontal dashed lines in (c,d,g,h) represent critical levels where
 $c = U$.


The corresponding budgets of the BW and FW are markedly different from each other for the two choices of  $\tilde {k}$ and
 $\tan \theta$. At low
 $\tilde {k}$ and
 $\tan \theta$, the vertical velocity budget for the BW is balanced primarily by the shear and convective terms, with only a small influence of buoyancy and viscosity. In contrast, buoyancy dominates the transport of
 $\hat {v}$ for the FW, balanced primarily by shear with a weak contribution from convection, at low
 $\tilde {k}$ and
 $\tan \theta$. The wavenumber magnitude has a strong influence on this balance. The role of shear is minor for both the FW and the BW at high
 $\tilde {k}$ and
 $\tan \theta$, where both modes are governed by the balance between convective and buoyancy terms, with only a small contribution from diffusion and shear. Note that the diffusive term is small at
 $y=1$ and only influences the solution near the edges of the core where the critical levels are present (
 $y \approx 0.75$ and
 $y \approx 1.25$).
The BW therefore transitions from a shear-dominated regime at low  $\tilde {k}$ and
 $\tan \theta$ to a buoyancy-dominated regime at high
 $\tilde {k}$ and
 $\tan \theta$. While not shown here, this transition is primarily controlled by
 $\tilde {k}$, although
 $\theta$ does play a role by increasing the effective strength of the background stratification, and therefore increasing the buoyancy term of (3.1), as per the Squire transform (Smyth & Carpenter Reference Smyth and Carpenter2019). In contrast to the BW, buoyancy dominates the dynamics of the FW even at low
 $\tilde {k}$, but shear also influences its dispersion relation until
 $\tilde {k}$ is large.
It is also informative to assess the influence of the Reynolds and Richardson numbers on the vTG solutions. Noting that the dominant modes are only weakly dependent on the diffusive terms (figures 8 and 9) we approximate the viscous and diffusive coefficients by  $A_h = A_v = K_h = K_v = 1/Re_c$. This has a negligible influence on the dispersion relation (further evidence for this is provided in § 3.2, where we investigate solution sensitivity to the background buoyancy and shear profiles), and enables a direct control of the magnitude of the viscous/diffusive terms through
 $Re_c$. Figure 9 reports the dependence of vTG solutions on
 $Re_c$ and
 $Ri_c$ for
 $k_x = 4$ and
 $k_z=0$. First note that the Reynolds number only has a weak influence on the solution, only influencing dynamics when
 $Re_c \lesssim 1000$. It should, however, be appreciated that its influence scales like
 $\tilde {k}^2$, from inspection of the eigenvalue problem (2.15). We therefore expect the Reynolds number to become more important for large
 $\tilde {k}$.
Reynolds (a) and Richardson (b) number dependence of the vTG solutions with background profiles taken from simulation spectra for  $k_x = 4$ and
 $k_z = 0$, as a function of intrinsic frequency
 $\omega - U_{max} k_x$. The horizontal line represents
 $\omega = U_{max}k_x = 0$.

In contrast to the Reynolds number, it is clear that the Richardson number has a great influence on the dispersion relation. As  $Ri_c$ increases, the intrinsic frequency deviates further from zero for both the BW and FW. Perhaps the most surprising result from figure 9 is that the BW is present, and in fact has its highest (and unstable) growth rate when
 $Ri_c = 0$. The FW is also present and approximately critically stable, but converges towards
 $\omega -U_{max} k_x = 0$ as
 $Ri_c$ reduces. A third mode, between BW and FW, emerges at small Richardson number. This mode (not shown) corresponds to an asymmetric mode with peaks near the edge of the channel core corresponding to the maxima in
 $U_{yy}$ (figure 1). This mode is also present in other vTG solutions (e.g. figure 4) but is significantly weaker than the dominant modes in the channel.
Of course, the background flow profiles are also sensitive to changes in the Reynolds and Richardson numbers. However, the sensitivity of the modes to  $Ri_c$ in isolation of background profiles is highly informative; buoyancy is not a vital component for the BW to emerge, but does have a strong influence on its dispersion. This implies, from inspection of the vTG equations (2.15), that the background shear profile
 $U_{yy}$ is the vital component for producing these modes. Indeed, assessment of the balance between vTG terms reveals that the BW transitions from a shear-dominated regime to a buoyancy-dominated regime as
 $\tilde {k}$ increases. Given the BW is primarily governed by shear in the
 $\tilde {k}$ regime where it dominates, it is perhaps more suitable to refer to these modes as vorticity–gravity waves. While buoyancy is necessary for the suppression of turbulence in the core, and therefore the development of the jet-like velocity profile, shear is the primary control on the development of the dominant backward-propagating vorticity–gravity wave. To further our understanding of the role of buoyancy and shear in the dispersion relation, and vertical structure of the modes, we investigate numerical solutions to the vTG equations using idealised background flow profiles in the following section.
3.2. Linear solutions with idealised base flows
So far we have demonstrated that large-scale waves dominate the core of stratified channel flow, with a strong presence of oblique waves, governed by linear mechanisms. Both forward and backward waves are present, and have a distinct dispersion relation, but it is unclear what properties of the velocity and density profiles lead to such behaviour. This section will develop our understanding of these waves by investigating the numerical solutions to the vTG equations, subject to the flow profiles of figure 10. In addition, we demonstrate that solutions are insensitive to the inclusion of eddy diffusivity. We therefore set  $A_H = A_V = K_H = K_V = 1/Re_c$ with
 $Re_c = 22\,270$, for the idealised flow profiles.
Velocity and buoyancy profiles with their derivatives, for the idealised stability problems (§ 3.2). (a) Velocity profiles for the  $\text {log}$-
 $\text {sech}$ function (3.3) represented with dash-dotted lines, the
 $\text {sech}$ function (3.5) represented with dashed lines and the simulation data represented with solid lines. The
 $\text {log}$-
 $\text {sech}$ profile is calculated with
 $w_u^1=12.8$ and the
 $\text {sech}$ profile with
 $w_u^2 = 3.6$. (b) First and (c) second derivatives of the velocity profiles in (a). (d) Buoyancy profiles for the
 $\tanh$ function (3.4) represented with dotted lines and the simulation data represented with solid lines. Idealised profiles are calculated with
 $Ri_c = 0.293$ and
 $w_b = 3.9$. (e) The first derivative of the buoyancy profiles in (d). (f) Gradient Richardson number profiles for the simulation data and the continuous idealised profiles.

All idealised profiles are based upon the characteristics of those obtained through the nonlinear simulations, with a velocity maximum at  $y=1$ and no-slip boundaries at
 $y=0$ and
 $y=2$, normalised by the channel half-height. Here, the velocity scale is taken as the velocity maximum,
 $u_c$, such that
 $Ri_c = \Delta \rho g \delta / \rho _0 u_c^2$. Assuming the velocity maximum and corresponding negative
 $U_{yy}$ are the key drivers governing the dispersion of these waves, we first obtain solutions for a
 $\text {log}$-
 $\text {sech}$ velocity profile and a
 $\tanh$ buoyancy profile:
 \begin{equation} U = \frac{1}{ \ln (\cosh(w_u^1))}\ln \left(\frac{\text{sech}(w_u^1(y-1))}{{\rm sech}(w_u^1)}\right) \end{equation}
and
 \begin{equation} B = Ri_c \tfrac{1}{2}\tanh(w_b(y-1)). \end{equation}
Here  $w_u^1$ and
 $w_b$ control the ‘sharpness’ of the velocity and buoyancy interfaces at
 $y=1$. This particular choice of buoyancy profile is well motivated due to the close agreement with simulation data, aside from near-wall statistics far from the channel core. The velocity profile is chosen assuming that the key feature required to reproduce the dominant modes is the large negative peak in
 $U_{yy}$ at the centreline, and other complexities can be neglected. Like the nonlinear simulation profiles, at
 $y=1$ these idealised profiles have a velocity maximum, a minimum in
 $U_{yy}$ and a maximum in
 $B_y$. Parameter values are chosen such that
 $U_{yy}$ and
 $B_y$ coincide with simulation data at
 $y=1$ (figure 10):
 $w_u^1 = 12.8$,
 $w_b = 3.9$ and
 $Ri_c = 0.293$.
In addition to the  $\text {log}$-
 $\text {sech}$ velocity profile, solutions are also sought for
 $\text {sech}$ profiles of the form
 \begin{equation} U = \frac{\text{sech}(w_u^2(y-1)) -\text{sech}(w_u^2)}{1-\text{sech}(w_u^2)}. \end{equation}
This choice leads to both a minimum in  $U_{yy}$ at
 $y=1$ and two maxima either side of the core region. With
 $w_u^2 = 3.6$ the minimum in
 $U_{yy}$ matches that of the simulation data. The magnitudes of the two maxima in
 $U_{yy}$ are approximately consistent with simulation data (figure 10), although their location is further from the centreline than simulation profiles. Regardless, this choice of profile enables assessment of the role of these maxima on the dominant modes.
Figure 10(f) shows the gradient Richardson number,  $Ri_g = N^2 / S^2$ with
 $S = U_y$, for the simulation solutions and the analytical profiles, as a measure of stability. All three sets of profiles obtain a buoyancy-dominated core region (high
 $Ri_g$) and a shear-dominated outer region (low
 $Ri_g$). The two sets of idealised profiles show lower
 $Ri_g$ in the outer regions than the simulation profiles, but do obtain a similar
 $y$ value where
 $Ri_g \approx 0.2$, before rapidly increasing in the channel core.
Solutions to the vTG equations are sought for both sets of profiles, following the numerical procedure outlined in § 2.2.
The dispersion relation obtained using the  $\text {log}$-
 $\text {sech}$ velocity profile and
 $\tanh$ buoyancy profile is shown in figure 11, and directly compared with the dominant modes of § 3.1. There are clear similarities between these solutions and the nonlinear simulations. The simplified system obtains the same two dominant modes and correctly predicts their limiting behaviour at large
 $\tilde {k}$. The FW is predicted in excellent agreement with the reference profiles. There are two notable differences between figures 11 and 4. Firstly, while there is a turning point in the dispersion relation for the BW in both the idealised vTG solutions and those based on simulation profiles, the idealised system reaches the turning point at a lower
 $\tilde {k}$ than the simulation-based solutions. Secondly, the reduced system has a third dominant mode at a very low and negative intrinsic frequency. This mode corresponds to instabilities at the boundaries rather than the core of the channel and is therefore ignored in this study.
Dispersion relation predictions for vTG solutions, visualised using the growth rate  $\sigma$, for the idealised
 $\text {log}$-
 $\text {sech}$ velocity profile (3.3) and
 $\tanh$ buoyancy profile (3.4). Solutions obtained with increasing angles of obliquity: (a)
 $\tan \theta = 0$, (b)
 $\tan \theta = 1$, (c)
 $\tan \theta = 2$ and (d)
 $\tan \theta = 4$. Dashed lines represent reference leading-order modes (BW and FW) obtained for the system using nonlinear simulation profiles (figure 4). Horizontal lines represent idealised dispersion relations based on
 $U_{max}$ and
 $N_{max}$, as detailed in figure 1(c).

The dispersion relations obtained using the  $\text {sech}$ velocity profile are shown in figure 12. Solutions are similar to those of the
 $\text {log}$-
 $\text {sech}$ profiles and the simulation data; at high
 $\tilde {k}$ both dominant modes collapse to the same limiting behaviour, and the FW is reproduced over the full
 $\tilde {k}$ and
 $\theta$ range. The only region where differences emerge is for the BW at low
 $\theta$ and low
 $\tilde {k}$, where the
 $\text {sech}$ profile leads to a larger deviation from the reference dispersion relation. Given the buoyancy profile is reasonably consistent between both idealised profiles and the reference profile (figure 10), the deviation of BW solutions from the reference data at low
 $\theta$ and
 $\tilde {k}$ is consistent with previous findings, since this is the region where shear is the dominant mechanism generating the BW.
Dispersion relation predictions for vTG solutions, visualised using the growth rate  $\sigma$, for the idealised
 $\text {sech}$ velocity profile (3.5) and
 $\tanh$ buoyancy profile (3.4). Solutions obtained with increasing angles of obliquity: (a)
 $\tan \theta = 0$, (b)
 $\tan \theta = 1$, (c)
 $\tan \theta = 2$ and (d)
 $\tan \theta = 4$. Dashed lines represent reference leading-order modes (BW and FW) obtained for the system using nonlinear simulation profiles (figure 4). Horizontal lines represent idealised dispersion relations based on
 $U_{max}$ and
 $N_{max}$, as detailed in figure 1(c).

Solutions obtained for the two idealised profiles and profiles of the nonlinear simulations are directly compared in figure 13, for  $\theta = 0$. Dispersion relations for the dominant modes are directly compared in figure 13(a), and the vertically varying structure functions for the BW and FW at
 $\tilde {k} = 4$ are compared in figure 13(b–e). In addition to the data obtained using vertically varying eddy viscosity/diffusivity coefficients (detailed in § 2.2) solutions are also shown for constant coefficients (
 $\nu = \kappa = 1/Re_c$) respectively denoted turb. and lam. in figure 13. Dispersion relations for the two sets of solutions are indistinguishable, as are their structure functions, aside from the buoyancy functions for the BW in the region of the critical levels, where the increased viscosity associated with the turb. solutions smooths the local peak. This further justifies the choice of constant viscosity/diffusivity for the idealised solutions. Of particular note is the close agreement between the structure functions of all four sets of solutions, aside from the buoyancy structure for the BW at the region of the critical levels. Differences in the shear profiles leads to only minor differences in the vertical structure of the dominant modes. Qualitatively, the dominant modes observed in the channel core of nonlinear simulations can be reproduced with a simple idealised velocity and buoyancy profile consisting of a velocity maximum, a negative
 $U_{yy}$ and maximum in
 $B_y$, at the centreline.
Comparisons between vTG solutions obtained using nonlinear simulation profiles and idealised profiles for  $\theta = 0$. Reference profiles are obtained with a constant viscosity/diffusivity (lam.) and a turbulent viscosity/diffusivity (turb.). Idealised profiles are the
 $\text {log}$-
 $\text {sech}$ and
 $\text {sech}$ velocity profiles with the
 $\tanh$ buoyancy profile. (a) The dispersion relations for the dominant modes and (b–e) vertically varying structure functions at
 $\tilde {k} = 4$, marked by the vertical dashed line in (a).

The limiting behaviours of the dispersion relations for both the FW and BW have been consistent for all vTG solutions so far, tending towards  $\omega - U_{max} k_x = \pm N_{max}$ as
 $\tilde {k} \rightarrow \infty$. Given that buoyancy dominates the flow over buoyancy at large
 $\tilde {k}$ (figures 7 and 8) four further vTG solutions are sought for shear-free velocity profiles (
 $U=1$) and
 $\tanh$ buoyancy profiles (3.4), with varying values of
 $Ri_c$ and
 $w_b$, hypothesising that the thickness of the buoyancy interface, and the buoyancy gradient at the centreline, are the key controls on this limiting behaviour. The dispersion relations for these additional cases can be observed in figure 14.
Dispersion relation predictions for vTG solutions, visualised using the growth rate  $\sigma$, based upon a shear-free (
 $U=1$) flow with a
 $\tanh$ buoyancy profile (3.4). All solutions are obtained with
 $\tan \theta = 0$. (a–d) Solutions obtained with different values of
 $w_b$ and
 $Ri_c$, but with consistent buoyancy gradients at the centreline,
 $\max (B_y) = \tfrac {1}{2} Ri_c w_b$. Lines represent idealised dispersion relations based on
 $U_{max}$ and
 $N_{max}$, detailed in figure 4.

The four values of  $Ri_c$ and
 $w_b$ have been chosen such that
 $N_{max} = \max (B_y) = \frac {1}{2} w_b Ri_c$ is consistent for all cases, and with the nonlinear simulation data. The dispersion relations obtained for the flows free from shear are symmetric about
 $\omega - U_{max} k_x = 0$; the BW and FW modes are equal but opposite in sign. This is an unsurprising result, but confirms that the asymmetry between the FW and BW of the non-uniform velocity profiles arises due to the influence of shear (this is revisited in § 3.3). The FW and BW dispersion relations of the shear-free flows tend towards the same solutions as those with shear of figures 11 and 12 at high
 $\tilde {k}$. The key difference between the four cases of figure 14 is the rate at which the FWs and BWs converge towards the limiting behaviour,
 $\omega - U_{max} k_x = \pm N_{max}$ as
 $\tilde {k}$ increases. A small value of
 $w_b$ leads to quicker convergence towards the high-
 $\tilde {k}$ limit than when
 $w_b$ is larger. In other words, the sharper the density interface (higher
 $w_b$), the slower the convergence towards the idealised dispersion relation.
The limiting behaviour of the shear-free system can be explained by this behaviour, noting that as  $\tilde {k}$ increases, the vertical extent of the dominant modes reduces and focuses more tightly around the channel centreline (see figures 7 and 8, and related discussion). As this occurs, the buoyancy gradient across the vertical extent of the dominant modes tends towards an approximately constant value, depending on the interface thickness (controlled by
 $w_b$). Therefore, as
 $\tilde {k}$ increases, the dominant modes tend towards the idealised dispersion relation for a system with a constant buoyancy gradient. A thinner buoyancy interface (higher
 $w_b$) requires narrower spatial modes before this limit is reached, shifting convergence towards the limiting behaviour towards higher
 $\tilde {k}$. This can be readily extended to the sheared profiles of the nonlinear simulations and the idealised systems, given that the influence of shear reduces as
 $\tilde {k}$ increases, until eventually buoyancy dominates the flow. Therefore, as
 $\tilde {k}$ is increased, the system behaves as if shear were negligible and the buoyancy frequency was constant, leading to the limit
 $\omega = U_{max} k_x \pm N_{max}$.
To summarise this section, it has been demonstrated that the crucial ingredients required to qualitatively reproduce the dominant modes observed in the core of turbulent stratified plane Poiseuille flow are a velocity maximum, with a corresponding negative  $U_{yy}$, intersecting a region of strong buoyancy gradient. The limiting behaviour of the dominant mode dispersion relations,
 $\omega - U_{max} k_x = \pm N_{max}$, at high
 $\tilde {k}$ arises due to the negligible influence of shear at high wavenumbers, and the reduced vertical extent of the dominant modes, such that the local flow tends towards that of a shear-free flow with a constant buoyancy gradient. Changes in the shear profile affect the backward-propagating mode at low wavenumbers, but have little influence on the forward-propagating mode. A potential explanation for this asymmetry is provided in the following section, where we explore analytical solutions to the inviscid TG equations using piecewise profiles.
3.3. Analytical inviscid solutions
An open question remains regarding the differences between the FW and BW at low  $\tilde {k}$, where the BW is governed primarily by shear with a weak dependence on buoyancy and the FW is governed by buoyancy with a weaker dependence on shear. Here we explore analogous solutions to the inviscid TG equations using piecewise velocity and buoyancy profiles as an approximation to the smooth profiles of § 3.2 (figure 10). Inviscid analytical solutions to the piecewise TG equations have been invaluable for the study of instabilities in stratified shear flows (Baines & Mitsudera Reference Baines and Mitsudera1994; Caulfield Reference Caulfield1994; Carpenter et al. Reference Carpenter, Tedford, Heifetz and Lawrence2011; Smyth & Carpenter Reference Smyth and Carpenter2019), and are particularly insightful due to their interpretability. It is of course anticipated that resultant dispersion relations will comprise interfacial waves, with dispersion relations largely inconsistent with those obtained for the smooth profiles of §§ 3.1 and 3.2. Yet despite this, this section shows that there are key similarities between the solutions, offering a potential explanation to the disparity between the influence of shear on the BW and FW.
The inviscid TG equations are obtained from the vTG eigenvalue problem (2.15). Neglecting the terms  $\hat {D}_v \hat {v}$ and
 $\hat {D}_b \hat {b}$, and relating the eigenvalues
 $\lambda$ to the wave speed
 $c$ by
 $\lambda = -{\rm i} k_x c$ leads to the differential eigenvalue problem (Smyth & Carpenter Reference Smyth and Carpenter2019)
 \begin{equation} \hat{v}_{yy} + \left[ \frac{\tilde{k}^2}{k_x^2} \frac{B_y}{ (U - c)^2 } - \frac{ U_{yy}}{ (U - c)} - \tilde{k}^2 \right] \hat{v} = 0. \end{equation}
Note that the wave-vector angle appears only through the buoyancy term,  $\tilde {k}^2 / k_x^2 = 1 / \cos ^2 \theta$. We seek solutions to piecewise velocity and buoyancy profiles:
 \begin{equation} U = \begin{cases} 2 - y, & y \geq 1, \\ y, & y \leq 1, \end{cases} \end{equation}
where  $U_{max} = 1$, and
 \begin{equation} B = Ri_c\begin{cases} 0.5, & y \geq 1, \\ -0.5, & y \leq 1. \end{cases} \end{equation}
These profiles are discontinuous in  $U_{y}$ and
 $B$, such that
 $U_{yy} = -2 \delta (y-1)$ and
 $B_y = Ri_c \delta (y-1)$, where
 $\delta ()$ is the Dirac delta function and
 $Ri_c = 0.293$, consistent with vTG solutions of §§ 3.1 and 3.2. These profiles are a piecewise approximation to the log-sech velocity and tanh buoyancy profiles of figure 10, with a velocity maximum and a buoyancy interface at the channel centreline. We seek solutions to the TG equations subject to the piecewise profiles with Dirichlet boundary conditions
 $\hat {v} = 0$ at
 $y=0$ and
 $y=2$.
The general solution to (3.6) for the piecewise velocity (3.7) and buoyancy (3.8) profiles is
 \begin{equation} \hat{v} = \begin{cases} A \,{\rm e}^{-\tilde{k}(y-1)} - A\, {\rm e}^{\tilde{k}(y-3)} \quad y \geq 1, \\ A \,{\rm e}^{\tilde{k}(y-1)} - A \,{\rm e}^{-\tilde{k}(y+1)} \quad y \leq 1, \end{cases} \end{equation}
where  $A$ is a constant. The dispersion relation is obtained by substitution of
 $\hat {v}$ into the TG equations (3.6) and integrating over the interface at
 $y=1$, with
 $U_{yy} = -2 \delta (y-1)$ and
 $B_y = Ri_c \delta (y-1)$, derived from (3.7) and (3.8), leading to
 \begin{equation} (c-1)^2 + c_v (c-1) - c_g^2 = 0 , \end{equation}
assuming  $Ri_c \neq 0$. The wave speeds
 $c_v = F/ \tilde {k}$ and
 $c_g^2 = F Ri_c / 2 \tilde {k} \cos ^2 \theta$ represent the solutions obtained if the system were solved for either
 $Ri_c = 0$ or
 $U = 1$, respectively, resulting in a backward-propagating isolated vorticity wave with
 $c - 1 = -c_v$, or two interfacial gravity waves with
 $c-1 = \pm c_g$. Note that only a single vorticity wave is produced when
 $Ri_c = 0$, travelling backwards relative to the background flow. The factor
 $F = (1-{\rm e}^{-2 \tilde {k}})/(1+{\rm e}^{-2 \tilde {k}})$ arises due to the imposed boundary conditions, and is bounded between 0 and 1 for
 $k \in [0,\infty )$, respectively. If the system were instead solved for boundary conditions where
 $\hat {v} \rightarrow 0$ at
 $y \rightarrow \pm \infty$, the dispersion relation would satisfy (3.11) with
 $F=1$; thus the Dirichlet boundary conditions only affect the solution for small
 $\tilde {k}$. This is reasonable given that small instabilities (large
 $\tilde {k}$) are more isolated from the boundaries than larger instabilities (small
 $\tilde {k}$).
Subsequently, the dispersion relation can be obtained, assuming  $Ri_c > 0$:
 \begin{equation} c - 1 = c - U_{max} =- c_v \pm \sqrt{ c_g^2 + c_v^2}. \end{equation}
The wave speed  $c$ is purely real (assuming
 $Ri_c > 0$), such that the system is marginally stable with
 $\omega = k_x \,{\rm Re}(c) = k_x c$ and
 $\sigma = 0$.
The dispersion relation  $\omega (k_x)$ of the piecewise system is visualised in figure 15. Here we report the intrinsic frequency at
 $y=1$,
 $\omega - U_{max} k_x$, as a function of wavenumber magnitude
 $\tilde {k}$, for varying angles of obliquity
 $\theta$ and Richardson numbers
 $Ri_c$. These are compared against the frequencies obtained for isolated vorticity and interfacial gravity waves
 $\omega - U_{max} k_x = - \omega _v$ and
 $\omega - U_{max} k_x = \pm \omega _g$, respectively, where
 $\omega _v = c_v k_x = F \cos \theta$ and
 $\omega _g^2 = c_g^2 k_x^2 = F \tilde {k} Ri_c / 2$. By construction, two modes are present for a given
 $\tilde {k}$: a forward-propagating mode with positive intrinsic frequency and a backward-propagating mode with negative intrinsic frequency. At high
 $\tilde {k}$ both modes tend towards the dispersion relation for interfacial gravity waves,
 $\pm \omega _g$. At low
 $\tilde {k}$ the BW dispersion relation tends towards
 $-\omega _v$, most clear in figure 15(a) at
 $\tan \theta = 0$. The transition of the BW between
 $\omega - U_{max} k_x \approx -\omega _v$ at low
 $\tilde {k}$ and
 $\omega - U_{max} k_x \approx -\omega _g$ at high
 $\tilde {k}$ represents a transition between shear-controlled and buoyancy-controlled flow, which is dependent on
 $\theta$ and
 $Ri_c$; increasing these parameters increases the rate of transition towards buoyancy-dominant flow, both through an increase of
 $c_g^2$ relative to
 $c_v^2$ in the dispersion relation (3.11). The influence of shear on the FW is not so clear but is certainly less than on the BW (see figure 15a with
 $\tan \theta = 0$); at low
 $\tilde {k}$, the discrepancy between the dispersion relation and that of an interfacial gravity wave is larger for the BW than the FW. This asymmetry can be explained by the lack of a FW when the flow is free from a buoyancy interface, where only a backward-propagating isolated vorticity wave is present. In addition, from inspection of the dispersion relation (3.11), one notes that the two contributions of shear (
 $c_v$) have opposite signs when the positive FW root is taken, thus partially cancelling out, unlike the negative BW root. This is complicated by the nonlinearity of the dispersion relation, but is supported by the limiting behaviour observed in figure 15(a). Asymmetry between the BW and FW therefore arises due to the imbalance between shear contributions towards the FW and the BW.
Dispersion relation obtained for the piecewise velocity and buoyancy profiles (3.11) visualised using the intrinsic frequency  $\omega - U_{max} k_x$ as a function of the wavenumber magnitude
 $\tilde {k}$ (solid lines). (a) Dispersion relation for
 $Ri_c = 0.293$ over a range of
 $\tan \theta$; (b) dispersion relation for
 $Ri_c = 1$ over a range of
 $\tan \theta$; (c) dispersion relation for
 $\theta = 0$ over a range of
 $Ri_c$. Dashed lines represent the dispersion relation for isolated vorticity waves,
 $\omega - U_{max} k_x = - c_v k_x$, and dash-dotted lines represent the dispersion relation for interfacial gravity waves,
 $\omega - U_{max} k_x = \pm c_g k_x$.

There are clear similarities between the dispersion relation for the piecewise system and that of the smooth vTG solutions, particularly the log-sech velocity profile and tanh buoyancy profile (figure 11). Both systems lead to two dominant modes with  $\sigma \leq 0$: a forward-propagating wave and a backward-propagating wave, relative to the velocity at the centre of the channel. Buoyancy dominates the dispersion relation of these two modes at high
 $\tilde {k}$, while shear becomes important for small
 $\tilde {k}$. The transition between these two regimes is controlled by
 $Ri_c$ and
 $\theta$. In addition, both systems lead to a clear asymmetry between the two modes at low
 $\tilde {k}$ due to the influence of shear, which dominates the dispersion relation for the BW at low
 $\tilde {k}$. For
 $Ri_c = 0.293$ and
 $\theta = 0$ there is evidence that the BW transitions away from the shear-dominant regime for
 $\tilde {k} \approx O(1)$ (see figures 11 and 15).
However, there is a clear disagreement between the two systems regarding the limiting behaviour of the dispersion relations: the dispersion relation for the piecewise system tends towards that of interfacial gravity waves while the smooth system tends to that of idealised gravity waves in a region of zero shear and constant buoyancy frequency. Nevertheless, the similarities between the two systems regarding the role of shear and buoyancy provides a potential explanation to the importance of shear for the BW and the asymmetry that develops between the two leading-order modes. The piecewise system shows that the BW emerges as a vorticity wave at low  $\tilde {k}$ with only a minor influence from buoyancy, while the FW is dependent on buoyancy to propagate.
However, the linear framework so far has been unable to establish why the BWs dominate spectra in the nonlinear simulations, with energy several orders of magnitude larger than their forward-propagating counterpart. In the following section we revisit the stochastic models developed by Lloyd et al. (Reference Lloyd, Dorrell and Caulfield2022) and demonstrate that it is the nature of the forcing to the linear system that leads to the disparity in energy content between the two waves.
3.4. Stochastically forced simulations
So far, we have demonstrated that both the BW and FW of the nonlinear system are well predicted by linear stability analysis in all but their respective energy content. Here we revisit the stochastically forced 2-D linear framework of Lloyd et al. (Reference Lloyd, Dorrell and Caulfield2022) to investigate the influence of the forcing structure on channel core dynamics. This framework is developed from the perturbation equations (2.7) and (2.8) but approximates inner- and outer-region turbulence using white-noise forcing. With this model, Lloyd et al. (Reference Lloyd, Dorrell and Caulfield2022) were able to predict the BW in excellent agreement with nonlinear simulations, but were unable to explain the weaker mode with positive intrinsic frequency which was seemingly in disagreement with simulation spectra. Now recognising that differences arose due to the neglect of spanwise structure in the interpretation of simulation spectra, it is worth revisiting this body of work since, despite the model neglecting nonlinear terms, it was able to predict the dominance of the BW compared with the weaker mode, which we now recognise as the FW with  $k_z=0$. Despite the two dominant modes arising with similar growth rates in the vTG solutions (or, indeed, with growth rates favouring the FW), the stochastic model of Lloyd et al. (Reference Lloyd, Dorrell and Caulfield2022) was able to predict the dominance of the BW observed in nonlinear simulations. We therefore hypothesise that the dominance of the BW must arise through the forcing conditions of stratified channel flow, but is ultimately still governed by linear processes. In particular, the inner-/outer-layer turbulence perturbs the channel core with ejections of low-momentum fluid into the channel core; such low-momentum fluid preferentially generates BWs, due to its low velocity compared with the faster jet-like core.
To test this hypothesis we repeat the simulations of Lloyd et al. (Reference Lloyd, Dorrell and Caulfield2022) but with forcing applied directly to the channel core, with no external inner/outer forcing. In this way, BW and FW should be generated with approximately equal energy content. For clarity we briefly describe the model here, and refer the reader to Lloyd et al. (Reference Lloyd, Dorrell and Caulfield2022) for further details. We introduce the streamfunction  $\psi ^+$, where
 $(u'')^+ = \partial \psi ^+ / \partial y$ and
 $(v'')^+ = - \partial \psi ^+ / \partial x$. The superscript
 $+$ represents variables scaled by the friction velocity
 $u_\tau$, noting this is a more appropriate scale for the inner- and outer-region turbulence. The difference in spectral energy content between the FW and BW is largest for purely streamwise-propagating flow (
 $k_z=0$); thus we restrict our stochastic formulation to two dimensions. While we have shown that three-dimensionality is critical for a clear interpretation of the dominant modes in the nonlinear simulations, the aim of the section is to test the hypothesis that the spatial location of the stochastic forcing is a key control on the energy content of the two resultant modes, which, as we show, can be convincingly demonstrated using the 2-D model. Rescaling and substituting
 $\psi ^+$ into the perturbation equations (2.7) and (2.8) leads to
 \begin{equation} \frac{\partial{}}{\partial{t^+}}\nabla^2 \psi^++ U^+ \frac{\partial{}}{\partial{x}}\nabla^2 \psi^+- \frac{\text{d}^2 U^+}{\text{d} y^2}\frac{\partial{\psi^+}}{\partial{x}} =- \frac{\partial{b^+}}{\partial{x}} + \frac{1}{Re_\tau} \nabla^4 \psi^++ \mathcal{W}(y) \end{equation}
and
 \begin{equation} \frac{\partial{(b'')^+}}{\partial{t^+}} + U^+ \frac{\partial{(b'')^+}}{\partial{x}} - \frac{\text{d} B^+}{\text{d} y}\frac{\partial{\psi^+}}{\partial{x}} = \frac{1}{Pr \,Re_\tau} \nabla^2 (b'')^+. \end{equation}
Here the buoyancy fluctuations are given by  $(b'')^+ = -Ri_\tau \rho '$ and
 $\mathcal {W}(y)$ represents vertically correlated stochastic forcing to the linear system, approximating nonlinear processes. These simulations use the background flow parameters and profiles of the nonlinear simulations (figure 1), and specify
 \begin{equation} \mathcal{W}(y) = \xi(y) \mathcal{N}(0,1/ \Delta t ), \end{equation}
where  $\mathcal {N}$ represents a normal distribution with a variance scaled by the simulation time step
 $\Delta t$. The function
 $\xi (y)$ defines the vertical structure of
 $\mathcal {W}(y)$. We investigate solutions using two smooth structure functions which respectively force either the inner/outer regions of the flow or the channel core. Following Lloyd et al. (Reference Lloyd, Dorrell and Caulfield2022), the first function, termed ‘outer forced’, is given by
 $\xi _o(y) = \nu _t / \max (\nu _t)$, where
 $\nu _t = - \overline {u'v'}/\bar {u}_y$. The second function, termed ‘core forced’, is taken as
 \begin{equation} \xi_c(y) = \tfrac{1}{2} \tanh(100(y-0.98)) - \tfrac{1}{2} \tanh(100(y-1.02)), \end{equation}
such that forcing is applied only to a narrow region in the core of the channel. Subscripts  $o$ and
 $c$ refer to either ‘outer’ or ‘core’ forcing. The ‘outer’ forcing is designed to approximate the perturbations felt in the nonlinear simulations due to outer-region turbulence, while the ‘core’ forcing is a hypothetical alternative where perturbations are generated at the region of maximum velocity, or the centre of the BW and FW eigenfunctions.
The system of equations is discretised and solved using Dedalus (Burns et al. Reference Burns, Vasil, Oishi, Lecoanet and Brown2020). Equations are solved on a 2-D domain of size  $L_x \times L_y = 8 {\rm \pi}\times 2$, discretised using a Fourier basis in the periodic (
 $x$) direction and a Chebyshev basis in the vertical (
 $y$) direction, dealiased using the
 $3/2$ rule. The grid resolution is set to
 $N_x \times N_y = 512 \times 256$ approximately equal to the grid resolution of the nonlinear simulations (§ 2.1). At each time step the stochastic forcing is generated on a grid half this size:
 $\mathcal {W}(y)$ is calculated from the normal distribution
 $\mathcal {N}$ at each grid point of the coarse grid before up-sampling to the correct resolution. The initial-value problem, initially at rest, is integrated in time using a first-order Runge–Kutta scheme for a total simulation time of
 $T^+=100$, where the flow reaches a pseudo-steady state at
 $T^+ \approx 20$.
Snapshots of instantaneous data from the stochastically forced simulations are presented in figure 16. Under ‘outer’ forcing conditions, there is a clear dominant streamwise wavenumber in the core of the channel, corresponding to the BW. In contrast, ‘core’ forcing leads to a clear presence of multiple streamwise wavenumbers with different vertical extent. The lower magnitude of modes in the ‘core’ forced simulations can be explained by the lower energy input of  $\mathcal {W}(y)$, which acts only in a narrow region in the channel core. Despite this, there is a clear signal from multiple modes for the ‘core’ forced simulation.
Snapshots of instantaneous data from the stochastically forced simulations. (a,c,e) ‘Outer’ forced simulations. (b,d,f) ‘Core’ forced data. (a,b) Vertical velocity perturbations, (c,d) buoyancy perturbations and (e,f) white noise forcing functions, scaled by the simulation time step.

The 2-D energy spectra for the buoyancy fluctuations are presented in figure 17 showing clear agreement with vTG solutions and nonlinear simulation spectra (figures 2a and 3a). Consistent with nonlinear simulations (figure 3) and the stochastic model of Lloyd et al. (Reference Lloyd, Dorrell and Caulfield2022), ‘outer’ forcing leads to a dominant BW with an energy several orders of magnitude higher than that of the FW. By forcing the system directly at the channel core, we find that both the BW and the FW are strongly present in the spectra. Further, while both modes are clearly present and near equal in order of magnitude, the FW has a higher energy content than the BW, in agreement with the vTG solutions which show a marginally lower growth rate for the BW across most  $\tilde {k}$ (figure 4).
Dispersion relation for the stochastically forced linear simulations, visualised with the 2-D buoyancy perturbation energy spectra  $E_{bb}^{2D}$. (a) ‘Outer’ forced simulation data. (b) ‘Core’ forced simulation data. Lines are as per figure 2(a), with dash-dotted lines representing vTG solutions of § 3.1.

These simulations therefore demonstrate that the dominance of the BWs in the core of stratified channel flow can potentially be explained by the low momentum of outer-region activity, relative to the high momentum of the channel core. If instead perturbations were centred at the region of highest velocity, both sets of waves would be approximately equal in energy content.
4. Discussion
Coherent structures in stably stratified shear flows have long been a focus of extensive research due to their importance in scalar and energy transport dynamics (Baines Reference Baines1998; Garaud Reference Garaud2018; Caulfield Reference Caulfield2021; Wells & Dorrell Reference Wells and Dorrell2021). This work is focused on understanding the coherent waves generated in the core of stratified channel flow, where a jet-like velocity profile intersects a region of strong buoyancy gradient. Such shear and buoyancy profiles occur in natural systems such as oceanic jets and gravity currents (Dorrell et al. Reference Dorrell, Peakall, Darby, Parsons, Johnson, Sumner, Wynn, Özsoy and Tezcan2019), critical for global climate regulation, heat and nutrient transport and supporting ecosystems (Baines Reference Baines1998; Simpson Reference Simpson1999; Talling et al. Reference Talling, Masson, Sumner and Malgesini2012; Azpiroz-Zabala et al. Reference Azpiroz-Zabala, Cartigny, Talling, Parsons, Sumner, Clare, Simmons, Cooper and Pope2017).
Our study primarily adopts linearised frameworks to analyse stratified channel flow of high Reynolds ( $Re_\tau = 550$) and Richardson (
 $Ri_\tau = 480$) numbers, using the inviscid TG and vTG equations, and a stochastically forced linear model developed by Lloyd et al. (Reference Lloyd, Dorrell and Caulfield2022). These are compared against nonlinear simulations which capture the 3-D energy spectra
 $E(k_x, k_z, \omega )$ at the channel centreline
 $y=1$, such that the dispersion relation of the dominant modes can be calculated. Crucially we show that oblique waves are prolific in the core of the channel; spanwise averaging of such coherent spanwise structures leads to significant smearing and distortion of the dominant mode dispersion relations. This is particularly clear for the FWs where their energy content is approximately constant over a wide range of
 $\theta$, the angle of obliquity. Backward-travelling waves are affected less by such averaging due to their strong presence in spectra at
 $\theta = 0$, and their decay in energy at high
 $\theta$. When three-dimensionality is taken into account, the linear models are able to accurately capture channel core dynamics, particularly the BW and FW dispersion relations which are strongly affected by
 $\theta$ and
 $\tilde {k}$.
We find that at high wavenumber magnitude  $\tilde {k}$ both sets of waves tend towards the idealised dispersion relation for internal waves in a shear-free and constant-buoyancy-gradient flow:
 $\omega = U_{max} k_x \pm N_{max}$. This limiting behaviour appears to arise due to the changing balance between shear and buoyancy forces in the equations governing wave dynamics. Both numerical solutions to idealised continuous profiles and analytical inviscid solutions to piecewise approximations of the flow show that at low and order-one
 $\tilde {k}$ shear is crucial for the propagation of these waves. In particular, shear dominates the dynamics of the BW with a negligible contribution from buoyancy forces. As
 $\tilde {k}$ increases, shear becomes less important while buoyancy begins to dominate the balance. In addition, as
 $\tilde {k}$ increases modes become spatially narrower, and confined to a thinner region around
 $y=1$. When the vertical scale of modes is sufficiently small compared with the buoyancy interface thickness, the buoyancy gradient appears locally constant. The limiting behaviour,
 $\omega = U_{max} k_x \pm N_{max}$, is therefore explained by the low contribution of shear at high
 $\tilde {k}$ and that the buoyancy gradient varies sufficiently slowly compared with the vertical extent of the modes. While the piecewise analytical model is able to correctly predict the two pairs of waves, their marginal stability and their dependence on shear and buoyancy, it is unable to predict this limiting behaviour due to the discontinuous buoyancy interface and resultant interfacial waves.
Through exploration of vTG solutions based on idealised background flow profiles, we have found that channel core dynamics can be qualitatively reproduced by a velocity profile with a velocity maximum and a corresponding negative  $U_{yy}$, intersecting a region of strong buoyancy gradient. More complex shear profiles that include the positive maxima in
 $U_{yy}$ at the core edge (figure 1) have some influence on the dispersion relation of the BW at low
 $\tilde {k}$, but are not required to qualitatively reproduce the channel core dynamics of nonlinear simulations. Analysis of the two dominant modes, using both vTG and TG formulations, reveals that the BW exists even in the absence of buoyancy, as a result of the velocity maximum and corresponding negative
 $U_{yy}$ in the core. Of course, strong buoyancy gradients are required to produce such a quiescent channel core where the BW can freely propagate, but given the mode arises primarily through shear, particularly for
 $\tilde {k} \lesssim O(1)$ where the BW dominates, it is perhaps more suitable to refer to the mode as a vorticity–gravity wave, as opposed to an internal wave.
A key result from this analysis is that BWs and FWs emerge in the linear stability analysis as stable or marginally stable modes, following a distinct dispersion relation. One may therefore expect such structures to decay in stratified plane Poiseuille flow, yet a highly energetic wave field is produced due to the continuous turbulent activity in the outer regions of the flow perturbing the edge of the channel core. Local intermittency in the wave field occurs during periods of particularly enhanced turbulent activity, potentially driven by coupled interactions between hairpin vortices and channel core waves (Lloyd et al. Reference Lloyd, Dorrell and Caulfield2022). In this work we have provided a potential explanation for the dominance of the BWs in the core: the system is excited by crucially low-momentum activity from the outer regions of the flow, which preferentially generates BWs over FWs, despite both linear modes arising with similar growth rates. Backward-travelling waves should therefore dominate the core of ‘jet-like’ natural stratified flows if the density gradient is perturbed externally rather than internally.
A key question that is critical to understanding stratified channel flow is the role of the dimensionless parameters  $Ri_c$,
 $Pr$ and
 $Re_c$. For the idealised continuous and piecewise systems of §§ 3.2 and 3.3 the qualitative behaviour does not change under varying flow parameters. We have shown that varying the width of the buoyancy interface leads to qualitatively the same dispersion relation with the same limiting behaviour. We expect the same to be true for the shear profile, although note that a length scale based on these interface widths would be more appropriate for scaling the problem than the channel half-height. We have found that the dispersion relation is highly dependent on the buoyancy gradient, with instabilities present for low
 $Ri_c$ for the planar-averaged simulation profiles. However, this analysis has been conducted with fixed background flow profiles. Further studies are needed to quantify the influence of flow parameters over a wider phase space, building on the work of Garcia-Villalba & Del Alamo (Reference Garcia-Villalba and Del Alamo2011), to understand their influence on channel core dynamics.
Acknowledgements
We acknowledge the Viper High Performance Computing facility of the University of Hull and its support team. We are grateful to our three anonymous referees for their constructive examinations, and to C.-c. Caulfield and A. Doak for their insightful discussions during this study.
Funding
C.J.L. was supported by an Early Career Fellowship funded by the Leverhulme Trust. R.M.D. would like to acknowledge funding support from NERC Independent Research Fellow Grant NE/S014535/1.
Declaration of interests
The authors report no conflict of interest.


 Open access

