Implications
Currently, it seems to be crucial to extend our present knowledge on the protein composition of body fluids including blood plasma in horses. Especially the possibility of analysis of low-abundant proteins which are often tissue-specific proteins may help to discover a new biomarkers valid in veterinary medicine or sport horse training.
Introduction
In general, serum/plasma proteome analysis have been mainly performed in humans; however, currently we can observe a growing interest in these types of analysis in farm animals as well. Farm animal proteomics is an important step towards more detailed understanding of the physiological and pathological mechanisms of complex biological systems, organs or tissues. Up to date, most of the proteomic studies have mainly focussed on two groups of farm animals, that is swine and cattle and very little attention has been devoted so far to horses (Bendixen et al., Reference Bendixen, Danielsen, Hollung, Gianazza and Miller2011). Previous studies on horse proteome analysis were aimed at assessing the effectiveness of training intensity (Scoppetta et al., Reference Scoppetta, Tartagila, Renzone, Avellini, Gaiti, Scaloni and Chiaradia2012), establishing new biomarkers of locomotor disorders: osteoarthritis, osteochondrosis (Chiaradia et al., Reference Chiaradia, Pepe, Tartaglia, Scoppetta, D’Ambrosio, Renzone, Avellini, Moriconi, Gaiti, Bertuglia, Beccati and Scaloni2012) and laminitis (Steelman and Chowdhary, Reference Steelman and Chowdhary2012). It is also noteworthy that horses are becoming increasingly important as a model organism for proteomic analysis in the development and treatment of human disorders, such as human autoimmune uveitis (Zipplies et al., Reference Zipplies, Hauck, Schoeffmann, Amann, Stangassinger, Ueffing and Deeg2009 and Reference Zipplies, Hauck, Schoeffmann, Amann, van der Meijden, Stangassinger, Ueffing and Deeg2010). Most of the proteomic studies performed to date have involved biological fluids, mainly blood plasma and serum (di Girolamo et al., Reference Di Girolamo, D’Amato, Lante, Signore, Muraca and Putignani2014). This is mainly due to the fact that blood can be collected without any interventional procedures, and most importantly this body fluid is a main source of potential biomarkers. The simplicity of collection and relatively high-protein concentration in this body fluid are the most probable reasons that blood plasma and serum are most frequently used for the discovery of novel biomarkers (Beck et al., Reference Beck, Overgaard and Rasmussen2015). Except for the typical blood plasma/serum proteins comprising the main pool of these body fluid proteomes, proteins secreted by different cells are the most promising group of potential biomarkers, as they reflect various states of the cells in real time and at given conditions (Stastna and van Eyk, Reference Stastna and Van Eyk2012). Plasma and serum proteomic analyses are markedly limited by the spectacular dynamic range of protein concentrations, which ranges up to 12 orders of magnitude (Anderson and Anderson, Reference Anderson and Anderson2002). According to Tirumalai et al. (Reference Tirumalai, Chan, Prieto, Issaq, Conrads and Veenstra2003), the albumin and nine other most abundant proteins namely: fibrinogen, IgG, IgA, IgM, alfa1-antytrypsine, transferrin, alfa-2 macroglobulin, haptoglobine and complement C3 constitute ~90% of the total blood plasma protein content and the remaining 10% consists of mid- and low-abundant proteins valuable as perspective future biomarkers. To enable the in-depth proteomic analysis of these biological fluids, several strategies have been developed to reduce the range of protein concentrations. Nevertheless, tools for the specific depletion of highly abundant serum proteins are not available for most of the farm animals (Henning et al., Reference Henning, Albrecht, Riedel, Mettenleiter and Karger2015; Gianazza et al., Reference Gianazza, Miller, Palazzolo, Parravicini and Eberini2016). To date, only two proteome maps of horse serum proteome have been established (Miller et al., Reference Miller, Friendlein, Tsangaris, Maris, Fountoulakis and Gemeiner2004; Zipplies et al., Reference Zipplies, Hauck, Schoeffmann, Amann, van der Meijden, Stangassinger, Ueffing and Deeg2010). Nevertheless, the authors of both studies did not use any tools to decrease the high-abundant protein content. Hexapeptide ligand libraries provide new opportunities to reduce blood plasma/serum dynamic range. These libraries are based on solid phase extraction enabling selective enrichment and concentration of proteins. This approach depends on protein binding to its specific ligand. When a ligand reaches a maximum binding capacity, proteins that exceed the capacity of the beads are removed from the sample. Providing that a high number of ligands is used in one analysis, all of them will independently bind specific proteins until they reach its maximum capacity (Guerrier et al., Reference Guerrier, Righetti and Boschetti2008). Miller et al. (Reference Miller, Friendlein, Tsangaris, Maris, Fountoulakis and Gemeiner2004), in the concluding remarks of their study aimed at horse serum proteome profiling, stated that the prefractionation of serum is necessary to better resolve low-abundance proteins, for example complement factors and ceruloplasmin, which may help to discover new biomarkers. According to the above-mentioned facts, a comprehensive characterisation of blood plasma proteome in horses, including medium- and low-abundant protein enrichment as well as analysis and identification, seem to be crucial for further proteomic analysis and future biomarker discovery in this animal species.
Material and methods
Animals
The study was performed on three healthy part-Arabian mares. Blood samples were taken from jugular vein during clinical routine health checks of animals. At the day of blood collection animals did not show any clinical signs of illness. Blood plasma samples were obtained by centrifugation (1500 g; 15 min, 4°C) and was stored at −80°C until analyses. The experimental procedures were approved by the Local Commission of Ethics for the Care and Use of Laboratory Animals in Poland (No.13/2015; 14/2015 of 15.05.2015).
Sample preparation
Before analysis, plasma samples were thawed at 0°C and subsequently divided on two differentially processed parts. First group of samples was left native and the other group of samples were processed with the ProteoMiner Protein Enrichment Large-Capacity Kit (Bio-Rad, Hercules, California, USA) according to manufacturer manual to increase the low- and medium-abundance protein concentration. Both treated and not treated samples were then precipitated with cold acetone at −20°C for 2 h. After the incubation samples were centrifuged (20 000 g; 4°C, 40 min) and resulting protein pellets were dissolved in the lysis buffer (7 M urea, 2 M thiourea, 4% w/v CHAPS, 0.2% w/v 3 to 10 carrier ampholytes, 100 mM - 1,4-Dithiothreitol).
One-dimensional electrophoresis
Samples containing 20 µg of plasma protein were mixed in a 1 : 5 ratio with the Laemmli buffer containing: 30% v/v 0.5 M Tris (pH 6.8), 10% w/v SDS, 50% v/v glycerol, 20% v/v β-mercaptoethanol and a trace of bromophenol blue. Then, samples were incubated at 60°C for 15 minutes and run in 12% polyacrylamide gels at 40 V for 20 min and subsequently at 100 V for 90 min. The gels were stained with colloidal Coomassie Brilliant Blue (CBB) G250 as previously described by Pink et al. (Reference Pink, Verma, Rettenmeier and Schmitz-Spanke2010).
Two-dimensional electrophoresis
Isoelectric focussing of plasma proteins (280 µg) in two technical replicates for each sample was performed after combined rehydratation (6 h, 20°C – passive; 50 V, 12 h, 20°C – active) on 4 to 7 nonlinear 11 cm length ReadyStrip IPG strips (Bio-Rad) in total of 35 kVh using Protean i12® IEF Cell (Bio-Rad). The IPG strips were equilibrated for 15 min in buffer containing: 6 M urea, 0.5 M Tris/HCl, pH 6.8, 2% w/v SDS, 30% w/v glycerol with 1% DTT addition. After that, strips were washed for 20 min in the same base buffer containing 2.5% iodoacetamide. Electrophoresis was performed at 40 V for 2.5 h and subsequently at 100 V for 16 h (10°C) with 12% polyacrylamide gels in Tris-glycine buffer (25 mM Tris–HCl, 192 mM glycine, 0.1% SDS) using a Protean PlusTM Dodeca CellTM electrophoretic chamber (Bio-Rad). After two-dimensional electrophoresis (2-DE) separation, protein spots were detected with CBB G-250 according to Pink et al. (Reference Pink, Verma, Rettenmeier and Schmitz-Spanke2010).
Image analysis
Gel image digitalisation was performed using GS-800TM Calibrated Densitometer (Bio-Rad). PDQuest Advanced Analysis Software 8.0.1 advanced (Bio-Rad) was processing and both the quantitative and qualitative analysis of the two-dimensional (2-D gel) images. The basic gels processing included: gel cropping and rotation. Experiment normalisation was performed using a local regression model. To measure the intragroup variability coefficients of variation (CV) was calculated. The isoelectric point (pI) and molecular weight (Mw) was calculated for each identified protein spot using integrated with software tool. The experimental molecular masses of identified protein spots were calculated using Precision Plus ProteinTM KaleidoscopeTM Standard for SDS-PAGE (Bio-Rad) as a reference.
Mass spectrometry
After manual excision of all visible protein spots from the 2-D gels their identification was performed using matrix-assisted laser desorption/ionisation – time of flight (MALDI-TOF) Mass Spectrometer (Microflex; Bruker Daltonics, Bremen, Germany) as previously described by Ozgo et al. (Reference Ozgo, Lepczyński and Herosimczyk2015).
Spots distribution analysis
Calculated and theoretical pIs and MWs for each identified protein spot were compared. Linear regression was calculated for pIs and power regression for protein Mws, calibration for both was obtained using proteins coordinates that showed minimal deviation between their theoretical and experimental pI (0.2 pH) and Mw (5 kDa) as described by Rogowska-Wrzesinska et al. (Reference Rogowska-Wrzesinska, Bihan, Thaysen-Andersen and Roepstorffm2013). Results were plotted and outlier spots were marked up.
Gene ontology analysis
The identified proteins were classified according to the subcellular localisation on the basis of Uniprot Knowledgebase (UniProtKB; http://www.uniprot.org). Gene ontology (GO) analysis were performed for Equus caballus-specific gene products using STRING v.10 bioinformatics software (Szklarczyk et al., Reference Szklarczyk, Franceschini, Wyder, Forslund, Heller, Huerta-Cepas, Simonovic, Roth, Santos, Tsafou, Kuhn, Bork, Jensen and von Mering2015). Above analysis allowed us to categorise the identified gene products according to their presence in classified metabolic pathways stored in KEGG Pathway Database (Kanehisa et al., Reference Kanehisa, Sato, Kawashima, Furumichi and Tanabe2016) available at http://www.genome.jp/kegg/pathway.html.
Results
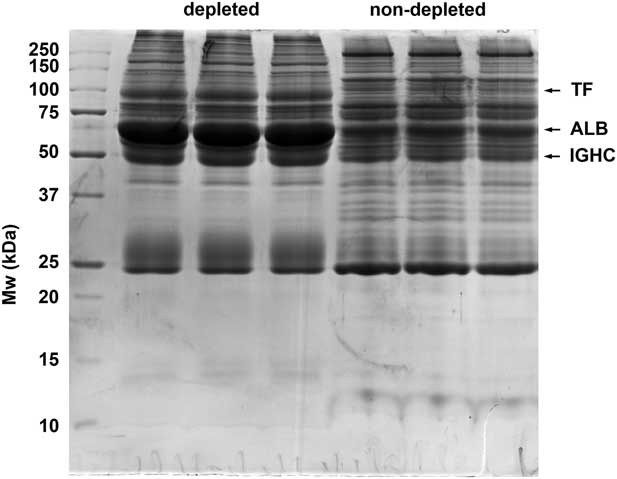
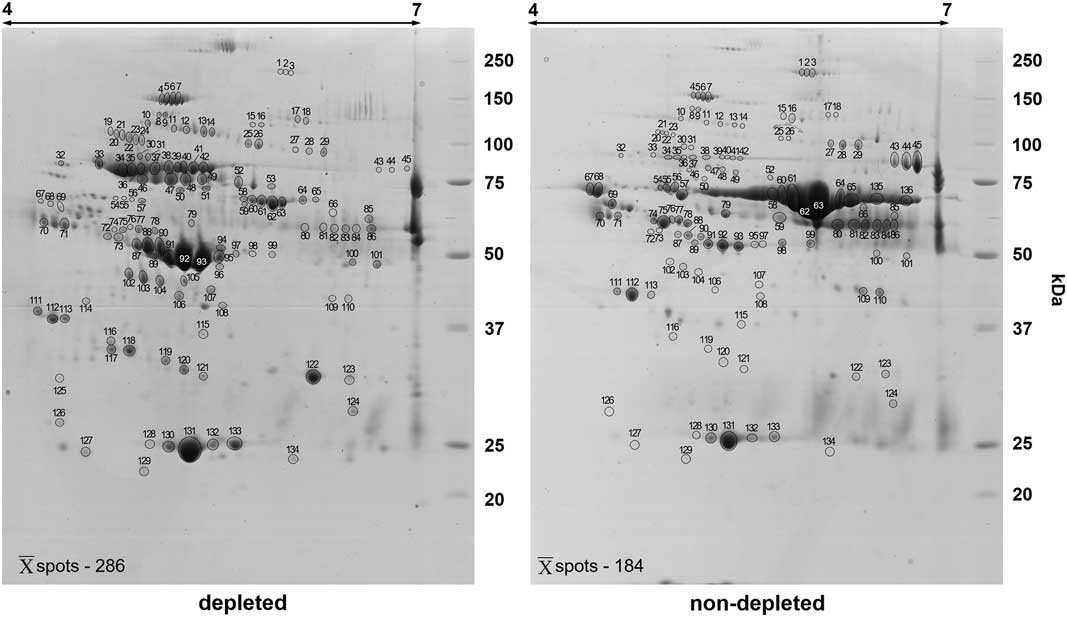
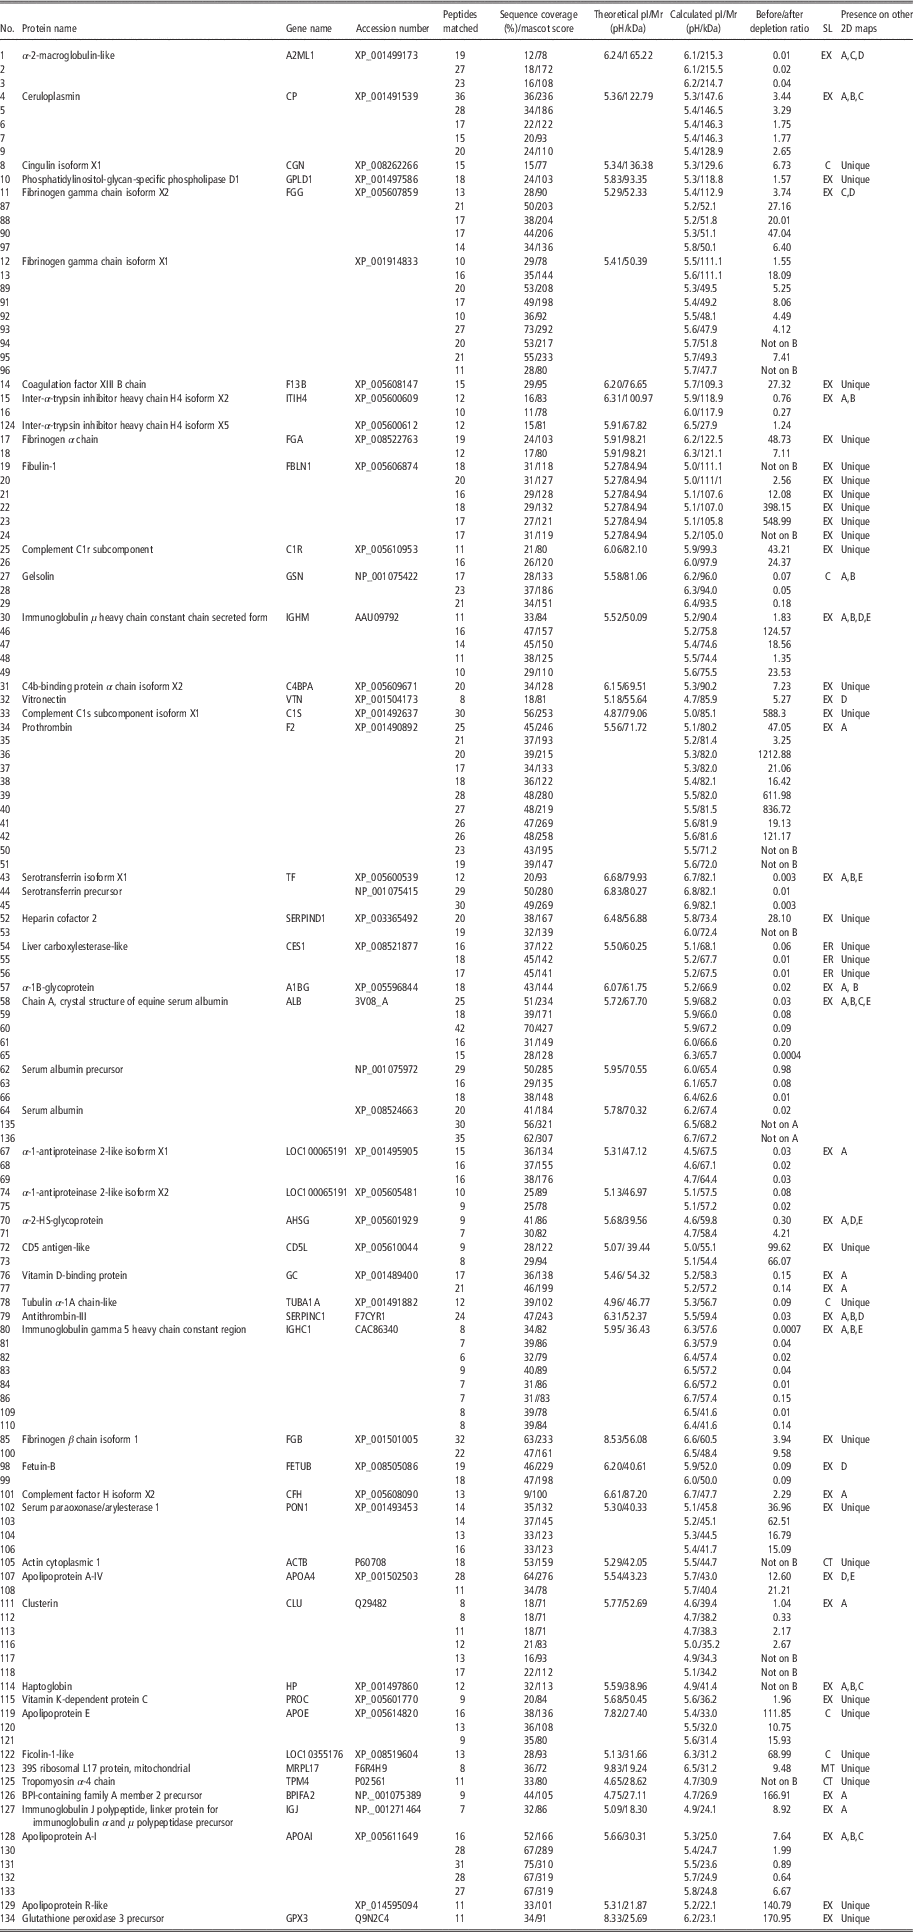
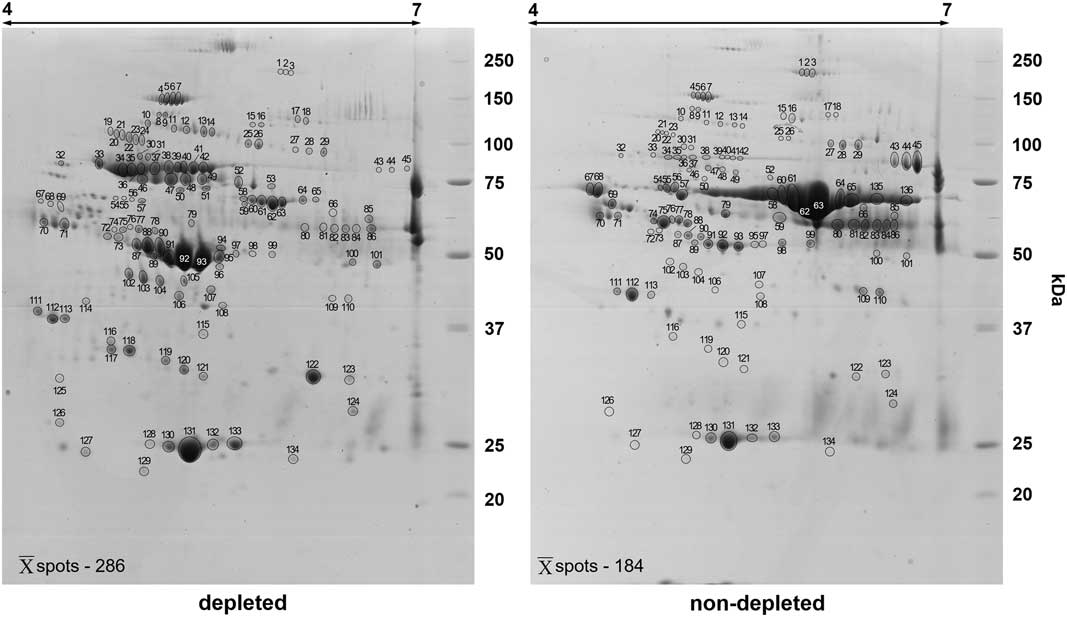
The main objectives of our study were: (1) to assess the effectiveness of the high-abundant protein depletion to optimise the 2-DE analysis and improve the concentration of medium- and low-abundant proteins, and (2) to deeply analyse the serum protein composition of E. caballus. To achieve the first goal, 1-DE and 2-DE protein separation coupled with MALDI-TOF MS analysis were performed. Intersample variation was calculated to confirm the pattern of reproducibility. The analysis showed an average CV of 51.34% in the treated samples and 58.16% for the non-treated group. The results of 1-DE and 2-DE of horse plasma, before and after low-abundant protein enrichment, are shown in Figures 1 and 2, respectively. In case of 1-DE gels, the highest depletion efficiency was observed for albumin, IgG heavy chain and serotransferrin; those effects are presented in Figure 1. Detailed identification data are available in Supplementary Table S1. The raw gel including the depleted protein fraction is presented in Supplementary Figure S1. 2-D gels representing horse plasma, before high-abundance protein depletion, resolved on average 184 protein spots. Enrichment of low- and medium-abundant proteins resulted in the average detection of 286 protein spots in 2-D gels, increasing spot detection by 55.43% (Figure 2). Of all excised protein spots from 2-D gels, representing depleted and non-depleted plasma protein samples, 136 different protein spots representing 46 different gene products have been successfully identified (Table 1). Among them, 124 were present on the 2-D map representing the non-depleted plasma sample, and 134 were detected on the proteome map of the depleted blood plasma. The depletion/enrichment ratio for each analysed spot was also calculated (Table 1). The highest depletion was observed for the most abundant plasma proteins, namely: albumin, IgG heavy chains 5 constant region and serotransferrin. Similarly, the highest enrichment values were observed for spots representing prothrombin, fibulin-1 and complement C1s subcomponent.
1-DE protein profiles of depleted and not depleted horse blood plasma samples.

A representative two-dimensional profiles of Coomassie-stained horse plasma proteins before and after the depletion of a high abundant proteins. Proteins (280 µg) were separated in 4 to 7 pH gradient for the first dimension followed by 12% SDS-PAGE. Spot numbers correspond to those in Table 1. The unprocessed gels are available to analyse in Supplementary Figure S2.
Summary of the identification of proteins using matrix-assisted laser desorption/ionisation – time of flight mass spectrometry

SL=subcellular localisation; EX=extracellular; ER=endoplasmic reticulum; C=cytoplasm; CT=cytoskeleton; MT=mitochondrion.
Spot number indicates the number labelling the spots in Figure 2. For each protein spot: accession number, protein name and gene name are shown as in Uniprot/NCBI database. The predicted and estimated pI/Mr, the percentage of the sequence coverage, the Mascot score, the number of peptides matched per protein, the ratio for particular spot depletion/enrichment are given. Capital letters from A to E correspond respectively to the presence of identified proteins on two-dimensional maps of blood plasma/serum performed by other authors Zipplies et al. (2010), Miller et al. (2004), Scoppetta et al. (2012), Steelman and Chowdhary (2012), Zipplies et al. (2009).
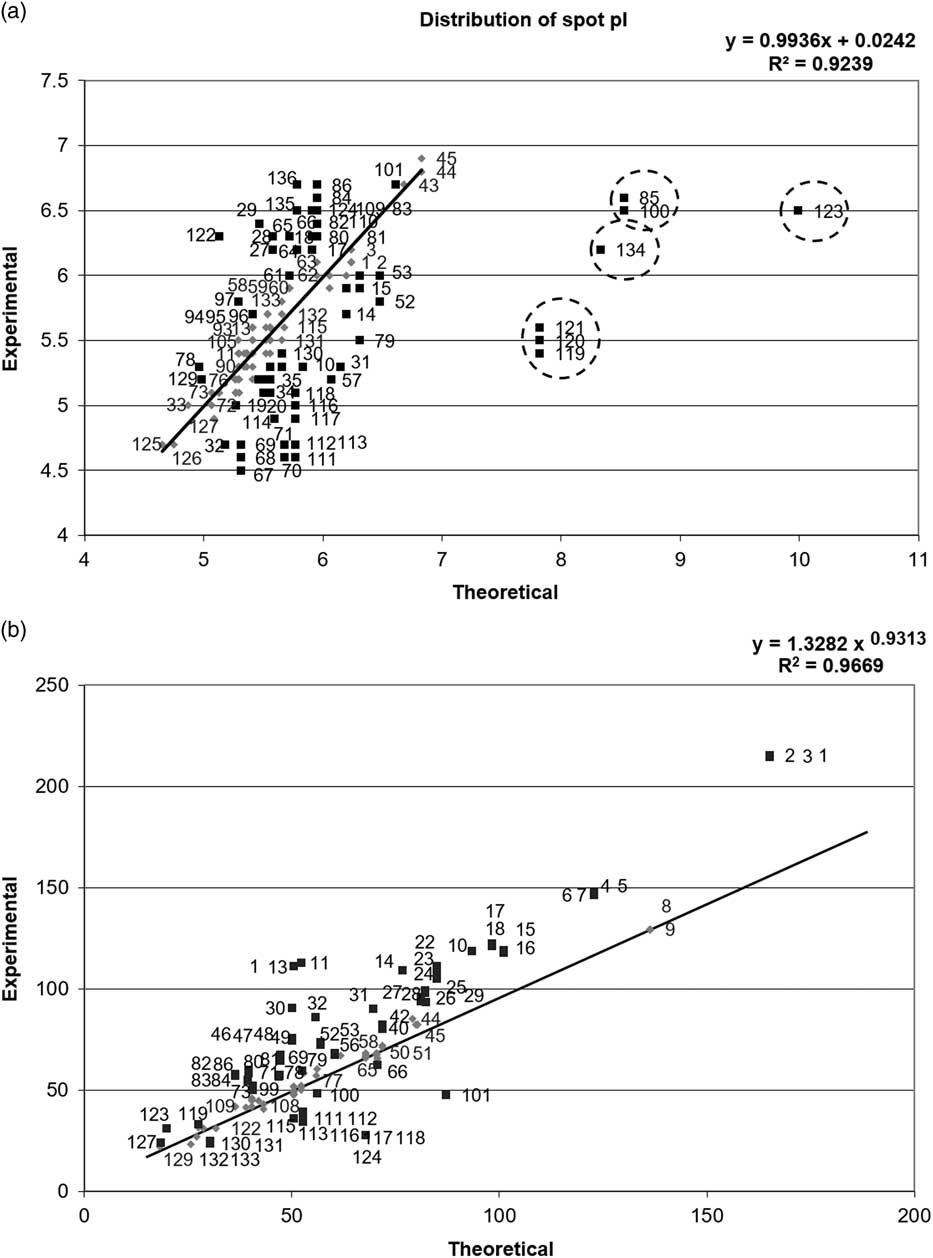
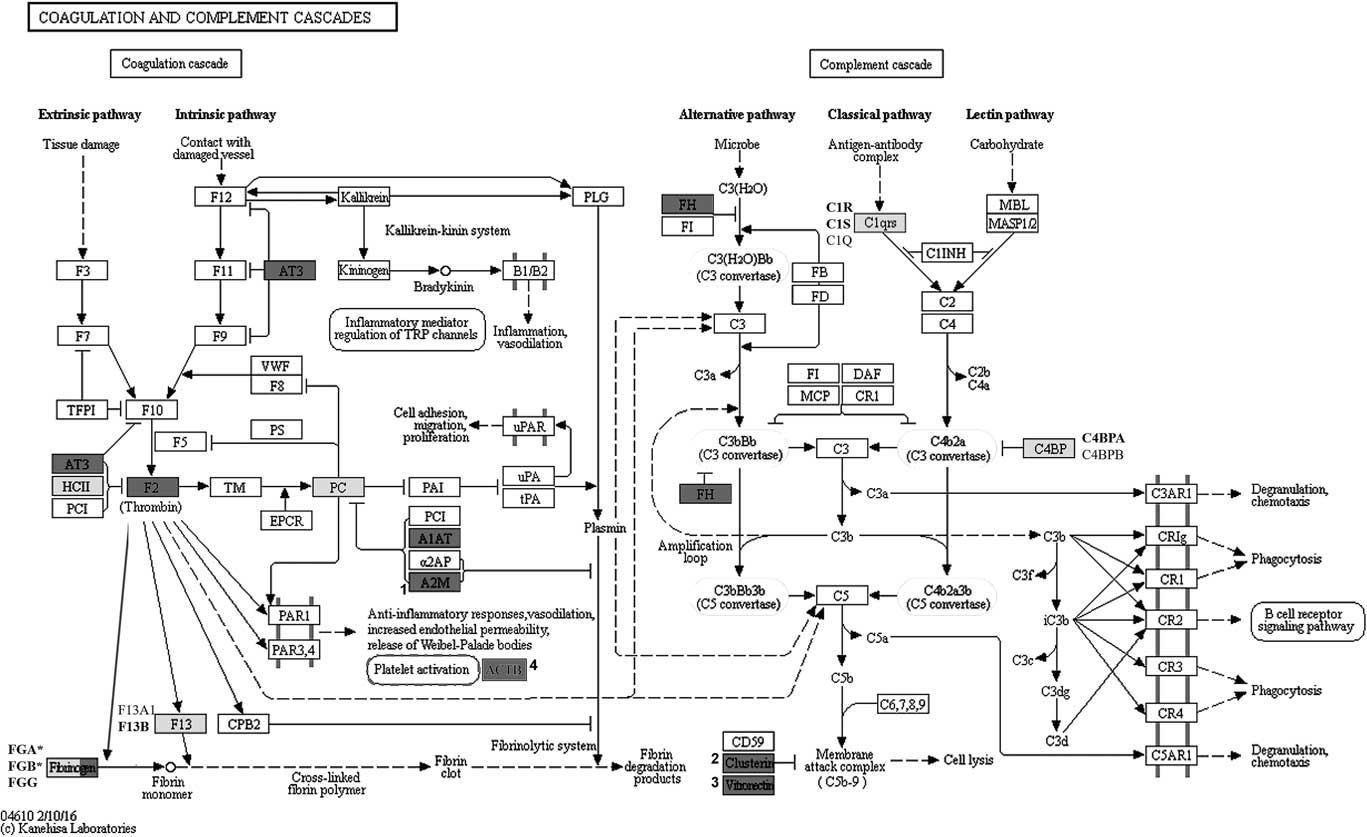
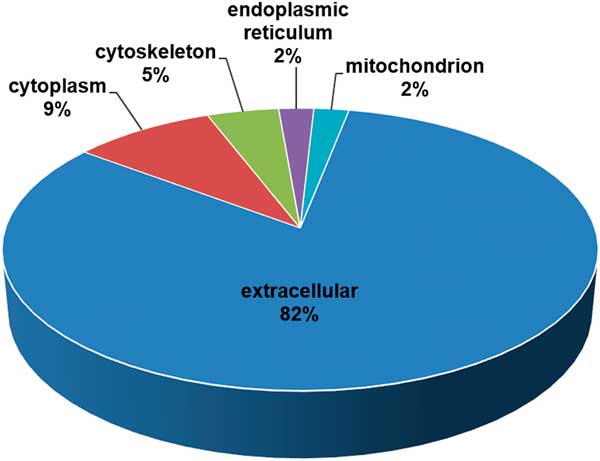
As previously mentioned, the present study identified a total of 136 protein spots, representing 46 different gene products, separated in the 4 to 7 pH range, and a molecular mass between 20 and 250 kDa. Each identified protein spot was species-specific for E. caballus. The experimental Mw and pI values were computed for all identified spots using PDQuest 8.01 advanced software and compared with the gene-deduced Mw/pI coordinates available in the databases such as Uniprot or NCBI (Table 1). To organise the spots distribution pattern, all coordinates were plotted after calibration of Mw and pI scales using protein spots that showed minimal deviation between their theoretical and experimental pI/Mw values. The majority of the computed and theoretical pI/Mw values matched with a minimal variation. Nevertheless, among 136 identified protein spots, seven were classified as pI outliers (Figure 3). Gene ontology analysis of the identified gene products using STRING software demonstrated that 14 of the identified gene products belonged to the complement and coagulation cascades (4.22e-20), according to the KEGG database. In addition, after careful analysis of both cascades, α-2-macroblobulin-like, vitronectin and clusterin seemed to fit into that pathway (Figure 4). Another significantly represented pathway was the platelet activation cascade (1.24e-2) with four identified gene products, namely fibrinogen α, β and gamma chains and actin cytoplasmic 1. In addition, the identified gene products were grouped accordingly to their subcellular localisation (Figure 5; Table 1). The highest number of the identified gene products was classified as extracellular proteins, whereas the smallest number of gene products was assigned to the endoplasmic reticulum and mitochondrion.
Comparison of experimentally determined and theoretical pI (a) and Mw (b) values of the identified protein spots from the horse plasma two-dimensional protein maps. Spots used for the curve preparation and other plotted spots are marked with grey rhombs and black squares, respectively. Spots found as an outliers are circled with dashed line.

The scheme presents a KEGG coagulation and complement pathways (04610) specific for Equus caballus. Gene products identified in the present study are marked with dark-grey and pale-grey colours. Dark-grey colour highlight these gene products that were found both in our paper and in other studies aimed at blood plasma/serum proteome profiling in horses. With pale-grey colour are marked these gene products that have not been previously identified (unique) in horse serum/plasma samples using proteomic tools. In case of proteins comprise a few subunits gene products identified in present study are bolded. Fibrinogen chains marked with * refers to the gene products that have not been previously reported by the other authors. Numbers 1 to 3 correspond to the proteins that are the part of the pathway but have not been linked with it by the STRING bioinformatics tool. Number 4 refers to the actin cytoplasmic 1, which is a part of platelet activation pathway.

Diagram presenting the percentage of the identified on two-dimensional maps of horse plasma gene products distribution according to their subcellular localisation.

Discussion
Thus far, two proteome maps of horse blood serum have been established (Miller et al., Reference Miller, Friendlein, Tsangaris, Maris, Fountoulakis and Gemeiner2004; Zipplies et al., Reference Zipplies, Hauck, Schoeffmann, Amann, van der Meijden, Stangassinger, Ueffing and Deeg2010). The separation of serum proteins in both cases was performed without the enrichment of the medium- and low-abundant protein fraction, thereby allowing the authors to separate only a limited number of protein spots. Therefore, in the present study, we decided to investigate the usefulness of the hexapeptide-based technology (ProteoMiner; Bio-Rad) for the depletion of high-abundant proteins from horse blood plasma. As a result, we obtained a 2-D map of this body fluid with a 55.43% higher number of detected protein spots when compared with the map of untreated blood plasma proteome (Miller et al., Reference Miller, Friendlein, Tsangaris, Maris, Fountoulakis and Gemeiner2004; Zipplies et al., Reference Zipplies, Hauck, Schoeffmann, Amann, van der Meijden, Stangassinger, Ueffing and Deeg2010). The highest depletion efficiency was observed for the two most abundant plasma proteins, that is albumin and IgG. Most of the commercially available plasma protein depletion tools are based on the immunodepletion of these two aforementioned proteins and are optimised to remove human/rat proteins. Considering this fact, their effectiveness in horses is limited and requires a combination of several methods to obtain satisfactory results (Olver et al., Reference Olver, Webb, Long, Scherman and Prenni2010). The immunodepletion based on avian IgY was performed by Zipplies et al. (Reference Zipplies, Hauck, Schoeffmann, Amann, van der Meijden, Stangassinger, Ueffing and Deeg2010) for the reduction of high-abundant proteins concentration on 2-D maps of serum, but the authors have not compared the depleted and non-depleted samples. Nevertheless, in the study of Olver et al. (Reference Olver, Webb, Long, Scherman and Prenni2010) the effectiveness of depletion of the same commercially available kit and observed 90% albumin depletion efficiency, but the column did not remove any IgG. In addition, the authors have emphasised that mentioned technique requires HPLC equipment and is expensive. Until now, the analyses of the efficiency of the high-abundant protein depletion and low-abundant protein enrichment using hexapeptide library techniques have not been performed in horses. Nevertheless, its high efficiency in other farm animals has been previously confirmed in many studies (Marco-Ramell and Bassols, Reference Marco-Ramell and Bassols2010; Rasaputra et al., Reference Rasaputra, Liyanage, Lay, Erf, Okimato and Rash2012; Lepczyński et al., Reference Lepczyński, Dratwa-Chałupnik, Herosimczyk, Staszak, Majewska and Ożgo2014). The results of these studies indicated a 60% increase in spot detection after the treatment. In the current study, the highest enrichment values observed after ProteoMiner treatment were recorded for spots representing prothrombin, fibulin-1 and complement component C1s. According to the Protein Abundance Database (PaxDB4), these proteins are in the group of 5% of the most abundant proteins in human plasma and are ranked in the: 69th (prothrombin), 96th (Fibulin-1) and 127th (complement C1s) position out of 4492 proteins that can possibly be found in human plasma (Wang et al., Reference Wang, Weiss, Simonovic, Haertinger, Schrimpf, Hengartner and von Mering2012).
The implementation of 2-DE and MALDI-TOF MS allowed us to establish a horse plasma proteome map. Of 136 identified protein spots, seven were classified as protein spots with significant pI shifts and were represented by four gene products, that is fibrinogen β chain isoform 1 (FGA), apolipoprotein E (ApoE), glutathione peroxidase 3 precursor (GPX3) and 39S ribosomal L17, mitochondrial (MRPL17). The analysis of the amino acid sequence of FGA, ApoE and GPX3 using information available in the databases such as Uniprot and NCBI showed that the predicted pI/Mw values corresponded to the sequence of the signal peptide. When these signal peptides were virtually cleaved the pI values for mature form of these proteins were in accordance with calculated pIs. As the MRLP17 protein has a status of unreviewed protein in the Uniprot database (its presence and sequence is predicted based on the cDNA sequence), most probably the pI shift may result from the presence of the signal peptide. Moderate changes in the pI/Mw values observed for other protein spots may reflect the occurrence of posttranslational modifications, such as phosphorylation, glycosylation, acetylation, deamination or proteolytic cleavage, which are mainly responsible for charge and protein size modifications, and in consequence, may influence their electrophoretic mobility (Bouley et al., Reference Bouley, Chambon and Picard2004; Rogowska-Wrzesińska et al., Reference Rogowska-Wrzesinska, Bihan, Thaysen-Andersen and Roepstorffm2013).
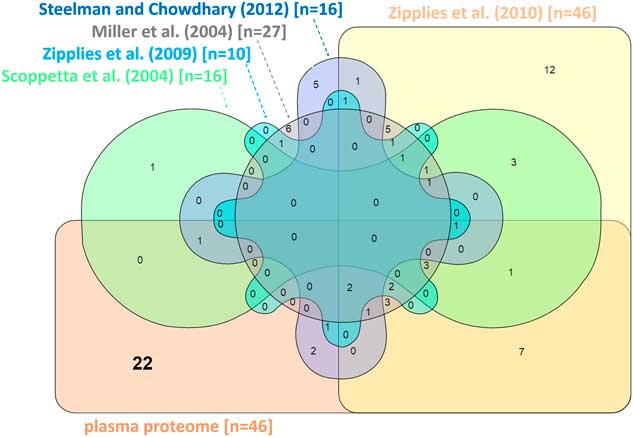
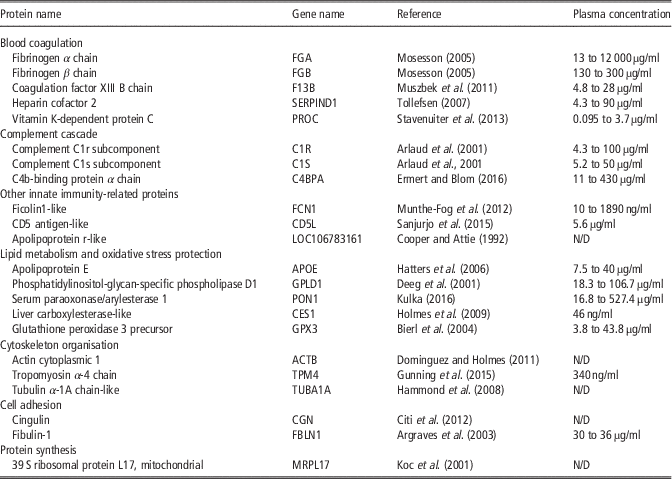
Protein spots identified in the present study, representing 46 different gene products, were compared with all identified blood plasma/serum proteins from all available proteomic studies in horses (Miller et al., Reference Miller, Friendlein, Tsangaris, Maris, Fountoulakis and Gemeiner2004; Zipplies et al., Reference Zipplies, Hauck, Schoeffmann, Amann, Stangassinger, Ueffing and Deeg2009 and Reference Zipplies, Hauck, Schoeffmann, Amann, van der Meijden, Stangassinger, Ueffing and Deeg2010; Scoppetta et al., Reference Scoppetta, Tartagila, Renzone, Avellini, Gaiti, Scaloni and Chiaradia2012; Steelman and Chowdhary, Reference Steelman and Chowdhary2012). The results of this comparison are presented as Venn diagram (Figure 6). Gene products identified in the present study on other 2-D maps are also shown in Table 1. It was found that 22 out of 46 gene products identified in the present study had never been detected on the 2-D maps representing E. caballus blood plasma/serum proteome. It is evident that the depletion of high-abundant proteins from horse blood plasma allowed us to improve the number of identified gene products, and thus provide a broader perspective for biomarker discovery in this animal species. The unique gene products were categorised according to their contribution to the known biological processes, such as blood coagulation, complement cascade, innate immunity, lipid metabolism and oxidative stress protection, cytoskeleton organisation, cell adhesion and protein synthesis, and shortly described in accordance with the Uniprot database in Table 2. Gene ontology analysis showed that almost 30% of all identified gene products belonged to the coagulation and complement cascades. A strong cross-talk between these two cascades has been demonstrated previously (Amara et al., Reference Amara, Flierl, Rittirsch, Klos, Chen, Acker, Brückner, Nilsson, Gebhard, Lambris and Huber-Lang2010). In addition, after activation of these two cascades, the initiation and progression of the inflammatory response was observed (Hierholzer and Billiar, Reference Hierholzer and Billiar2001). In the proteomic investigations aimed at analysing the changes in horse serum/plasma protein pattern in response to various diseases (Zipplies et al., Reference Zipplies, Hauck, Schoeffmann, Amann, Stangassinger, Ueffing and Deeg2009 and Reference Zipplies, Hauck, Schoeffmann, Amann, van der Meijden, Stangassinger, Ueffing and Deeg2010; Steelman and Chowdhary, Reference Steelman and Chowdhary2012), training injuries and overtraining (Scoppetta et al., Reference Scoppetta, Tartagila, Renzone, Avellini, Gaiti, Scaloni and Chiaradia2012), proteins belonging to these two cascades were always mentioned as significantly altered and considered as candidate biomarkers. This is consistent with findings of Miller et al. (Reference Miller, Friendlein, Tsangaris, Maris, Fountoulakis and Gemeiner2004), who pointed out that the establishment of a reproducible methodology for the proper resolution and identification of proteins from these cascades, on 2-D gels representing plasma/serum proteome, may enhance our knowledge about the processes related to physiological and pathological conditions in horses. The analysis of cellular localisation of gene products identified in the current work showed that the majority of proteins are secreted/extracellular, what is consistent with our previous studies aimed at establishing proteins maps of blood plasma/serum of other farm animals, that is pigs (Ożgo et al., Reference Ozgo, Lepczyński and Herosimczyk2015) and cattle (Skrzypczak et al., Reference Skrzypczak, Ożgo, Lepczyński and Herosimczyk2011). It should also be emphasised that the presence of almost 18% of intracellular proteins may suggest that the analysis of horse plasma proteome can also be useful to search for biomarkers directly related to tissue remodelling and dysfunction.
The comparison between the gene products identified in the present study and these that have been previously published using two-dimensional electrophoresis and MS approaches performed in horses. The particular number of the identified gene products are given in brackets. The following references: Zipplies et al. (Reference Zipplies, Hauck, Schoeffmann, Amann, van der Meijden, Stangassinger, Ueffing and Deeg2010 and Reference Zipplies, Hauck, Schoeffmann, Amann, Stangassinger, Ueffing and Deeg2009), Miller et al. (Reference Miller, Friendlein, Tsangaris, Maris, Fountoulakis and Gemeiner2004), Scoppetta et al. (Reference Scoppetta, Tartagila, Renzone, Avellini, Gaiti, Scaloni and Chiaradia2012), Steelman and Chowdhary (Reference Steelman and Chowdhary2012) correspond to the capital letters A to E, respectively that are placed in Table 1.

Identified gene products previously not reported in other two-dimensional maps of blood plasma/serum proteome in horses with reference to the papers describing protein function and blood plasma concentration range according to plasma proteome database (Nanjappa et al., Reference Nanjappa, Thomas, Marimuthu, Muthusamy, Radhakrishnan, Sharma, Ahmad Khan, Balakrishnan, Sahasrabuddhe, Kumar, Jhaveri, Sheth, Kumar Khatana, Shaw, Srikanth, Mathur, Shankar, Nagaraja, Christopher, Mathivanan, Raju, Sirdeshmukh, Chatterjee, Simpson, Harsha, Pandey and Prasad2014)

N/D=no data.
In conclusion, to the best of our knowledge, this is the first report on the 2-DE-based horse blood plasma protein map comprising 46 different gene products. These results can undoubtedly serve as a useful and prospective prerequisite for the future analysis of changes in the plasma 2-DE patterns in different physiological and pathophysiological conditions in horses. The use of the medium- and low-abundant protein enrichment tool increased their abundance and allowed us to identify a higher number of protein gene products. This study reports 22 proteins that have not been previously identified in horse serum/plasma samples using 2-DE. Of these proteins, eight were classified as proteins belonging to the complement and coagulation cascades, which confirms the expectations of other investigators searching for new biomarkers. In addition, the fact that almost 18% of the identified proteins were classified as intracellular proteins may be also useful in the search for biomarkers directly related to tissue remodelling and dysfunction.
Supplementary material
To view supplementary material for this article, please visit https://doi.org/10.1017/S1751731117001409