
I. INTRODUCTION
Room temperature ionic liquid (RTILs)-based electrolytes in electrochemical double layer capacitors (EDLC) are promising alternatives and offer several distinct advantages over aqueous and organic solvent-based electrolytes. These include a wider electrochemical window, higher thermal stability, and nonflammability.Reference Armand, Endres, MacFarlane, Ohno and Scrosati1,Reference Zhang, Sun, He, Lu and Zhang2 However, the main drawback of RTIL is its relative higher viscosity compared to organic solvent-based electrolytes. Consequently, the charge–discharge rate capability of electrochemical double capacitors (EDLC) made of nanoporous carbon electrodes with an ionic liquid electrolyte is limited due to the severe mass transfer limitation. The ionic transport resistance can be mitigated through the design of the hierarchical pore structured carbon with appropriate micro and meso pore size. While the presence of ultramicropores is critical to the availability of the large surface area and contributes significantly to the double layer capacitance, dense microporous carbon with no mesoporosity can accelerate the electrolyte decomposition reaction leading to accelerated pore clogging, loss of cycling, and decreased cycle life of the device. One good way to ensure that there is good interconnected porosity ranging from micro (<2 nm) to meso (2–50 nm) is by designing bimodal carbons. The term bimodal implies that there are two distinct pore size distributions in the range of micropores and mesopores in the carbon. By ensuring that the two pore size distributions are narrower and well connected, carbons with optimum charge storage capability, transport properties, and bulk densities can be synthesized. The use of hierarchical porous carbon (HPC) with bimodal pore size distribution can thus be beneficial in improving the lifetime of the device as well as improving the rate capability.
The use of neat ionic liquids as electrolyte has also made us revisit the basic underlying mechanism of charge storage in double layer capacitors. The Guoy Chapman model is no longer valid and molecular modeling techniques have been developed to throw more insight on the electrode/electrolyte interface.Reference Burt, Birkett and Zhao3–Reference Bazant, Storey and Kornyshev6 Theoretical calculations suggest that at moderate voltages, the surface charge is overscreened by a monolayer of counterions in the first layer followed by excess of co-ions in the second layer. As the voltage is increased, the crowding of counterions extends to the second layer leading to co-ion excess in the third layer. Based on MD simulations using the coarse-grained model using imidalozium cation-based ionic liquids, a capacitance of 3.9 µF/cm2 for positive and 4.8 µF/cm2 for the negative electrode on graphite surface has been predicted.Reference Kislenko, Samoylov and Amirov7–Reference Merlet, Salanne and Rotenberg9 The charge storage is thus dependent upon the ion arrangement at the electrode/electrolyte interface, which is characterized by a large potential overscreening and multiple layers of adsorbed co-ions influenced both by the applied voltage and temperature. Various molecular dynamic simulations and in situ NMR studies with ionic liquids have provided valuable information on the effect of ion dynamics due to micropores and mesopores.Reference Griffin, Forse and Grey10–Reference Banuelos, Feng, Fulvio, Li, Rother, Dai, Cummings and Wesolowski14 When the micropore size is less than 1 nm, there is only one layer of BMIM+ cation that can be accommodated. Under these conditions, various factors such as shape and orientation of the ions, steric ion-pore wall interactions, and electrostatic ion-pair between the cation and anion can influence the diffusion coefficient of ions.Reference He, Qiao, Vatamanu, Borodin, Bedrov, Huang and Sumpter15 Recent MD simulation study has shown that the diffusion coefficient of ions inside the micropore is also a function of the charge density, and it is possible to have very fast ion diffusion that is greater than that in the bulk liquid inside these slit-like micropores. On the other hand, the large cylindrical mesopores allow the formation of alternate layers of cation and anions due to the overscreening and overcrowding effects. The size of the mesopore is then going to dictate the number of layers formed. The hierarchical pore structure of carbon accommodates both these scenarios leading to both high specific capacitances at low current densities with significant contribution from the ultramicropores as well as good capacitance retention at high charging rates due to the presences of ordered and uniformly distributed mesopores. The optimum pore size distribution for neat ionic liquid-based EDLCs may be significantly different from that of organic solvents-based EDLCs depending upon the size of cations and anions.
Hierarchical pore structure can be engineered in carbon using hard templates, such as ordered mesoporous silica and zeolites. Various carbon precursors that include sucrose, furfuryl alcohol, phenolic resin, and pitch were impregnated into the silica template followed by pyrolysis and removal of the hard template to produce bimodal carbons.Reference Dutta, Bhaumik and Wu16–Reference White, Budarin, Luque, Clark and Macquarrie19 The method while producing very well-ordered porous structure provides challenges in terms of cost and scalability for large scale production. Carbons with controlled pore size distribution have also been synthesized using carbide derived carbons by selective etching of transition metal precursors.Reference Jänes, Permann, Arulepp and Lust20–Reference Zhai, Dou, Zhao, Fulvio, Mayes and Dai22 Alternately, pyrolysis of polymer precursors using direct soft template synthesis using surfactants or block copolymers have also yielded HPC. In this case, the surfactant molecules produce micelles which act as structure directing agents and upon pyrolysis create well-ordered mesoporous structures.Reference Dutta, Bhaumik and Wu16,Reference Ma, Liu and Yuan23–Reference Liang and Dai27 These micelles can be used to create spherical microporous carbon materials with a very well-controlled particle size and surface area.Reference Peer, Qajar, Rajagopalan and Foley28 The method while easily scalable is also versatile in developing controlled micropore and mesopore volume. In the past, we have shown that this technique is effective in creating a bimodal pore size distribution through soft-templated pyrolysis of polyfurfuryl alcohol and phloroglucinol.Reference Peer, Qajar, Rajagopalan and Foley29 Simultaneous polymerization of furfuryl alcohol and phloroglucinol using a co-catalyst allowed us to develop a polymer blend that would readily undergo reaction-induced phase separation during pyrolysis to create a micropore-rich region and mesopore rich region that are well dispersed uniformly throughout the carbon matrix. The micropore and mesopore size distribution was altered by changing the ratio of the two monomers during the polymerization.
In this investigation, we demonstrate the usefulness of hierarchical porous carbon developed from simultaneous polymerization of furfuryl alcohol/phloroglucinol for use as electrodes in EDLC made using neat 1-butyl-3-methylimidazolium tetrafluoroborate as electrolyte. The bimodal porosity of the carbons facilitates good capacitance retention at high current densities while maintaining good electrochemical, cycling stability upto 3.8 V at 1 A/g.
II. EXPERIMENTAL
A. Synthesis of PFA_Ph
Simultaneous polymerization of furfuryl alcohol and phloroglucinol was performed as described elsewhere.Reference Peer, Qajar, Rajagopalan and Foley29 Briefly, equal amount of phloroglucinol (purchased from Dot Scientific, Inc., Burton, Michigan) and pluronic F127 (Sigma-Aldrich, Allentown, Pennsylvania) by wt was dissolved in water/ethanol mixture (53% by wt ratio). After complete dissolution of the solid powders in the binary solvent, HCl (37% v/v) was added as initiator in the wt ratio of 0.08:1 based on phloroglucinol. Next, Furfuryl alcohol (Sigma-Aldrich) was added in a ratio of 0.4:1 by wt with respect to phloroglucinol and the mixture was stirred for 30 min until the color changed to light pink. This was followed by the addition of 1:1 by wt of 37% formaldehyde (Sigma Aldrich, Allentown, Pennsylvania) based on phloroglucinol. This resulted in a phase separation after ∼1 h. The polymer-rich phase was separated and kept under magnetic stirring overnight. The resultant polymer was cured in an oven at 90 °C overnight and carbonized in a quartz tube furnace under Argon atmosphere by ramping from room temperature to 350 °C at 1 °C/min and then from 350 to 800 °C at 5 °C/min, where it was soaked for another 8 h. The powder was crushed using mortar and pestle and was subsequently activated using CO2 at 900 °C for a defined period to yield a high surface area bimodal porous carbon (PFA-Ph). In addition to PFA_Ph, commercially available microporous EDLC carbon, YP50 was also used as the electrode for the EDLC experiments.
B. Electrochemical measurements
The CO2-activated carbon was mixed with acetylene black (Alfa Aesar, Haverhill, Massachusetts) as a conductive additive, and Teflon Emulsion (EC-TFE, Electrochem Inc., Woburn, Massachusetts) as a binder in the weight ratio of 85:5:10, respectively. The resultant mixture was roll pressed to make an electrode film with a thickness of ∼100 µm and then punched in a circular shape to make an electrode diameter of 11 mm. All the electrochemical measurements were done by assembling a symmetric EDLC capacitor in 2032 stainless coin cell using the fabricated carbon electrodes and BMIMBF4 ionic liquid soaked in PVDF gel membrane as the electrolyte. The coin cell assembly was done inside a MBraun glove box under inert argon atmosphere with O2 and H2O level less than 0.1 ppm. A Gamry reference 600 potentiostat/galvanostat (Gamry Instruments, Warminster, Pennsylvania) was used to perform Galvanostatic charge–discharge (GCD), Cyclic voltammetry (CV) and Electrochemical impedance spectroscopy (EIS) measurement at room temperature. The EIS and GCD were also conducted at different temperatures ranging from 25 to 70 °C using a 9023 Delta furnace. Before doing impedance and charge–discharge test, the coin cell was stabilized at the desired temperature for 1 h. All impedance measurements were done from 105 Hz to 10−2 Hz using an ac amplitude of 10 mV under open circuit conditions. Cyclic voltammetry was performed over the scan range of 0–3.8 V at various scan rates ranging from 10 to 200 mV/s. The single electrode specific capacitance was computed using CV as: 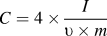 $C = 4 \times {I \over {\upsilon \times m}}$, where υ is scan rate in V/s, I is current in A, m is the active mass of both the electrodes and ΔV is the voltage range. The GCD was performed from 0 to 3.8 V at various current densities ranging from 0.1 to 10 A/g. The specific capacitance was computed based on the discharge curve at different current densities according to
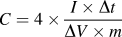 $C = 4 \times {{I \times \Delta t} \over {\Delta V \times m}}$, where I is load current (A), ∆V is the discharge voltage, and m is the active mass of both the electrodes, respectively.
C. Physical characterization
The synthesized carbons were characterized for the textural properties using Micrometrics ASAP 2020 Plus instrument (Micromeritics, Norcross, Georgia). The samples were outgassed at 160 °C for 12 h under a vacuum of 10−5 bar and cooled to −196 °C before measuring the nitrogen adsorption isotherm. Brunauer–Emmett–Teller (BET) was used to calculate the surface area, while the ultramicropore and mesopore size distribution was derived by fitting the nitrogen adsorption isotherm using nonlinear density functional theory (NLDFT) model obtained from SAIEUS (Solution of Adsorption Integral Equation Using Splines) interactive software. The morphology and porous texture of the carbon was further investigated using Field Emission Scanning Electron Microscopy (FESEM) images taken using a Zeiss SIGMA VP-FESEM instrument (Carl Zeiss Microscopy, LLC, Peabody, Massachusetts). The high-magnification SEM images were then analyzed using ImageJ software (https://imagej.nih.gov/ij/, National Institute of Health, Bethesda, Maryland) to obtain visual information on mesopore distribution in the carbon. Talos F200X Transmission Electron microscopy (TEM; FEI, Hillsboro, Oregon) was also used to obtain TEM and dark field STEM images. The STEM images were used to demonstrate the 3D interconnected porous network in the carbon.
III. RESULTS AND DISCUSSION
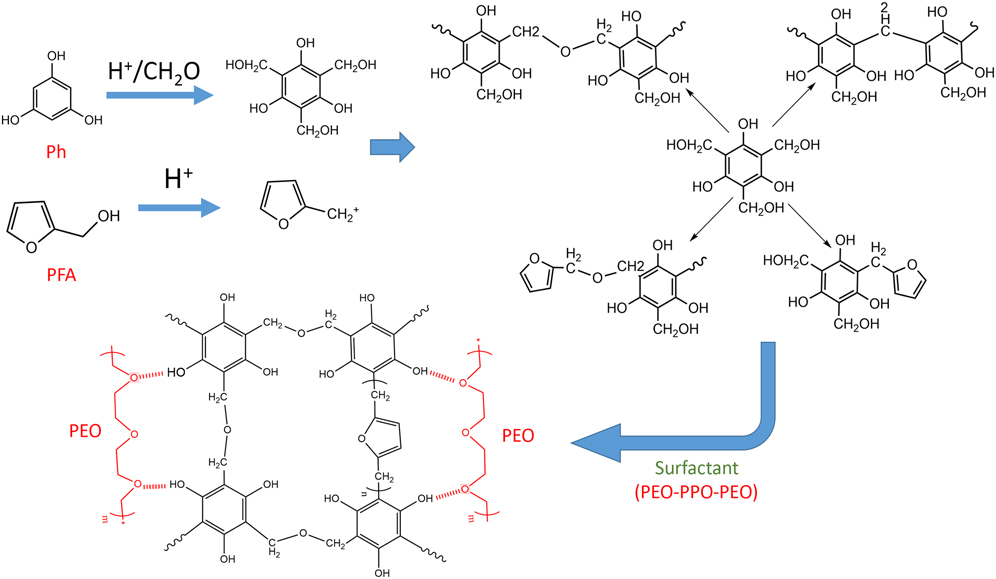
Figure 1 shows the sketch of simultaneous polymerization of furfuryl alcohol and phloroglucinol. It is well known that furfuryl alcohol is polymerized using cationic polymerization in the presence of acid catalysts. The polymerization is triggered by the formation of carbocation intermediates, which subsequently undergoe addition polymerization. Similarly, surfactant templated solgel polymerization of phloroglucinol has also been reported using formaldehyde as linker and acid catalyst to initiate the reaction. In this case, phloroglucinol reacts with formaldehyde in the presence of acid to form a hydroxymethyl derivative. The hydroxymethyl derivative then undergoes polycondensation to form the sol gel polymer. Pyrolysis and activation of these two homopolymers result in high surface area carbons with two distinct pore size distributions. Polyfurfuryl alcohol-derived carbon yields predominantly microporous carbon with pore size <2 nm, while Phloroglucinol/formaldehyde derived carbon produces well-ordered mesopores.Reference Peer, Qajar, Rajagopalan and Foley29,Reference Liang and Dai30 By combining the two monomers and initiating the reaction using an acid co-catalyst, we promote simultaneous polymerization of furfuryl alcohol and phloroglucinol/formaldehyde. We propose a reaction scheme as shown in Fig. 1, which suggests the possibility of homopolymerization of both the monomers along with co-condensation of the polymers to form a gel network. The presence of Pluronic-F127 which is a triblock copolymer surfactant of polyethylene oxide and polypropylene oxide (PEO–PPO–PEO) during the polymerization facilitates soft templating. The hydrophilic side of the surfactant (PEO) can interact strongly with the residual hydroxyl groups in the polymerized product via hydrogen bonding. Such an interaction along with the tendency of the surfactant molecules to self-organize into a micellar network leads to uniform dispersion in the polymer matrix. These networks then act as the structure directing templates during pyrolysis.
Proposed scheme of polymerization of furfuryl alcohol and phloroglucinol.
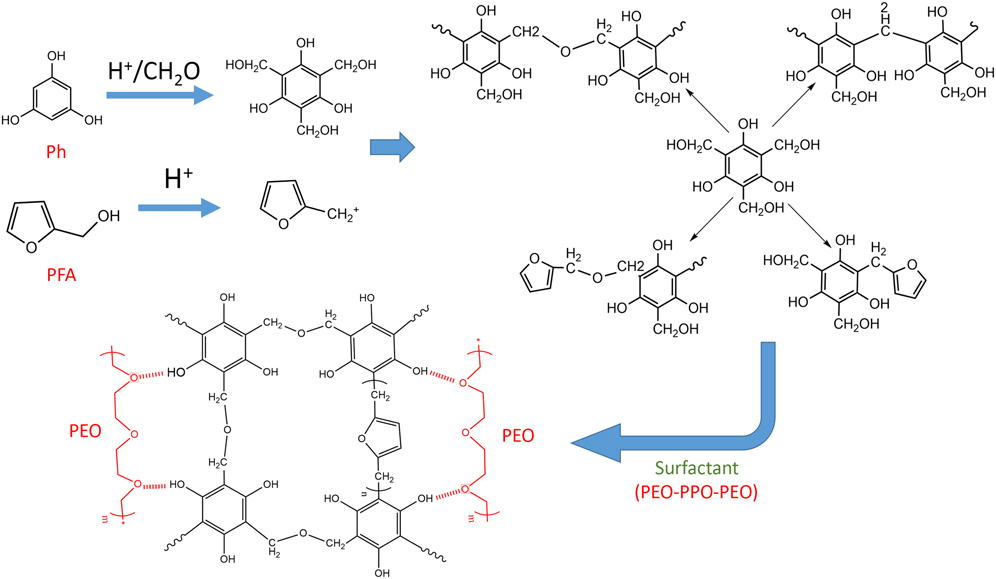
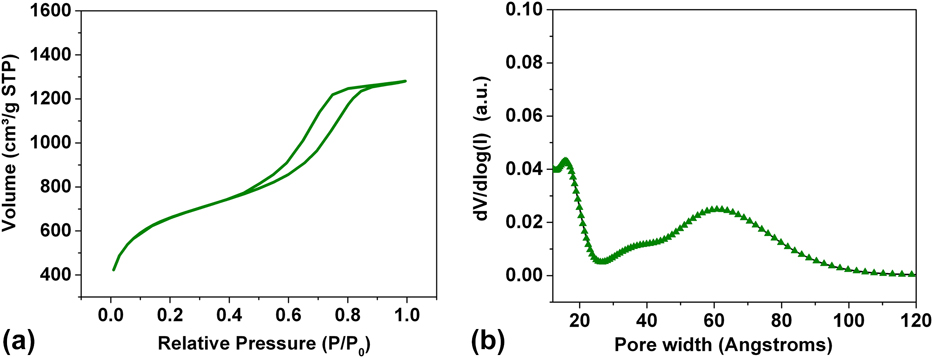
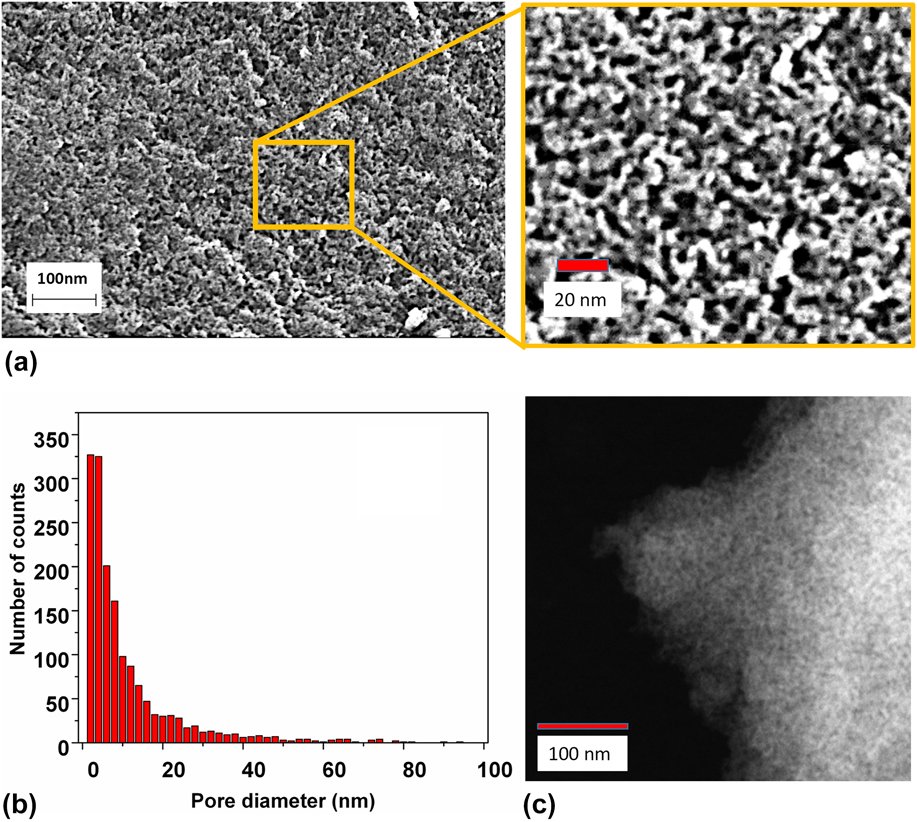
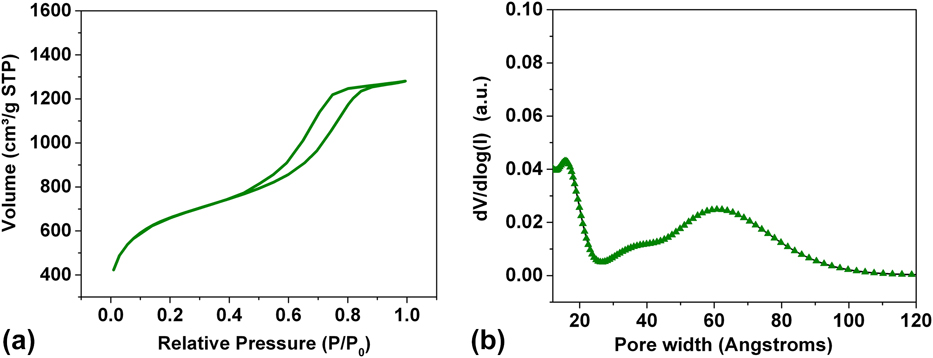
Figure 2(a) shows the Type IV nitrogen isotherm of PFA_Ph after CO2 activation. The presence of mesopores in the carbon was indicated by the hysteresis loop in the adsorption–desorption curves at relative pressures between 0.4 and 0.8, while the micropores were evident from the presence leof significant adsorption at relative pressures <0.03. The NLDFT model shows bimodal porosity with two distinct narrow pore size distribution in the range of ultramicropores (1–2 nm) and mesopores (4–10 nm) as shown in Fig. 2(b). The total micropores and mesopores were computed as 0.74 cc/g and 1.13 cc/g, respectively. The nitrogen BET surface area of the carbon was 2159 m2/g. The uniform texture and distribution of mesopores in the carbon was also confirmed using Scanning Electron microscopy and Scanning Transmission Electron Microscopy. The mesoporous texture of SEM image was analyzed using ImageJ software. Figure 3(b) shows the mesopore size distribution as obtained by the image analysis which shows a distribution around 2–10 nm consistent with the NLDFT analysis. Figure 3(c) shows the STEM image of PFA-Ph. The dark-field STEM image shows a swiss cheese morphology with highly interconnected 3D mesoporous network throughout the carbon. Although, we see a co-continuous 3D porous network, we do not see ordered mesoporous carbon network as observed in soft-templated phloroglucinol-formaldehyde carbons. Based on adsorption isotherm and image analysis, it was clearly evident that the mesopores and microporous network in the carbon are uniformly dispersed and well connected to provide the hierarchical porous carbon texture.
(a) Type IV nitrogen adsorption and desorption isotherm of PFA-Ph showing the presence of hysteresis loop at intermediate relative pressures (0.4–0.8) as well as significant uptake at very low relative pressures (<0.03) and (b) Presence of ordered mesopore size distribution in PFA-Ph determined using the nitrogen adsorption isotherm and the NLDFT model.
(a) SEM micrograph showing hierarchical porous carbon structure with well-connected mesopores in the range of 4–10 nm made using simultaneous polymerization and carbonization of furfuryl alcohol and phloroglucinol. (b) Pore size distribution analysis using ImageJ software showing the mesopore size distribution. (c) TEM micrograph of PFA-Ph showing the presence of mesopores that are uniformly dispersed in the carbon.

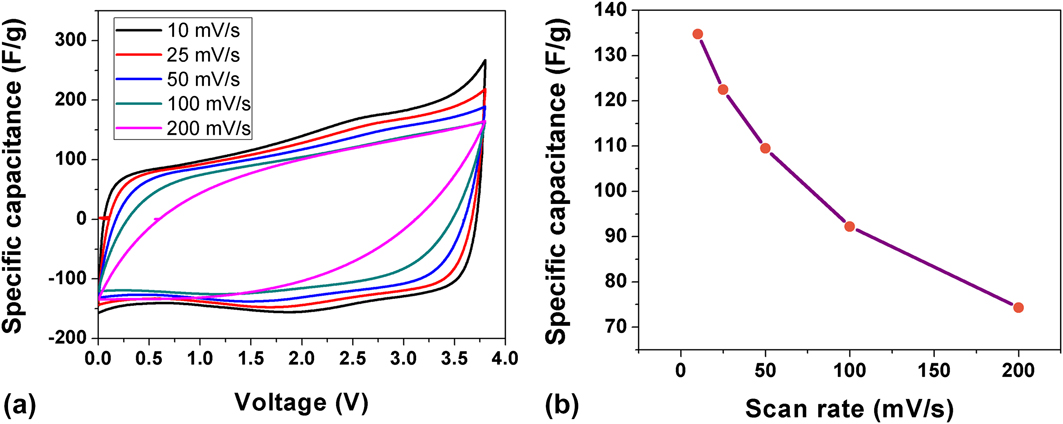
Figure 4(a) shows the cyclic voltammogram cycled between 0 and 3.8 V at different scan rates. The voltammograms show rectangular profile at scan rates upto 50 mV/s. They also show a small reversible peak around 2 V. The origin of this peak was attributed to specific adsorption between aromatic imidazolium ring in the BMIM+ cation and the sp 2 carbon surface due to strong π-stacking interaction.Reference Kislenko, Samoylov and Amirov7,Reference Ghatee and Moosavi31–Reference Zhang, Han, Wang, Ye and Yan33 Such an interaction will cause the BMIM+ cation to align parallel to the graphitic surface resulting in a smaller electrical double layer (EDL) thickness and enhanced differential capacitance at the negative electrode. The electrode capacitance for PFA-Ph was ∼135 F/g at 10 mV/s which monotonically decreased with scan rate to ∼75 F/g at 200 mV/s as shown in Fig. 4(b).
(a) Cyclic voltammogram of capacitor as a function of scan rate made using PFA-Ph in neat BMIMBF4 electrolyte and (b) Specific capacitance of a single electrode measured as a function of scan rate.
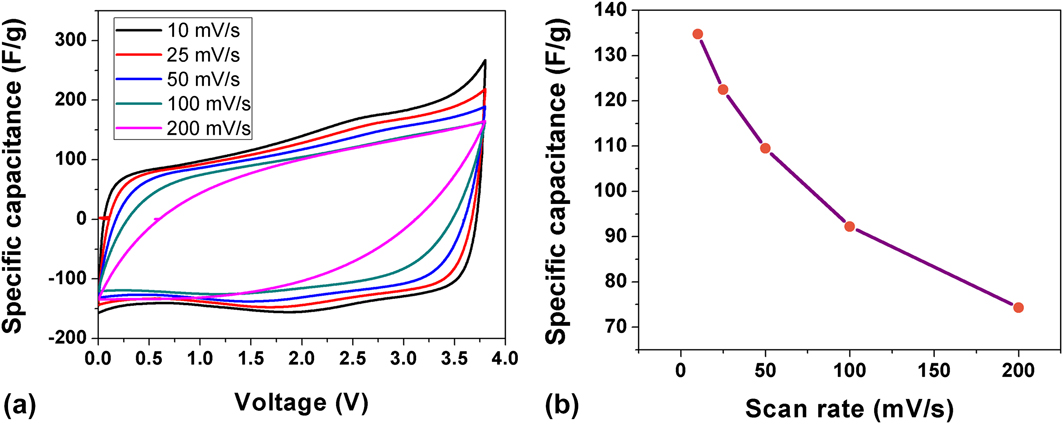
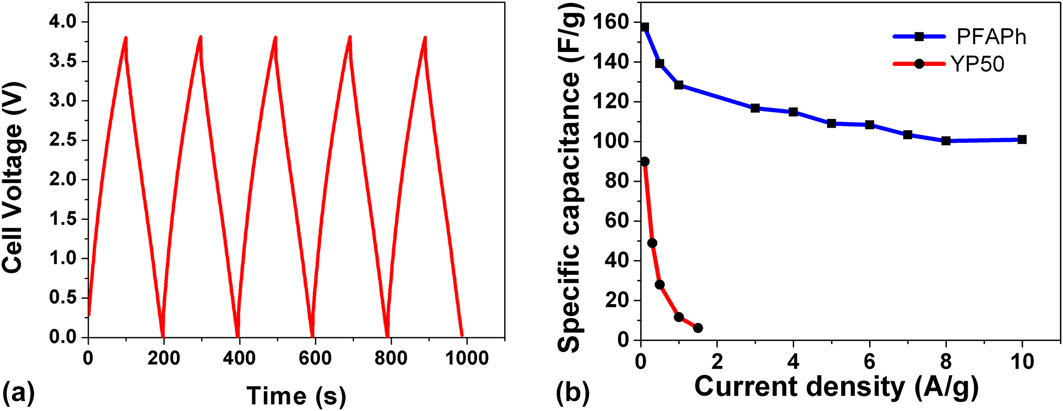
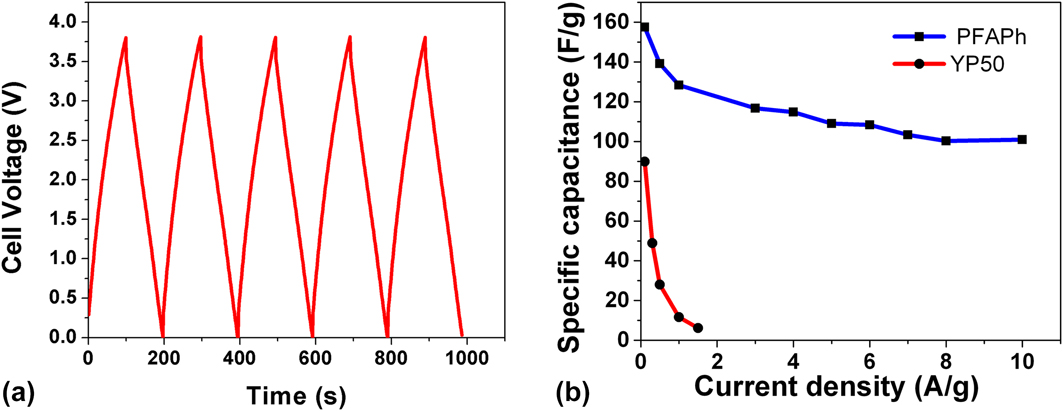
Figure 5(a) shows the galvanostatic charge/discharge cycling of the capacitor upto 3.8 V cycled at 1 A/g. We saw a typical saw tooth profile indicating a capacitive behavior. The cell capacitance was 157.5 F/g at 0.1 A/g. The specific capacitance decreased significantly from 157.5 F/g at 0.1 A/g to 116.7 F/g at 3 A/g, respectively. When the current density was further increased to 10 A/g, the specific capacitance gradually decreased to 101 F/g corresponding to a total capacitance retention of 64% based on the values at 0.1 A/g as shown in Fig. 5(b). In comparison, the purely microporous YP50 carbon-based EDLC showed ∼ half the capacitance (80 F/g) at 0.1 A/g which rapidly decreased to less than 10 F/g at 1.5 A/g. This clearly shows the need to engineer bimodal porosity in the carbons to sustain good performance at high current densities.
(a) Galvanostatic charge/discharge cycling of the capacitor cycled upto 3.8 V cycled at 1 A/g and (b) Specific capacitance as a function of current density for PFAPh and YP50 carbon.
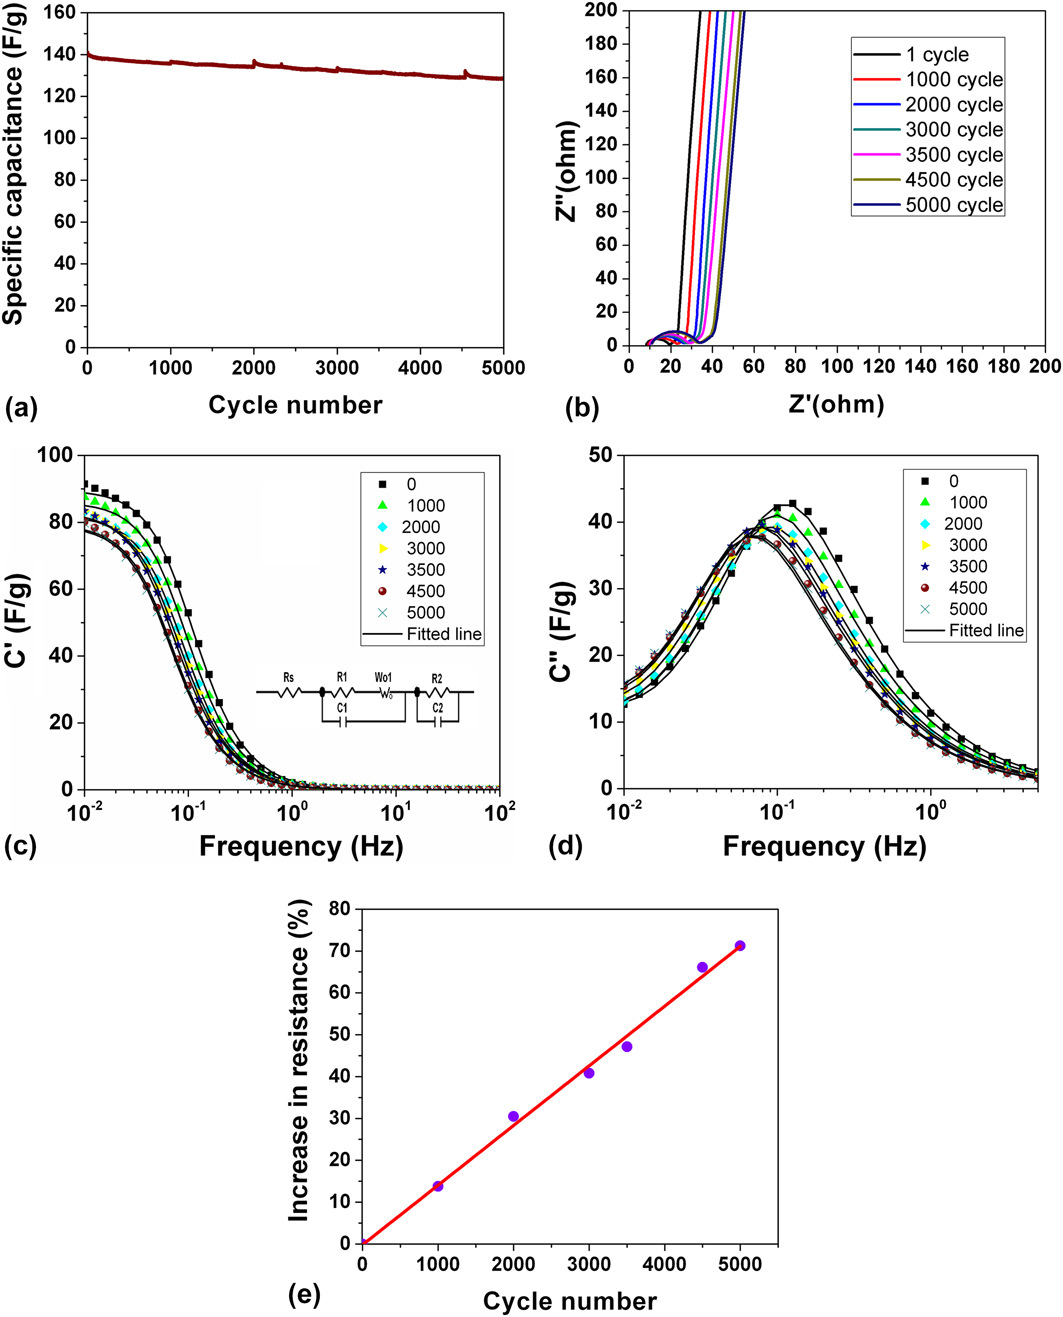
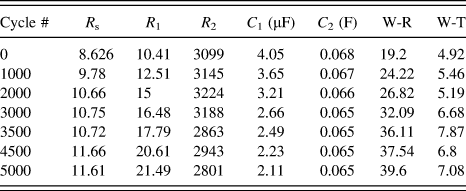
The cycling stability of the capacitor was evaluated using constant current/charge discharge cycling at 1 A/g. The capacitance retention over 5000 cycles was ∼90% when cycled between 0 and 3.8 V as shown in Fig. 6(a). The increase in impedance was also monitored during cycling as shown by the Nyquist plot in Fig. 6(b). All the impedance measurements were done after completely discharging the capacitor to open circuit potential. The impedance spectra showed an x-intercept at very high frequency (∼105 Hz). This was followed by a semicircle and a linear slope at intermediate frequencies. At low frequencies (∼0.01 Hz), we saw a vertical steep slope. This behavior was adequately represented by an equivalent circuit model shown in Fig. 6(c). The x-intercept at very high frequencies shows the ohmic resistive contribution coming primarily from the ionic resistance of the electrolyte as well as contact resistances from the current collector and the electrodes, which was denoted as R s. The semicircle at intermediate frequencies accounted for interfacial resistances at the macroscopic electrode/electrolyte interface, which is essentially determined by the interparticle connectivity in the electrode. This was illustrated using a parallel RC circuit (R 1 and C 1). The presence of linear slope was indicated by the Warburg element, W O, which was connected in series with the interfacial RC circuit. The vertical line at low frequencies was represented by a capacitive element, C 2 to describe the double layer capacitance and a resistive element, R 2 was added in parallel to account for faradaic leakage from parasitic reactions occurring at the electrode/electrolyte interface. Figures 6(c) and 6(d) shows the fitted real and imaginary capacitance Bode plot of the capacitor measured during cycling. The equivalent circuit model was accurately able to describe the capacitor. Table I summarizes the equivalent circuit parameters fitted to the model. As the capacitor was cycled, we saw a gradual increase in R s with cycling over the 5000 cycles. Similarly, the resistance at the interparticle electrode/electrolyte interface (R 1) also steadily increased while the capacitive contribution of the interface slightly diminished. This may be due to small loss of electrolyte ions at the macroscopic interface during cycling. It is to be noted that this capacitance originating from electrode fabrication has very little contribution to the overall electrode capacitance of the device. The Warburg parameters, W-R an W-T, representing the Warburg resistance and time constant also increased with cycling indicating longer diffusion pathways while the double layer capacitance slightly decreased with increase in cycling and was commensurate with the charge/discharge experiments. The leakage resistance contribution slightly increased initially with cycling but then started to decrease with cycles suggesting increased electrolyte decomposition with cycling. The real capacitance Bode plot showed that the capacitance faded by ∼12% which was consistent with the capacitance retention measured using charge/discharge data over 5000 cycles. The overall increase in ESR as determined by the impedance at 1 KHz was ∼70% after 5000 cycles as shown in Fig. 6(e). The time constant for the capacitor shifted from 1.28 s during the initial period to 2.2 s after 5000 cycles. For practical considerations, the aging performance of EDLCs are based on both capacitance retention and ESR of the capacitor. Typically, the stability is judged based on the number of cycles required to retain 80% of the initial specific capacitance or 100% increase in the original resistance.Reference Kotz, Ruch and Cericola34 Based on this criteria, we show excellent cycling stability for 5000 cycles at 3.8 V.
(a) Specific capacitance as a function of number of cycles measured at 1 A/g. (b) Nyquist plot measured after completely discharging the capacitor to open circuit potential intermittently during cycling. Bode plot showing the change of (c) real and (d) imaginary part of complex capacitance during cycling. (e) Plot of increase in ESR during cycling.

Fitted parameters of equivalent circuit model of Impedance data measured during cycling.

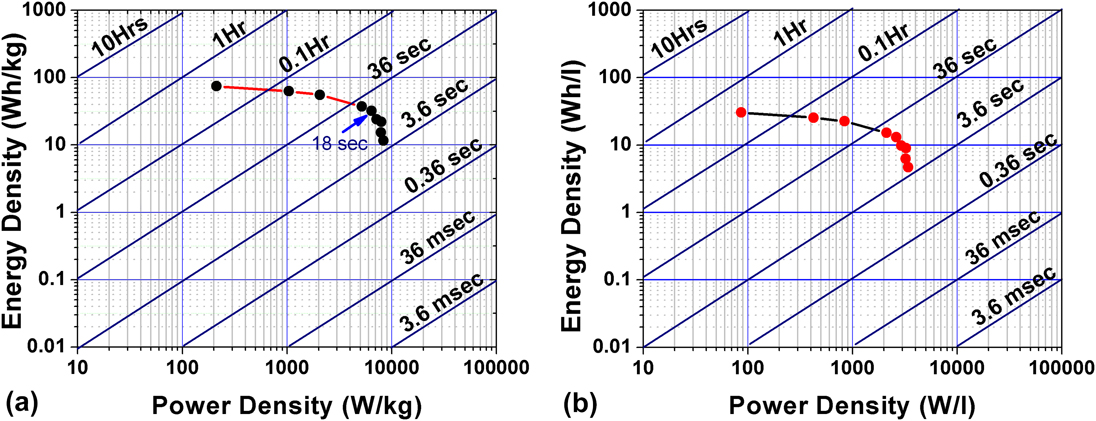
Figures 7(a) and 7(b) shows the Ragone plot of capacitor made using neat ionic liquid as electrolyte. Energy density (E, in W h/kg) was calculated using galvanostatic charge/discharge data according to  $E = {{I\int_0^t {V{\rm{d}}t} } \over {m \times 3.6}}$ in which I (in A) is current, V (in Volt) is discharge potential range, m (in g) is total active mass in the two electrodes, dt (in s) is discharge time. Power density (P, in W/kg) was then computed as
 $P = {E \over {{t_{{\rm{discharge}}}}}}$. The maximum energy density based on the total active mass of both the electrodes was 74.4 W h/kg. The energy density of the capacitor at 1 kW/kg was 62.7 W h/kg and decreased to 32 W h/kg at 6 kW/kg, respectively. Based on the volume of both the electrodes, the capacitor showed a maximum volumetric energy density of 30 W h/L considering a bulk density of 0.48 g/cc of the electrodes. These results are among the highest energy densities of activated porous carbon electrodes reported in the literature.Reference Tee, Tallo, Thomberg, Janes and Lust35–Reference Yamagata, Soeda, Ikebe, Yamazaki and Ishikawa39
(a) Gravimetric and (b) Volumetric Ragone plot of capacitor made using BMIMBF4 as electrolyte.
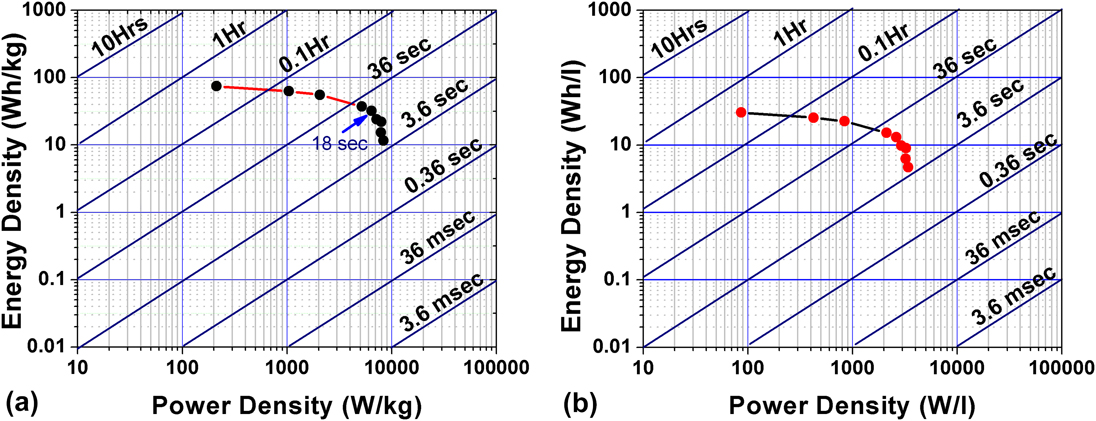
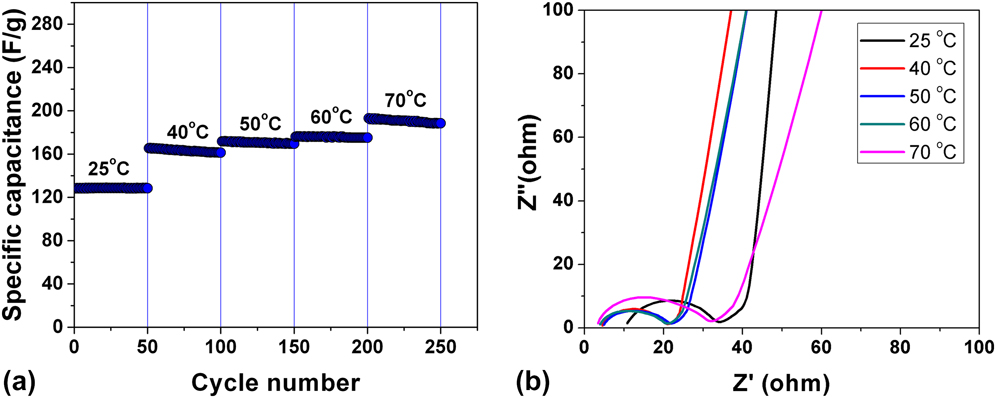
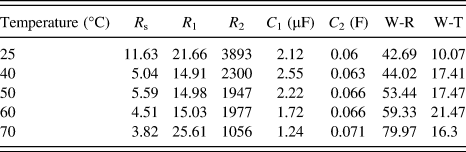
Figure 8(a) shows the specific capacitance measured at 1 A/g as a function of temperature when cycled between 0 and 3.8 V. We saw a strong dependence of capacitance with increased temperature. By increasing the temperature to 70 °C, the specific capacitance increased by almost 48% to 190 F/g. This amounts to an increase in energy density and power density to 79.9 W h/kg at 2.9 kW/kg. We also measured impedance as a function of temperature as shown in Fig. 8(b). Table II summarizes the equivalent circuit parameters for the model fitted to the EIS spectra as a function of temperature. When the temperature was increased from room temperature to 40 °C, we saw a substantial decrease in R s at high frequencies indicating significant reduction in ionic resistance of the electrolyte. This was expected as the viscosity of the ionic liquid should decrease with temperature. The contribution for interfacial resistance decreased with increase in temperature upto 60 °C and then started to increase at 70 °C while the capacitance C 1 monotonically decreased. The decrease in interfacial resistance suggests that the electrolyte ions due to reduced viscosity were able to infuse into the smaller pores of the carbon. The infusion into the smaller pores leads to longer diffusion length as shown by larger Warburg resistance and time constant. At 70 °C, we also saw an increase in R 1 and decreased leakage resistance R 2 suggesting onset of electrolyte decomposition and increased interfacial resistance. The impact of temperature on impedance can be attributed to several factors that include reduction in ion–ion correlations, specific adsorption and surface morphology. Increase in differential capacitance with temperature on the negative electrode due to specific adsorption of BMIM+ has been observed previously both experimentally and theoretically by several researchers.Reference Liu, Han and Yan32,Reference Zhang, Han, Wang, Ye and Yan33 Our observation of both redox peaks at 2.0 V in cyclic voltammetry and strong temperature dependence are in good agreement with this hypothesis. With slight increase in temperature, the adsorption kinetics are improved and we see increase in differential capacitance. We also saw that such temperature dependence was not observed when the electrodes were tested using 1 M Tetraethylammonium hexafluorophosphate dissolved in propylene carbonate as electrolyte. This further stresses the unique presence of specific interaction with the neat ionic liquid and the electrodes.
(a) Specific capacitance as a function of cycling at 1 A/g at different temperatures when cycled between 0 and 3.8 V (b) Nyquist plot measured after completely discharging the capacitor to open circuit potential after cycling at different temperatures.

Fitted parameters of equivalent circuit model of Impedance data collected as a function of temperature.

It is also interesting to think about the impact of specific adsorption in negative electrode on the EDL formed at the positive electrode. The specific interaction in the negative electrode between BMIM+ and the carbon electrode results in a more compact layer increasing the charge density of the electrode.Reference Kislenko, Samoylov and Amirov7,Reference Liu, Han and Yan32 To compensate for increased charge density, the EDL thickness on the positive electrode needs to larger by accommodating more BF4− anions in the double layer. The presence of mesopores in the carbon facilitates the formation of extended EDL. This would lead to larger voltage drop across the EDL at the positive electrode causing asymmetry in the voltage distribution. We hypothesize that this asymmetric voltage distribution could be the reason for increased voltage window with these carbons in the EDLCs.
IV. CONCLUSIONS
An ideal porous electrode design for neat room temperature ionic liquid based electrolyte will have to match the pore size to the size of the cations and anions and also limit the ion diffusion length through uniform dispersion of transport pores in the carbon for rapid ion transport throughout the material. The imidazolium cation-based electrolytes can also have strong specific interaction with the carbon electrode resulting in enhanced capacitance. The article demonstrates the use of hierarchical porous carbon derived from furfuryl alcohol and phloroglucinol prepared using soft templating approach in EDLC made using neat BMIMBF4 electrolyte. The synthesized carbon has well connected ultramicropores and mesopores that provide good accessible surface area for the formation of electrical double layer as shown by microscopy and gas adsorption studies. Specific capacitance as high as 157.5 F/g was achieved leading to maximum gravimetric energy density of 74.4 W h/kg and volumetric energy density of 30 W h/L at room temperature. The carbon also showed strong temperature dependence of capacitance indicating the presence of specific adsorption at the double layer. Such an interaction results in widening the electrochemical window as demonstrated by good cyclability upto 3.8 V for 5000 cycles. Equivalent circuit modeling of the impedance spectra provided further insight on changes in electrode/electrolyte interface during cycling and increased temperature. We believe that this soft templating based synthesis approach is well suited to develop porous carbon materials with tunable bimodal porosity that can be tailored to suit various ionic liquids with different cation and anion sizes.
ACKNOWLEDGMENTS
This work was supported by the National Science Foundation ASSIST Nanosystems ERC under Award Number EEC-1160483. The authors would also like to acknowledge the financial support from NSF I/UCRC Center for Dielectrics and Piezoelectrics and ETCE Research Development Grant from The Pennsylvania State University. In addition, we would like to thank Materials Characterization Laboratory at University Park for providing access to various characterization facilities.